
As if your typical workday isn’t hectic enough, the end of the year brings with it an assortment of additional bookkeeping and accounting tasks. As long as you’ve kept on top of your bookkeeping during the year, you can delegate most of these year-end tasks to QuickBooks with just a few clicks. (If you shrugged off your data entry during the year, even the mighty QuickBooks can’t help.) This chapter describes the tasks you have to perform at the end of each fiscal year (or other fiscal period, for that matter) and how to delegate them to QuickBooks. (The box on QuickBooks’ Year-End Guide describes a QuickBooks feature that helps you remember these various tasks.)
If you work with an accountant, you may never run a report from the Reports→Accountant & Taxes submenu unless your accountant asks you to. But if you prepare your own tax returns, running the following reports at the end of each year will help sniff out any problems:
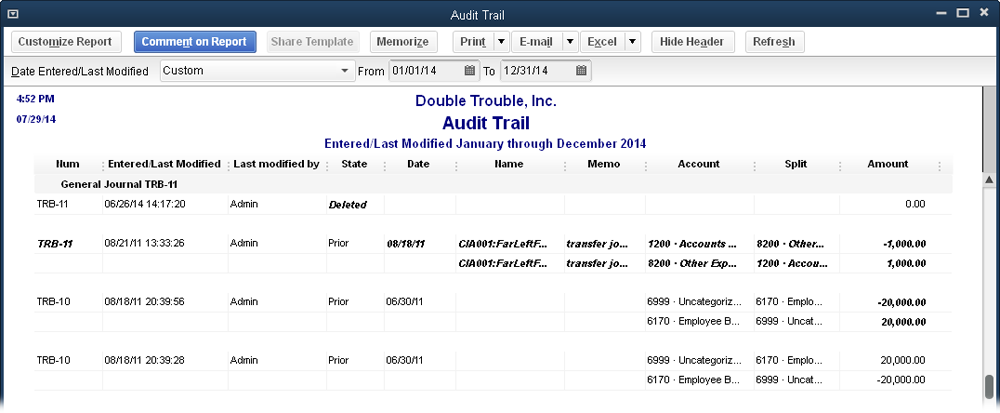
The Audit Trail report (Reports→Accountant & Taxes→Audit Trail) is especially important if several people work on your company file and transactions seem to disappear or change. QuickBooks’ audit trail feature is always turned on, keeping track of changes to transactions, who makes them, and when. You can check this permanent record by running the Audit Trail report—shown in Figure 17-1—to watch for things like deleted invoices or modifications to transactions after they’ve been reconciled. (You have to be the QuickBooks administrator or have permission to generate sensitive financial reports to run this report.)
Figure 17-1. The Audit Trail report shows every transaction that’s been created, changed, or deleted. To see the details of a transaction, double-click it.
People make mistakes, and this report is also good for spotting inadvertent changes to transactions. QuickBooks initially includes only transactions entered or modified today, but you can choose a different date range to review changes since your last review (in the Audit Trail report’s window, choose a date range in the Date Entered/Last Modified drop-down list, or type dates in the From and To boxes).
Note
QuickBooks’ Condense Data utility (Condensing Data) removes the audit trail information for transactions that it deletes. So if you’re watching transaction activity, print an Audit Trail report before using Condense Data, and (as always), back up your company file regularly.
The Voided/Deleted Transactions Summary and Voided/Deleted Transactions Detail reports (which live in the Reports→Accountant & Taxes submenu) focus on transactions that—you guessed it—have been voided or deleted. These reports list who made the changes or deletions and when.
Note
QuickBooks Accountant edition has a host of features that help accountants and bookkeepers spiff up your books at the end of the year. For example, the Client Data Review tool lists review and cleanup tasks to perform. If your accountant finds any issues, she can add notes about what she plans to do. And if you didn’t classify transactions correctly, your accountant can use the Reclassify Transactions features to correct them in a jiffy.
You successfully reconciled your bank account (Reconciling Accounts) and your QuickBooks checking account balance matches your bank statement balance. Things are looking good…until you stumble across a few unreconciled transactions (such as checks, bill payments, and deposits) from previous years—years that you’ve already filed tax returns for and closed in QuickBooks. Good news: there’s a way to clean up these old unreconciled transactions without messing up your tax returns or your reconciliation.
Note
You might wonder how unreconciled transactions from closed periods crop up in the first place. The most likely culprit is an adjustment transaction (Modifying Transactions During Reconciliation) that someone used to force a reconciliation to work. For example, perhaps your predecessor couldn’t find the unreconciled transactions that you’ve discovered. To force the account to reconcile, that person clicked Reconcile Now and told QuickBooks to add an adjustment transaction to make QuickBooks’ balance match the bank’s balance. That adjustment reconciled the account, but it left the real transactions orphaned and unreconciled.
Here’s how to look for old, unreconciled transactions:
In the Home Page’s Banking panel, click Check Register and then, in the Select Account drop-down list that appears, choose the bank account you want to examine.
QuickBooks opens that account’s register window.
At the register window’s bottom left, in the “Sort by” drop-down list, choose “Cleared status.”
Sorting by cleared status makes QuickBooks list Reconciled transactions first (they have checkmarks in the checkmark column), followed by cleared transactions (ones you’ve selected in a reconciliation that’s in progress; they’re indicated by asterisks in their checkmark cells), and finally uncleared transactions (which have blank checkmark cells).
Scroll up the register window’s table to find the first uncleared transaction.
Figure 17-2 includes two uncleared transactions dated from a closed period.
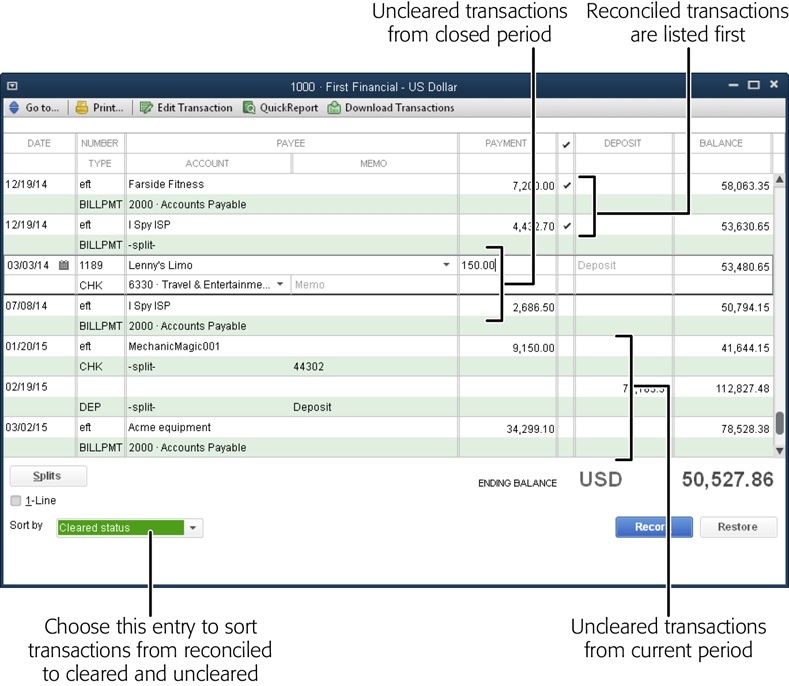
Figure 17-2. In the “Sort by” drop-down list, choose “Cleared status” to display reconciled transactions followed by cleared transactions, and finally uncleared transactions. The first two uncleared transactions here are from the previous year.
Unreconciled transactions from closed periods present a couple of problems. First, they’re part of your records that you used to prepare your tax returns: if you void them, you’d have to file an amended tax return. In addition, if you try to reconcile them as is, your next reconciliation won’t balance. What you need is an offsetting transaction in the current time period. You can use a journal entry to do that. Here’s how:
Choose Company→Make General Journal Entries.
The Make General Journal Entries window opens.
In the Date box, choose today’s date. If necessary, fill in the Entry No. field with a journal entry number.
QuickBooks automatically increments the value in the Entry No. box, but you can type another value if you wish.
In the first Account cell, choose the bank account with the old, unreconciled transaction(s), and then fill in the rest of the fields in that row.
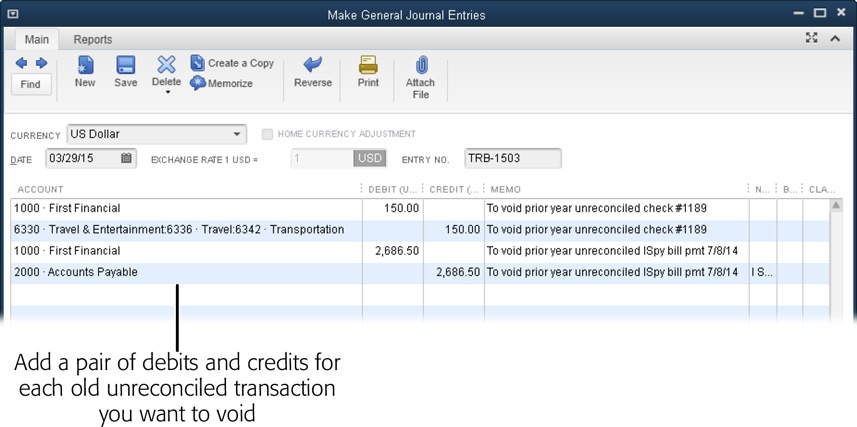
In the row’s Debit cell, fill in the value of the unreconciled transaction (in Figure 17-2, that’s $150). Because the unreconciled check in this example decreased the bank balance, you debit the checking account to increase its balance in the current period. In the Memo cell, type a note, such as “To void prior year unreconciled check #1189.”
In the second row’s Account cell, choose the account used in the unreconciled transaction (in this example, 6342 Transportation).
The program automatically fills in the second row’s Credit cell with the value you typed in the first row’s Debit cell (Figure 17-3). In this example, the original check increased the corresponding expense account’s total. This credit decreases the expense account’s total in the current time period.
Repeat steps 3 and 4 to void other unreconciled transactions from closed periods.
Add pairs of debits and credits for each unreconciled transaction you want to void (you can do this all in the same journal entry).
Figure 17-3. If you’re voiding checks or bill payments, you debit the checking account to increase its balance, and you credit the corresponding expense account to decrease its balance. To void a deposit, you would credit the checking account and debit the account associated with the deposit, such as an income account.
Click Save & Close.
When you save the journal entry, QuickBooks creates transactions that appear in your bank account register. Now all you have to do is reconcile the old transactions and the journal entry transactions:
In the Home Page’s Banking panel, click Reconcile.
The Begin Reconciliation window opens.
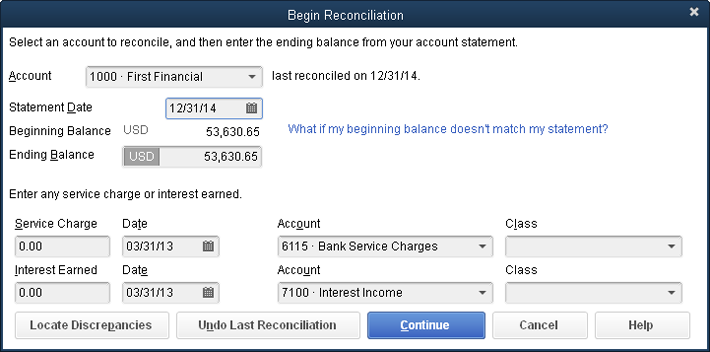
In the Statement Date box, choose the date from your previous reconciliation (Figure 17-4).
For example, if QuickBooks fills in 1/31/15, type 12/31/14 instead.
Fill in the Ending Balance box with the Beginning Balance value, and then click Continue.
The beginning and ending balances are equal because the original unreconciled transaction and the journal entry you created offset one another. The net change to the account balance is zero.
Click Continue and then, in the “Reconcile – <account name>” window that opens, click the checkmark cells for the old, unreconciled transactions and the transactions created by the journal entry, as shown in Figure 17-5.
If everything worked the way it should, the Difference value is 0.00.
Click Reconcile Now.
That’s it! The old transactions are reconciled without affecting the values on your filed tax returns. And your QuickBooks bank account balance and reconciliation still match the numbers from your bank statement.
The Trial Balance report is named after the report’s original purpose: totaling the balances of every account in the debit and credit columns to see whether the debit and credit totals balanced. If they didn’t, the bookkeeper had to track down the mistakes and try again.
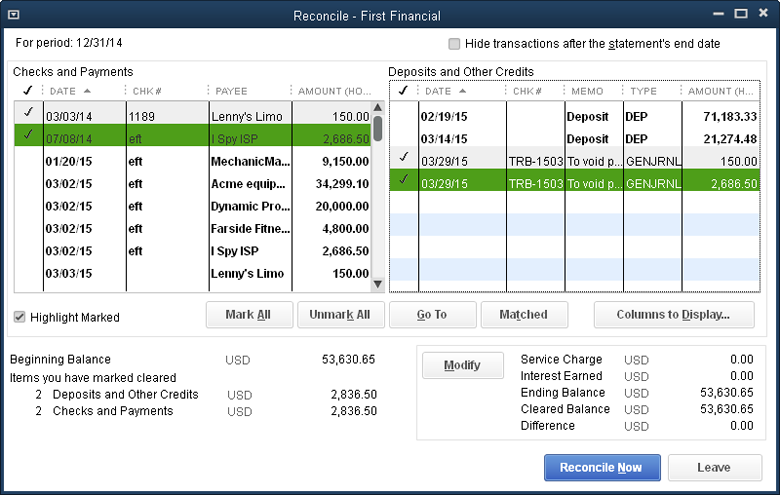
Figure 17-5. When you turn on the checkmarks for the old transactions and the offsetting journal entry transactions, the Difference will be 0.00, as shown here.
QuickBooks doesn’t make arithmetic mistakes, so you don’t need a trial balance to make sure that debits and credits match. Nonetheless, the Trial Balance report is still handy. Accountants like to examine it for errant account assignments before diving into tax preparation or giving financial advice—and for good reason: The Trial Balance report is the only place in QuickBooks where you can see all your accounts and their balances in the same place, as shown in Figure 17-6.
To display this report, choose Reports→Accountant & Taxes→Trial Balance, and QuickBooks generates a Trial Balance report for the previous month. The accounts appear in the same order that they’re listed in your Chart of Accounts window. If you want to see the trial balance for your entire fiscal year, choose This Fiscal Year in the Dates box.
When you keep your company’s books day after day, all those invoices, checks, and other transactions blur together. But hidden within that maelstrom of figures is important information for you, your accountant, your investors, and the IRS. When consolidated and presented the right way, your books can tell you a lot about what your company does right, does wrong, could do better, and has to pay in taxes.
Tip
If you work with more than one currency, the box on Realized Gains and Losses explains how to adjust account balances to reflect currencies’ current values based on exchange rates.
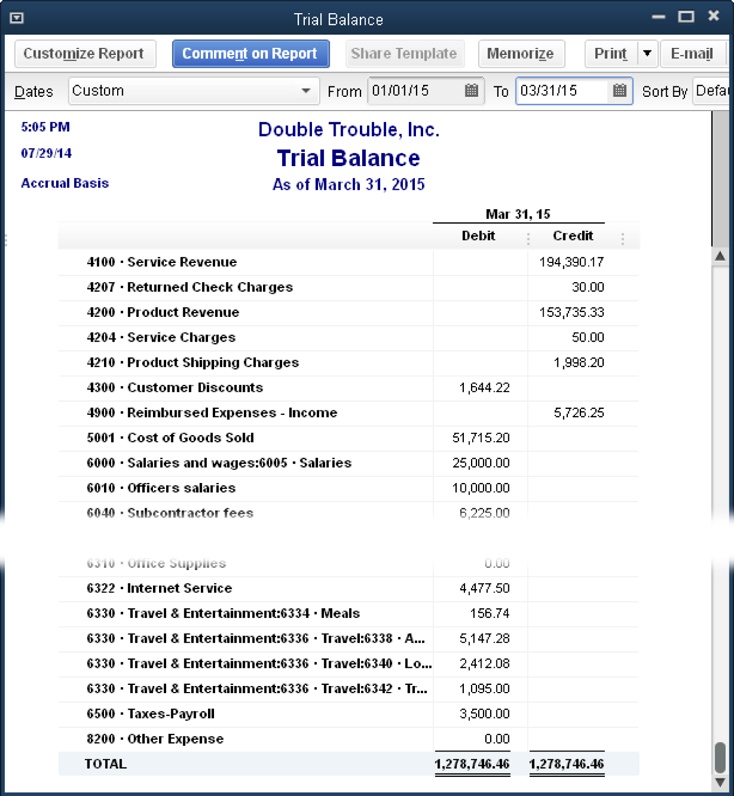
Figure 17-6. If the account balances in your Trial Balance report look a little off, check the heading at the report’s top left. If you see the words “Accrual Basis” in the heading (as shown here) but you use cash accounting for your business, you’ve found the culprit (see page 661 to learn how to set this preference). The same goes if the heading says “Cash Basis” but you use accrual accounting. To set things right, in the report window’s menu bar, click Customize Report. In the Modify Report dialog box that appears, on the Display tab, choose the Accrual or Cash option, and then click OK.
Over the years, the Financial Accounting Standards Board (FASB) has nurtured a standard of accounting known as GAAP (generally accepted accounting principles). GAAP includes a trio of financial statements that together paint a portrait of company performance: the income statement (also known as the profit and loss report), the balance sheet, and the statement of cash flows.
Generating financial statements in QuickBooks is easy. But unless you understand what these statements tell you and you can spot suspect numbers, you may simply end up generating fodder for your paper shredder. If you’re new to business, read the next few sections of this chapter, which are about what the income statement, balance sheet, and statement of cash flows show. If you’re already an expert in all that, jump to the section on generating these reports (Generating a Profit & Loss Report).
Note
When you close out a year on your company’s books, these three special financial reports are a must. If you’re a business maven and need a bunch of additional reports to manage your business, Chapter 23 has instructions for finding the reports you need and customizing them to your demanding specifications.
The Profit & Loss report (Reports→Company & Financial→Profit & Loss Standard) is more like a video than a snapshot. It covers a period of time (a month, a quarter, or a full year, for example) and shows whether your company is making money—or hemorrhaging it.
The money you make selling services or products (called revenue or income) sits at the top of the Profit & Loss report. Beneath it, your expenses gradually whittle away at that income until you’re left with a profit or loss at the bottom. The report shows the progression from sales to the net income your company earned after paying the bills:
Income. The first category in a Profit & Loss report is income, which is simply the revenue your company generates by selling products and services. Regardless of how you earn revenue (selling services or products, or even charging fees), the report shows all the income accounts in your chart of accounts and how much you brought into each one (Figure 17-7).
Figure 17-7. The Income section at the top of the Profit & Loss report lists the accounts that represent the money you make when you sell to customers. Most companies have to subtract the cost of goods sold from income to figure out how much profit they really made. Cost of goods sold may include the cost of materials and labor to build products, the cost of products you purchase for resale, and the cost of sales activities.
Tip
The Profit & Loss report lists accounts in the order they appear in your company file’s chart of accounts. If you want to report your income and expenses in a specific order, you can rearrange the accounts in the Chart of Accounts window (press Ctrl+A to open it). To do that, put your cursor over the diamond to the left of an account’s name. When the cursor changes to a four-headed arrow, drag the account to where you want it.
Cost of Goods Sold. Unless you gather rocks from your yard and then sell them as alien amulets, the products you sell carry some initial cost. For example, with products you purchase for resale, the cost of those goods includes the original price you paid for them, the shipping costs you incurred to get them, and so on. The Profit & Loss report’s Cost of Goods Sold section adds up the underlying costs associated with your product sales.
Note
If you don’t sell inventory items, you might not have a Cost of Goods Sold section in your report. QuickBooks automatically creates a Cost of Goods Sold account when you create your first inventory item. However, if you want to track other costs associated with selling goods—such as how much you paid for the labor required to build the products you sell, the cost of shipping, the cost of sales, and so on—you can create as many additional Cost of Goods Sold accounts as you want.
Gross Profit. Gross profit is the profit you make after subtracting the cost of goods sold from your total income and before subtracting expenses. For example, if you paid $60,000 to purchase equipment and then sold that equipment for $100,000, your gross profit is $40,000. (The box on Profit Percentage explains how to see whether your gross profit is in line with your industry.)
Expense. The next and longest section of the report is for expenses—all the things you spend money on running your business, which are sometimes called overhead. For example, office rent, telephone service, and bank fees all fall into the overhead expense bucket. The name of the game is to keep these expenses as low as possible without hindering your ability to make money.
Net Ordinary Income. QuickBooks uses the term “net ordinary income” to describe the money that’s left over after you pay the bills. (You’ve probably also run across this measure referred to as net profit or net earnings.) Figure 17-8 shows the Expenses and Net Ordinary Income portions of a Profit & Loss report.
Other Income/Expense. Income and expenses that don’t relate to your primary business fall into this category. The most common entrants are the interest income you earn from your savings at the bank, the interest you pay on loans, and bad debt. In this category, income and expense are bundled together and offset each other. The result is called net other income. For example, if you have only a smidgeon of cash in savings but a honking big mortgage, your net other income will be a negative number.
Net Income. At long last, you reach the end of the report. Net income is the money that’s left after subtracting all the costs and expenses you incur. If this number is positive, congratulations—your company made money! If it’s negative, your expenses were more than your income, and something’s gotta give.
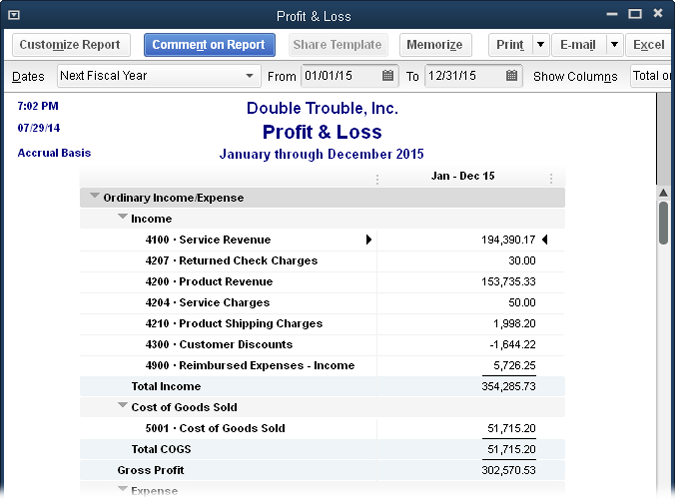
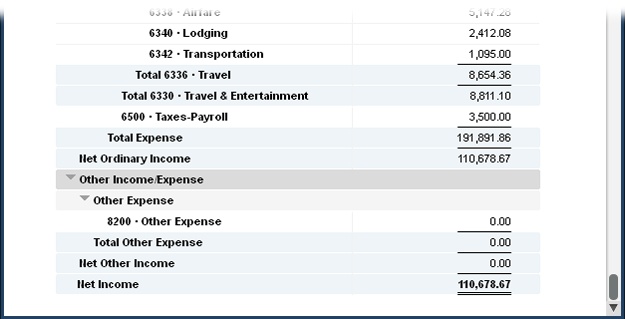
Figure 17-8. If your company makes more money than it spends, your net income is a positive number, as shown here. Profit & Loss reports don’t label your result a loss when your company spends more than it makes. Instead, a loss shows up as a negative net income number, whether it’s net ordinary, other, or overall net income.
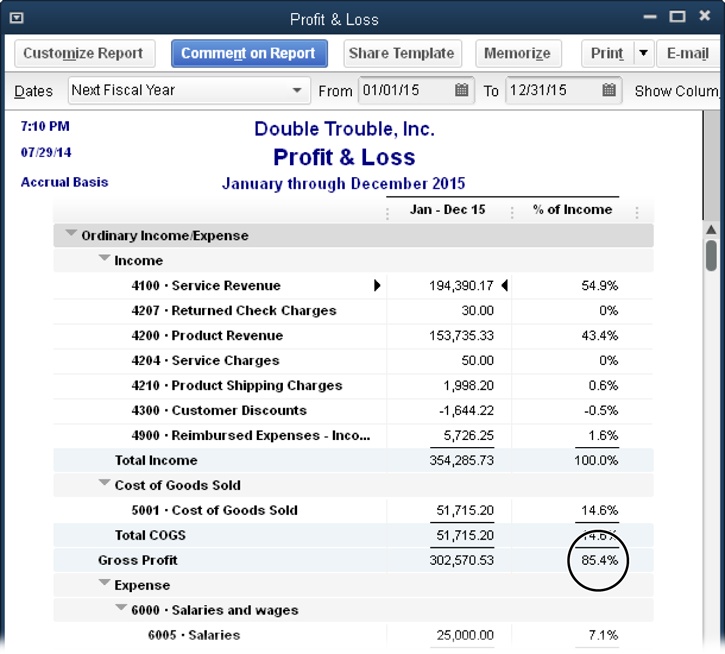
Figure 17-9. You can use the numbers in the “% of Income” column to analyze company performance in various ways. For example, when you’re trying to find places to cut costs, look for expense accounts that take up a large percentage of your income. Or compare your percentage of net profit with the average for your industry.
When you choose Reports→Company & Financial, QuickBooks gives you several built-in profit and loss reports to pick from. Choose Profit & Loss Standard to see a month-to-date report. But for many small companies, month-to-date numbers can be rather sparse. Figure 17-10 describes how to change the month-to-date Profit & Loss report that QuickBooks produces into a quarter-to-date or year-to-date report instead. (Memorizing Reports tells you how to save a report after you tweak it to look the way you want.)
Note
Before you generate your first financial statement, be sure that QuickBooks reports your numbers using your company’s accounting basis. The Summary Reports Basis preference (Company-Wide Report Preferences) sets your reports to either accrual or cash accounting. If you choose the Cash option, your Profit & Loss reports show income only after you receive customer payments and show expenses only after you pay bills. With the Accrual option, income appears in Profit & Loss reports as soon as you record an invoice or other type of sale, and expenses show up as soon as you enter bills.
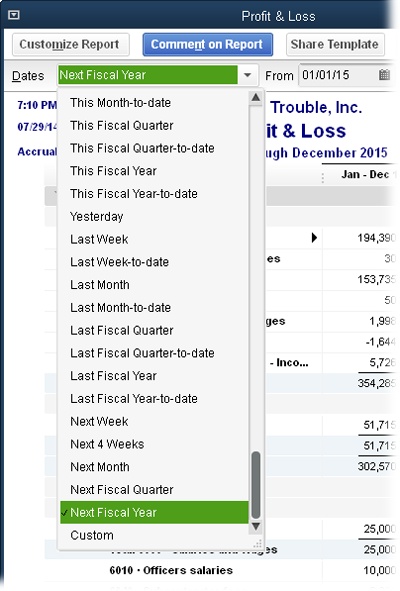
Figure 17-10. The Profit & Loss report window’s Dates drop-down list includes dozens of commonly used date ranges for the current and previous fiscal year. If you choose “This Fiscal Year-to-date,” for example, the dates in the From and To boxes change to the first day of your fiscal year and today’s date, respectively. To select specific dates, in the report window’s From and To boxes, type or choose the dates you want.
If the Profit & Loss Standard report described in the previous section isn’t what you want, take a few minutes to see if any of QuickBooks’ other built-in reports fit the bill. Here’s a guide to the other Profit & Loss reports on the Reports→Company & Financial submenu and when you might use them:
Profit & Loss Detail. Only the tiniest of companies—or the most persnickety of bookkeepers—use this report regularly. It’s a year-to-date report that includes a separate line for every service and product you sold, every other charge that produced revenue, and every item on every bill you paid. It comes in handy when, for example, you restore a backup copy of your company file and want to look at your previous company file to identify the transactions you have to recreate in the restored backup.
Tip
If you spot a questionable number in a report, double-click the number for a closer inspection. (When you put your cursor over a number in a report, it changes to an icon that looks like a Z [for “zoom”] inside a magnifying glass; that’s your clue that double-clicking the number will drill down into the details.) For example, if you double-click a number in a Profit & Loss Standard report, QuickBooks displays a Transaction Detail by Account report that lists each transaction that contributed to the total. In a Profit & Loss Detail report, double-clicking a transaction opens the corresponding window (such as Create Invoices) so you can view that transaction.
Profit & Loss YTD Comparison. This report puts the profit and loss results for two periods side by side: the current month to date and the year to date. However, most businesses prefer to compare a period with its predecessor from the previous year to see business trends more clearly, as the next report does.
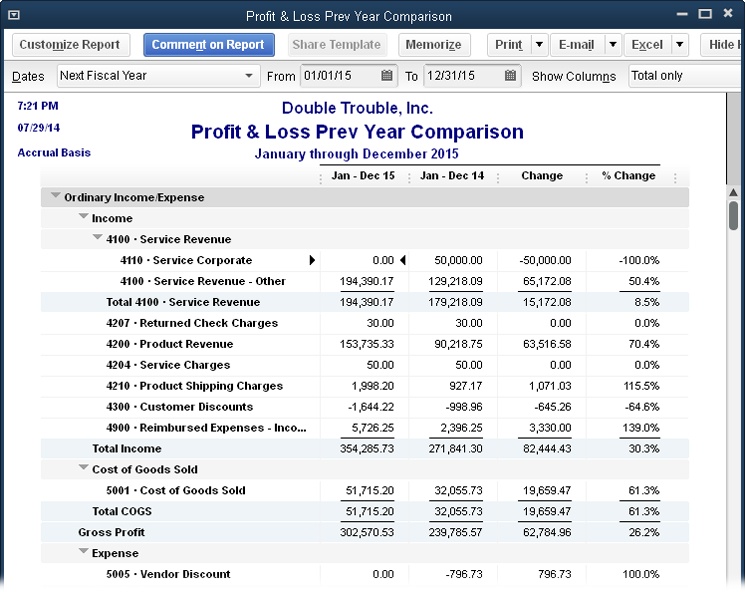
Profit & Loss Prev Year Comparison. If you own a gift shop or other seasonal business, you know that sales are highest during your peak season (for example, around the holidays for gift shops and many retail businesses). If you compared the last quarter of one year with the first quarter of the next, the profit and loss report would look pretty grim: Sales would be down and possibly exacerbated by returns from holiday purchases. To see whether your business is growing, use this report (shown in Figure 17-11) to compare your previous year with the current year.
Figure 17-11. This report sets the Dates box to “This Fiscal Year-to-date” and shows your results for the current year in the first column and those from the previous year in the second column. To see where growth is strong or stagnant, add columns that show the change in dollars or percentages (page 589). Right after your fiscal year ends, you can change the Dates box to Last Fiscal Year to compare the year you just finished with the one before it.
Profit & Loss by Job. If you suspect that some of your customers and jobs are less profitable than others—and you want to learn from your mistakes—run this report. It displays each of your customers and jobs in its own column so you can compare how much profit you made from each one. The box on Profit Percentage tells you how to compare apples to apples in this report.
Profit & Loss by Class. If you use classes to track performance for different business units or locations, run this report, which includes a column for each class. (If you’d rather generate a Profit & Loss report that displays only one class, modify this report [Customizing Reports] to filter for that class.) The last column in this report is Unclassified, which shows all the transactions that don’t have a class assignment. The next report can help you find such transactions.
Profit & Loss Unclassified. If you use classes, then before you pretty up and print your class-based Profit & Loss reports, run this one to see the transactions without class assignments. Depending on how you use classes, unclassified transactions might be perfectly acceptable. For example, if you track income by partner, overhead expenses aren’t related to individual partners. In that situation, most income accounts should have values, but some expense accounts could have zero balances. However, if you created a class for overhead, then you shouldn’t see any transactions in this report. If you do, double-click each transaction to open it in its corresponding window, assign the appropriate class, and then save it.
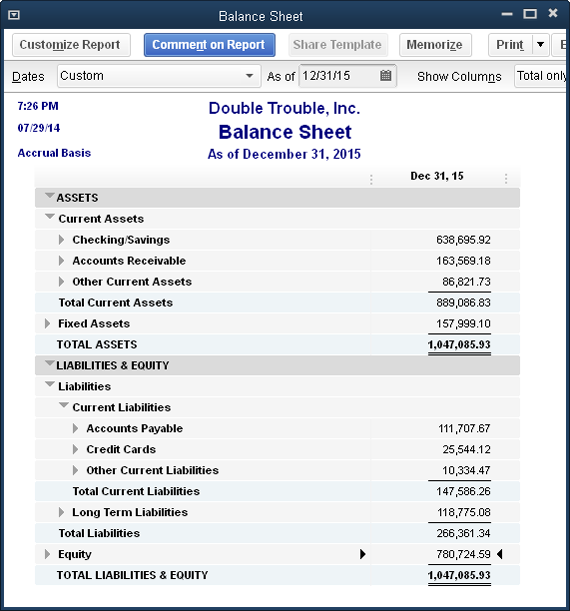
If a profit and loss report is like a video, a balance sheet is more like a portrait. This report (Reports→Company & Financial→Balance Sheet Standard) shows how much your company owns (assets), how much it owes (liabilities), and the resulting equity in the company at a given point in time. While a profit and loss report tells you whether you’re making money, the balance sheet helps you analyze your company’s financial strength.
One thing you can count on with a balance sheet is that there’s a steady relationship among the total assets, total liabilities, and equity, as you can see in Figure 17-12. Here’s the formula that puts the “balance” into balance sheets:
Assets - Liabilities = Equity
As you buy more or borrow more, the value of your equity changes to make up the difference between the value of your assets and liabilities. Another way to look at this equation is that your asset value equals the sum of your liabilities and equity.
Here’s what to look for in each section of a balance sheet:
Assets. Assets are things of value that a company owns, such as equipment, land, product inventory, Accounts Receivable, cash, and even brand names. On a balance sheet, you want to see significantly more money in the Assets section than in the Liabilities section.
Figure 17-12. The key to a good-looking balance sheet is not having too much debt. How much is too much? It depends on the industry you’re in, but the acid test is if you closed up shop today and sold all your assets, would you have enough money to pay off your liabilities? If the answer is no, you’ll have a hard time finding a bank willing to lend you more money.
Note
Even with assets, you can have too much of a good thing. Assets aren’t corporate collector’s items—companies should use assets to make money. A measure called return on assets (the ratio of net income to total assets) shows whether a company is using assets effectively to produce income. Return on assets varies from industry to industry, but, typically, less than 5 percent is poor.
Liabilities. Liabilities include Accounts Payable (bills you haven’t yet paid), unpaid expenses, loans, mortgages, and even future expenses such as pensions. Debt on its own isn’t bad; it’s too much debt that can drag a company down, particularly when business is slow, since debt payments are due every month whether your business produced revenue or not.
Equity. Equity on a balance sheet is the corporate counterpart of the equity you have in your house. When you buy a house, your initial equity is the down payment you make. But both the decreasing balance on your mortgage and any increase in the value of your house contribute to an increase in your equity. Equity in a company is the dollar value that remains after you subtract liabilities from assets. (Net income and retained earnings on your balance sheet change when you move into a new fiscal year. The box on Net Income and Retained Earnings describes what happens behind the scenes.)
A balance sheet is a snapshot of accounts on a given date. The various built-in Balance Sheet reports that QuickBooks offers differ in whether they show only account balances or all the transactions that make up those balances. Choose Reports→Company & Financial, and then pick from the following reports:
Balance Sheet Standard. This report includes every asset, liability, and equity account in your chart of accounts except for ones with zero balances, as shown in Figure 17-12. QuickBooks automatically sets the Dates box to “This Fiscal Year-to-date” so the report shows your balance sheet for the current date. If you want to see the balance sheet for the end of a quarter or end of the year instead, in the Dates box, choose This Fiscal Quarter, This Fiscal Year, or Last Fiscal Year.
Balance Sheet Detail. This report shows the transactions in each of your asset, liability, and equity accounts over a period of time. If a number on your Balance Sheet Standard report looks odd, use this report to verify your transactions. Double-click a transaction’s value to open the corresponding window, such as Enter Bills.
Balance Sheet Summary. If you want to see the key numbers in your balance sheet without having to scan past the individual accounts in each section, this report shows subtotals for each category of a balance sheet, such as Checking/Savings, Accounts Receivable, Accounts Payable, and so on.
Balance Sheet Prev Year Comparison. If you want to compare your financial strength from year to year, this report has four columns at your service: one each for the current and previous years, one for the dollar-value change, and the fourth for the percentage change.
Note
When you review your Balance Sheet Prev Year Comparison report, you typically want to see decreasing liabilities. If liabilities have increased, then assets should have increased as well, because you don’t want to see more debt without more assets to show for the trouble. Equity is the value of your—and your shareholders’, if you have them—ownership in the company, so it should increase each year. (If you use QuickBooks to keep the books for your one-person consulting company, the equity may not increase each year if, for example, you don’t have many company assets and you withdraw most of the profit you make as your salary.)
Balance Sheet by Class. This report lists your asset, liability, and equity accounts, and includes a column for each class. However, to obtain accurate results from this report, you have to enter transactions in a specific way (for example, using only one class in each transaction, and recording transactions using QuickBooks features like Create Invoices and Receive Payments). To learn more about this report, search QuickBooks Help for “balance sheet by class report.”
Thanks to noncash accounting anomalies like accrual reporting and depreciation, profit and loss reports don’t tell you how much cash you have on hand. Looking at QuickBooks’ Statement of Cash Flows report helps you figure out whether your company generates enough cash to keep the doors open. Your balance sheet might look great—$10 million in assets and only $500,000 in liabilities, say—but if a $50,000 payment is due and you have only $3,000 in the bank, you have cash flow problems. (The box on Expert Cash Flow Analysis describes ways to evaluate your cash flow.)
The concept of cash flow is easy to understand. In the words of every film-noir detective, follow the money. Cash flow is nothing more than the real money that flows into and out of your company—not the noncash transactions, such as depreciation, that you see on a profit and loss report. Figure 17-14 shows sources of cash in a sample Statement of Cash Flows.

Figure 17-13. Top: On the last day of your fiscal year (December 31, 2015, here), your net income appears at the bottom of the Balance Sheet report (in the Equity section). At the beginning of the new fiscal year, QuickBooks automatically moves that value into the Retained Earnings equity account. Bottom: When you close your books at the end of a fiscal year, you can create a journal entry to transfer the previous year’s retained earnings from the Retained Earnings account to the Past Equity account. Date the journal entry the last day of the fiscal year (like 12/31/15, as shown here). You debit the Retained Earnings account and credit the Past Equity account.
Warning
Cash provided by operating activities shows how much money your day-to-day operations produce. When you sell an asset (which is an investing activity), it shows up as a gain or loss on the Profit & Loss report, which temporarily increases or reduces your net income. Beware: The effect of investing activities on the Profit & Loss report can hide problems brewing in your operations, which is why you should examine the Statement of Cash Flows report. If your income derives mainly from investing and financing activities instead of operating activities, you’ve got a problem.
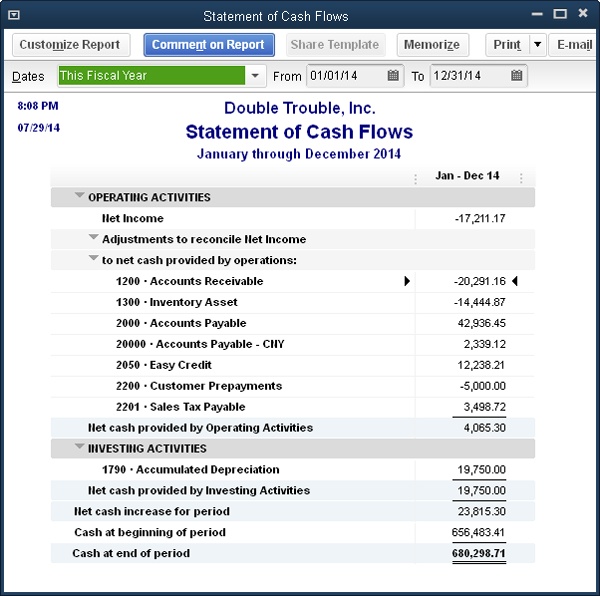
Figure 17-14. A Statement of Cash Flows report organizes transactions into various activity categories. Cash from operating activities is the most desirable; when a company’s ongoing operations generate cash, the business can sustain itself without cash coming from other sources. Things like buying and selling buildings or making money in the stock market using company money are investing activities. Borrowing money or selling stock in your company brings in cash from outside sources, called financing activities. (New companies often have no other sources of cash.)
To create a Statement of Cash Flows, QuickBooks automatically assigns the accounts that appear in your company’s balance sheet to one of the three cash flow categories—operating, investing, or financing—and the program almost always gets those assignments right. For example, Accounts Receivable and Inventory appear as operating accounts, fixed asset accounts show up as investing, and accounts for loans fall under financing. Unless you’re a financial expert or your accountant gives you explicit instructions about a change, you’re better off leaving QuickBooks’ account classifications alone. If you need to reassign accounts for your Statement of Cash Flows report, this section tells you how.
Generating a Statement of Cash Flows is easy because you have only one report to choose from. Simply choose Reports→Company & Financial→Statement of Cash Flows, and QuickBooks creates a report that displays your cash flow for your fiscal year to date. To view the Statement of Cash Flows report for a quarter or a year instead, in the Dates box, choose This Fiscal Quarter or This Fiscal Year.
Note
The Operating Activities section of the report includes the label “Adjustments to reconcile Net Income to net cash provided by operations.” What that means is that QuickBooks calculates the net income at the top of the Statement of Cash Flows report on an accrual basis (meaning income appears as of the invoice date, not the day the customer pays). But the Statement of Cash Flows is by nature a cash-based report, so the program has to add and subtract transactions to get net income on a cash basis. (See Table 1 for more on the difference between cash-based and accrual-based accounting.)
The account assignments for the Statement of Cash Flows report are controlled by a collection of QuickBooks preferences. Here’s how to view the account assignments or change them:
In the Statement of Cash Flows report window’s toolbar, click the Classify Cash button.
The Preferences dialog box opens to the Reports & Graphs section and selects the Company Preferences tab (as long as you have QuickBooks administrator privileges, that is). You can also open this dialog box by choosing Edit→Preferences→Reports & Graphs.
In the Preferences dialog box, click the Classify Cash button.
QuickBooks opens the Classify Cash dialog box.
To change the category to which an account belongs (Operating, Investing, or Financing), click the cell in the column for the new category.
If you made changes and fear you’ve mangled the settings beyond repair, click Default to reset the categories to the ones QuickBooks used initially.
When the assignments are the way you want, click OK to close the dialog box.
That’s it—you’ve reassigned the accounts.
Although financial statements are the ones that people like shareholders and the IRS want to see, other financial reports help you, the business owner, keep tabs on how your enterprise is doing. Here are a few QuickBooks reports that can help you evaluate your business’s performance:
Note
Reports that apply to specific bookkeeping and accounting tasks are explained in the chapters about those tasks, such as Accounts Receivable reports in Chapter 13.
Reviewing income and sales. If you’re introducing enhanced services to keep your best customers—or you’re looking for the customers you want your competition to steal—use the Income by Customer Summary report (Reports→Company & Financial→Income by Customer Summary). It shows total income for each of your customers; that is, the total dollar amount from all your income and expense accounts associated with each customer. Customers with low income totals might be good targets for more energetic sales pitches. If you find that most of your income comes from only a few customers, you may want to protect your income stream by lining up more customers. (One thing this report doesn’t show is how profitable your sales to customers are; the box on Profit Percentage explains how to see that.)
Tip
If you want to produce a report showing performance over several years to evaluate trends, you can set a report’s date range to include the years you want to compare. Then modify the report as explained on Customizing Reports to include a column for each year.
Reviewing expenses. On the expense side, the Expenses by Vendor Summary report (Reports→Company & Financial→Expenses by Vendor Summary) shows how much you spend with each vendor. If you spend tons with certain vendors, maybe it’s time to negotiate volume discounts, find additional vendors as backups, or set up electronic ordering to speed up deliveries.
Tip
The Company Snapshot (The Company Snapshot) is another tool that helps you evaluate how your business is doing. For example, the Company Snapshot window’s Company tab can include graphs such as Prev Year Income Comparison, Income Breakdown, Prev Year Expense Comparison, Expense Breakdown, Income and Expense Trend, and so on.
Comparing income and expenses. The Income & Expense Graph (Reports→Company & Financial→Income & Expense Graph) includes a bar graph that shows income and expenses by month and a pie chart that breaks down either income or expenses (click Income or Expense at the bottom of the report’s window to choose which one is displayed). To specify how you want QuickBooks to display your income or expenses, in the window’s icon bar, click By Account, By Customer, or By Class. You can’t change the time periods for each set of bars on the graph.
What you’ve sold. Most companies analyze their sales to find ways to improve. Maybe you want to beef up sales to customers who haven’t bought from you in a while, turn good customers into great ones, or check how well your stuff is selling. The Sales by Customer Summary report (Reports→Sales→Sales by Customer Summary) is a terse listing of customers and how much you’ve sold to each one during the timeframe you specify; it initially shows values for this month to date.
The Sales Graph (Reports→Sales→Sales Graph), on the other hand, presents sales data in a cheery rainbow of colors, and you can quickly switch the graph to show the breakdown of sales by customer, item, or sales rep. The bar graph shows sales by month for the year to date. To change the duration covered by the graph, click Dates and then specify the date range you want. The pie chart shows sales based on the category you choose: In the window’s toolbar, click By Item, By Customer, or By Rep.
The Sales by Item Summary report (Reports→Sales→Sales by Item Summary) shows how much you sell of each item in your Item List, starting with inventory items, followed by Non-inventory Parts, Service items, and finally Other Charge items. This report also includes columns for average cost of goods sold (COGS) and gross margin, which apply only to inventory items you sell.
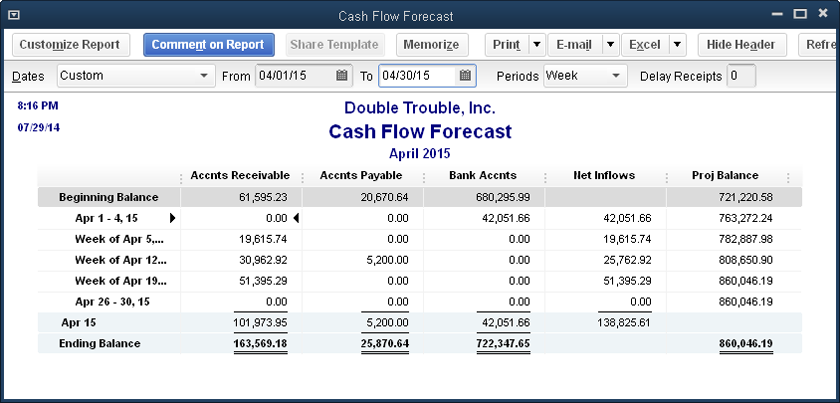
Forecasting cash flow. Say you’re wondering whether you have any invoices due that will cover a big credit card bill that’s coming up, or whether income over the next few weeks is enough to meet payroll. At times like that, use the Cash Flow Forecast report (Reports→Company & Financial→Cash Flow Forecast) to see how much cash you should have over the next four weeks, as shown in Figure 17-15. The Beginning Balance row shows the current balance for your Accounts Receivable, Accounts Payable, and bank accounts. The Proj Balance column shows how much money you should have in your bank accounts at the end of each week (or longer if you choose a different option in the Periods drop-down list). If a number in that column starts flirting with zero, you’re about to run out of cash. You’ll have to speed up some customer payments, transfer cash from another account, or look into a short-term loan.
Figure 17-15. To view more than four weeks, type the date range you want in the From and To boxes or, in the Dates drop-down list, choose Next Fiscal Quarter or Next Fiscal Year. To change the length of each period in the report, in the Periods drop-down list, choose from Week, Two Weeks, Month, and so on.
Whether your accountant has the honor of preparing your taxes or you keep that excitement for yourself, you can save accountant’s fees and your own sanity by making sure your company file is ready for tax season. The key to a smooth transition from QuickBooks to tax preparation is linking each account in your chart of accounts to the correct tax line and tax form. (The box on Realized Gains and Losses describes another tax-preparation task.)
Reviewing the Income Tax Preparation report (Reports→Accountant & Taxes→Income Tax Preparation) can save you money on accountant’s fees and prevent IRS penalties (as well as keep more of your hair attached to your scalp). As shown in Figure 17-16, this report lists the accounts in your chart of accounts and the tax lines to which you assigned them. If an account isn’t linked to the correct tax line—or worse, not assigned to any tax line—the Income Tax Summary report (described in a sec), which lists each line on your tax return with the amount you have to report, won’t display the correct values. See Creating an Account to learn more about choosing tax lines for accounts.
When all the accounts in your chart of accounts are assigned to tax lines, you can generate a report with all the values you need for your company’s tax return. Choose Reports→Accountant & Taxes→Income Tax Summary. Because you usually run this report after the fiscal year ends and all the numbers are in, QuickBooks automatically chooses Last Tax Year in the Dates box.
Note
As one last reminder of unassigned accounts, the last two lines of the Income Tax Summary report are “Tax Line Unassigned (balance sheet)” and “Tax Line Unassigned (income/expense).” To see the transactions that make up either of these unassigned values, double-click the number in the corresponding line.
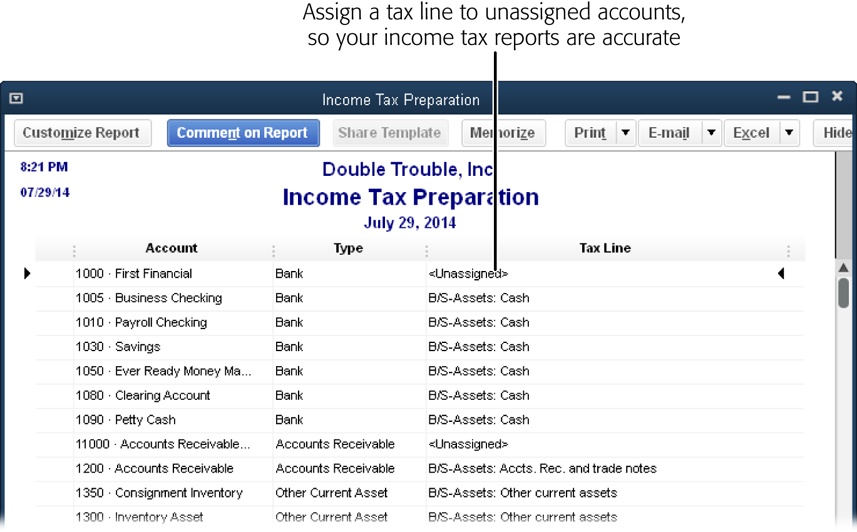
Figure 17-16. If you see “<Unassigned>” in the Tax Line column, you need to assign a tax line to that account. (The easiest way to identify the correct tax line is to ask your accountant or tax professional.) To edit an account, press Ctrl+A to display the Chart of Accounts window. Select the account, and then press Ctrl+E to open the Edit Account window. In the Tax Line Mapping drop-down list, choose the tax form and line for that account.
If you work with an accountant who uses QuickBooks, there are times when a tug-of-war over your company file is inevitable. You want to perform your day-to-day bookkeeping, but your accountant wants to review your books, correct mistakes you’ve made, enter journal entries to prepare your books for end-of-quarter or end-of-year reports, and so on. QuickBooks has two ways for you and your accountant to share:
With an accountant’s review copy, the two of you can stop squabbling because you each get your own copy of the company file. That way you can work on everyday bookkeeping tasks while your accountant tackles cleaning up earlier periods.
The external accountant user is a superpowered user who can look at anything in your company file except sensitive customer information like credit card numbers. You set up an external accountant user in your company file for your accountant so he can log into your file, review every nook and cranny of your company’s data (with QuickBooks’ Client Data Review tool, which is designed specifically for accountants), make changes, and keep track of which changes are his and which are yours.
This section explains both of these approaches. The box on Ways to Work with an Accountant describes other ways you can collaborate with your accountant.
The secret to an accountant’s review copy is a cutoff date that QuickBooks calls the dividing date. Transactions before this date are fair game for your accountant, who can work on the accountant’s review copy in the comfort of his own office. Transactions after that date are under your command in your original company file. When your accountant sends a file with changes back to you, QuickBooks makes short work of merging his changes into your company file.
You have to be in single-user mode to create an accountant’s copy. To switch to single-user mode, first make sure that everyone else is logged out of the company file, and then choose File→“Switch to Single-user Mode.” After that, creating an accountant’s review copy is a lot like creating other kinds of copies of your company file:
Tip
If you have a few dozen windows open and laid out just the way you want, there’s no need to gnash your teeth as QuickBooks closes all your windows to create the accountant’s copy. Before you create the accountant’s copy, save the current window arrangement so the program can reopen all those windows for you: Simply choose Edit→Preferences→Desktop View. On the My Preferences tab, choose the “Save current desktop” option, and then click OK to close the Preferences dialog box. After you create the accountant’s copy, close and then reopen your company file to restore your saved windows.
Choose File→Send Company File→Accountant’s Copy→Save File. Then, in the Save Accountant’s Copy dialog box (which automatically selects the Accountant’s Copy option), click Next.
If your accountant needs unrestricted access to the file, select the “Portable or Backup File” option instead and see Sending Company Files to Others to learn how to create those types of files.
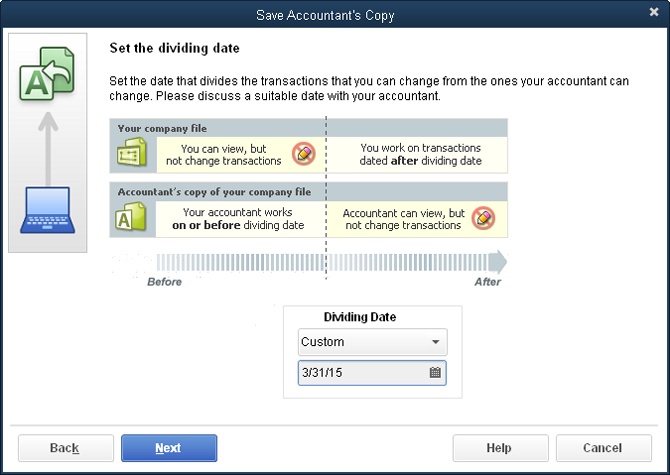
On the “Set the dividing date” screen shown in Figure 17-17, choose the date when control over transactions changes hands. Click Next and then, in the message box about closing windows, click OK.
Use the Dividing Date drop-down list to choose the date you want as the dividing line between your work and your accountant’s work. The upper part of the screen explains what each of you can do before and after the dividing date. (See the box on Ways to Work with an Accountant for more on accountant copy restrictions.) You can work on transactions after the dividing date, but only look at transactions before the dividing date. Your accountant, on the other hand, can work on transactions before the dividing date, but only look at transactions after the dividing date.
In the Save Accountant’s Copy dialog box, choose the folder or drive where you want to save the copy.
QuickBooks sets the “Save as type” box to “QuickBooks Accountant’s Copy Transfer Files (*.QBX)” and automatically names the file using the company file’s name followed by “Acct Transfer” and the date and time you created the file. (The extension .qbx stands for QuickBooks Accountant Transfer File.) You’re free to edit the filename. Accountant’s review copies use the QuickBooks portable file format, so they’re usually small enough to email or save to a USB thumb drive. For example, a 20-megabyte company file may shrink to an accountant’s review copy that’s less than 2 MB.
Figure 17-17. The dividing date you use is often the end of a fiscal period. The Dividing Date drop-down list gives you only a few choices: End of Last Month, 2 Weeks Ago, and 4 Weeks Ago. If none of those options is what you want, you can specify a date by choosing Custom and then typing or choosing the date in the box that appears.
To create the accountant’s review copy, click Save.
Once you create an accountant’s copy, QuickBooks reminds you that it exists: In the QuickBooks program window’s title bar, you’ll see the words “Accountant’s Changes Pending” immediately after the company name.
Send the file to your accountant.
Email the file to your accountant, or copy it to a CD or a USB thumb drive and send it to him. If you use a password on your company file (an excellent idea, no matter how tiny your company is—see Adding New Users), don’t forget to tell your accountant the password for the account you’ve set up for him.
Note
If your accountant has access to Intuit’s Accountant’s Copy File Transfer Service, you can tell QuickBooks to create an accountant’s review copy and send it to your accountant (choose File→Send Company File→Accountant’s Copy→Send to Accountant); the copy goes up on a secure Intuit server, and your accountant gets an email notifying him that the file is waiting there. The only downside to this approach compared with sending the file yourself is that you have to wait until the file is transferred to the Intuit server before you can start working in QuickBooks again.
The company file your accountant sends back to you will have the file extension .qby instead of .qbx to indicate that it’s an accountant’s review copy import file. (Y follows X in the alphabet. Get it?) If you’ve imported data (like customer records) into QuickBooks before (Correcting Errors), the following steps should be familiar:
If your copy of the company file isn’t open, open it and back it up (Backing Up Files) before you import your accountant’s changes.
Choose File→Send Company File→Accountant’s Copy→Import Accountant’s Changes from File. In the Import Accountant’s Changes dialog box, navigate to the disk or folder that contains the accountant’s file, and then double-click the filename.
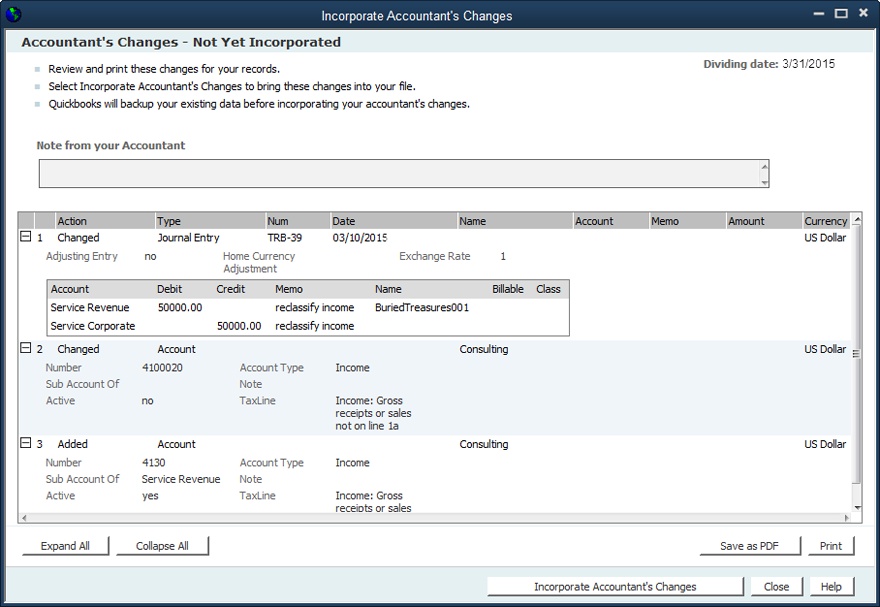
QuickBooks displays the changes your accountant made, as shown in Figure 17-18. Click the Expand All button to see the entire list. Review the changes to see if any of them conflict with work that you’ve done while your accountant worked on the copy. Each change comes with an explanation of how to deal with these conflicts.
To make the changes in your company file, click the Incorporate Accountant’s Changes button. (If you decide not to import the changes, click Close instead.)
QuickBooks backs up your company file and then imports the changes. After you review them, click Close.
From time to time, you might want to get rid of an accountant’s review copy without importing any of the changes. For instance, say you created an accountant’s review copy by mistake or your accountant had so few changes that she simply told you what tweaks to make. Unlocking your company file so you can get back to performing any type of task requires nothing more than choosing File→Send Company File→Accountant’s Copy→Remove Restrictions. The Remove Restrictions dialog box warns you that you won’t be able to import changes from the accountant’s review copy if you remove restrictions. To show that you know what you’re doing, turn on the “Yes, I want to remove the Accountant’s Copy restrictions” checkbox, and then click OK. The words “Accountant’s Change Pending” disappear from the QuickBooks window’s title bar.
QuickBooks’ external accountant user feature lets your accountant peruse your bookkeeping data and make changes while protecting your customers’ sensitive financial info. When your accountant logs in as this user, she can use the Client Data Review tool to look for problems and clean up any she finds. For example, she can look at the changes you’ve made to lists like the Chart of Accounts and Item List, scan your company file for payments or credits you haven’t applied, and find sales taxes or payroll liabilities you didn’t record correctly.
Note
An external accountant user lets an accountant use the Client Data Review tool from within clients’ editions of QuickBooks. When someone logs in as an external accountant user, the Client Data Review item appears in the Company menu in any QuickBooks edition, including Pro and Premier.
Here’s how to set up an external accountant user:
Log into your company file as the administrator (Setting Up the Administrator).
Only an administrator can create an external accountant user (who can perform tasks that even someone with administrator privileges can’t, like run the Client Data Review tool).
Choose Company→Set Up Users and Passwords→Set Up Users.
After you enter your password, the User List dialog box opens.
Click Add User.
The “Set up user password and access” dialog box opens.
In the User Name box, type the name for the external accountant user. In the Password and Confirm Password boxes, type the external accountant user’s password, and then click Next.
The “Access for user” screen appears.
Select the External Accountant option, and then click Next.
Because the external accountant user is so powerful, QuickBooks asks you to confirm that you want to give that level of access to the person. Click Yes.
Click Finish.
Note
You can also change an existing user to an exte nal accountant user. To do that, log into your company file as an administrator, and then choose Company→Set Up Users and Passwords→Set Up Users. In the User List window that appears, select the person you want to change, and then click Edit User. Change the user’s name and password if you want to, and then click Next. On the “Access for user” screen, select the External Accountant option, click Next, click Yes, and then click Finish.
In QuickBooks, paying independent contractors is no different from paying other vendors: You enter bills from your contractors, and then pay those bills. But at the end of the year, you have to generate 1099s for your independent workers.
If you set up QuickBooks to track 1099 payments (Spelling) and designate your contractors as 1099 vendors (Tax Settings), generating 1099s is a piece of cake. But before you push a stack of 1099 forms through your printer, it’s a good idea to make sure your records are up to date and accurate; this section explains how to do that.
Note
If you turn on the preference for QuickBooks payroll, then you can print W-2s for your employees by choosing Employees→Payroll Tax Forms & W-2s→Process Payroll Forms. For the full scoop on Intuit payroll services, download online Appendix D from this book’s Missing CD page at www.missingmanuals.com/cds.
To review the amounts you’ve paid to 1099 vendors, choose Reports→Vendors & Payables, and then select either of the following reports:
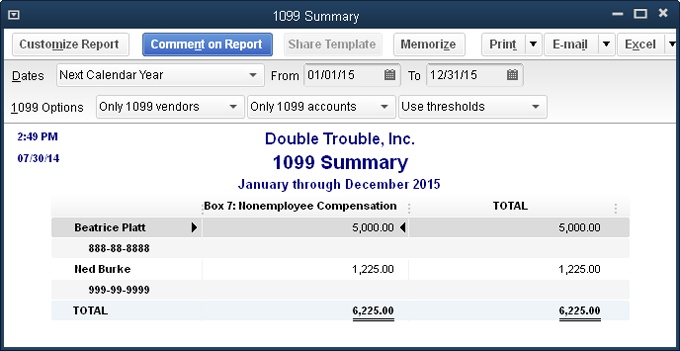
1099 Summary. This report includes each vendor you’ve set up as a 1099 vendor and the total amount you’ve paid each one. If any amount looks questionable, double-click it to display that vendor’s transactions. Although this report lists only the vendors you set up as eligible for 1099 status, as shown in Figure 17-19, you can modify it to make sure you haven’t left out any 1099 vendors. To do so, in the first 1099 Options drop-down list, choose “All vendors.”
Figure 17-19. Regardless of the fiscal year you use for your company, payroll and 1099 tasks run on a calendar year, because your employees and subcontractors pay taxes for each calendar year. That’s why the Dates drop-down list for the 1099 Summary report includes calendar-year date ranges.
If the 1099 Summary report is empty, your 1099 account mappings may be missing. In the report window’s toolbar, in the middle drop-down list, choose “All allowed accounts,” and then click Refresh to see payments you made to 1099 vendors regardless of the account. If your vendors leap into view, you need to map your accounts to 1099 boxes, as described in step 6 on Printing 1099-MISC Forms.
Note
The federal government gives you the tiniest of breaks by setting thresholds for total payments to 1099 vendors. If you pay vendors less than the threshold, you don’t have to generate 1099s for them. (For nonemployee compensation, the 2014 threshold is $600.)
In the 1099 Summary report’s window, QuickBooks sets the last box in the 1099 Options row to “Use thresholds.” This choice filters the vendors in the report to those that exceed the government’s threshold (see the preceding Note). If you want to see all your 1099 vendors, regardless of what you paid them, choose “Ignore thresholds” here instead.
1099 Detail. If you pay your independent contractors on a regular schedule, this report can pinpoint errors because it shows the transactions that produce vendors’ 1099 amounts. If you see a gap in the payment schedule or two transactions in the same month, double-click a transaction amount to open the corresponding window, such as Write Checks.
The steps to start printing 1099 forms are simple but, as with any printing task, fraught with niggling details:
Order printable 1099-MISC and 1096 forms or purchase them at your local business supply store.
1099-MISC and 1096 forms use special ink so that government agencies can scan them. Intuit sells kits with preprinted 1099 forms. In your web browser, go to http://intuitmarket.intuit.com. In that page’s horizontal navigation bar, point your cursor at Tax Forms, and then click 1099 Kits.
You can also order 1099 forms directly from the IRS by going to www.irs.gov and clicking the Forms & Pubs heading. On the “Forms and Publications” page, click Order Forms & Pubs, and then click Employer and Information Returns. In the value box for the 1099-MISC form (about halfway down the list), type the quantity of forms you need, and then scroll to the bottom of the page and click “Add to Cart.”
Load your printer with preprinted 1099-MISC forms.
If you use a printer that feeds individual sheets, don’t bother placing a Copy 2 form after each Copy 1 form so that you can print multiple copies for each vendor. It’s a lot easier to load the Copy 1 sheets and print a set of 1099 forms on those sheets, and then load the Copy 2 forms and print a second set of 1099 forms. You then send the Copy 1 sheets to the 1099 vendors and the Copy 2 sheets to the government in one big batch.
Choose Vendors→Print/E-file 1099s→1099 Wizard. In the QuickBooks 1099 Wizard window that opens, click Get Started.
The QuickBooks 1099 wizard helps verify your 1099 information before you print. After you click Get Started, the “Select your 1099 vendors” screen appears.
To transform a vendor into a 1099 vendor, turn on the checkbox in the vendor’s Create Form 1099-MISC Column. When you’ve selected all the 1099 vendors, click Continue.
Turn off a vendor’s checkbox if you don’t need to create a 1099 for him.
On the “Verify your 1099 vendors’ information” screen, make any necessary changes to the vendors’ tax ID, name, address, and phone number. When the information is correct, click Continue.
If required information is missing, the wizard outlines the table cell in red. Simply click the cell and type in the needed info.
On the “Map vendor payment accounts” screen, map the accounts in your chart of accounts to the appropriate box on the 1099 form by clicking the down arrow in the “Apply payments to this 1099 box” cell and then choosing the appropriate 1099 box. When you’re done, click Continue.
Most payments to 1099 vendors are mapped to Box 7: Nonemployee Compensation, which is why this screen includes a “Report all payments in Box 7” checkbox. To map all your 1099 vendors to Box 7, simply turn on this setting.
On the “Review payments for exclusions” screen, click View Included Payments to see payments you made to vendors by credit card, debit card, gift card, or PayPal. If any payments made with those payment types appear in the “Check Payments Included on Forms 1099-MISC” report, double-click the transaction to open the Write Checks window. In the No. field, fill in the payment type, such as Debit, Visa, Giftcard, or PayPal.
Ever since the 2011 tax year, the IRS has required you to exclude payments you made by credit card, debit card, gift card, or third-party payment networks such as PayPal from Form 1099-MISC because they’re reported by the card issuers and third-party payment networks on Form 1099-K. You can click View Excluded Payments to see which payments QuickBooks has excluded from Form 1099-MISC. If you make a payment in the Write Checks or Pay Bills windows, you can fill in the No. field with the payment type (up to eight characters) so that QuickBooks can automatically exclude that payment from Form 1099-MISC.
When the “Check Payments Included on Forms 1099-MISC” report shows only check payments, click Continue.
After you edit transactions, click Refresh in the report window to view an updated report.
On the “Confirm your 1099 entries” screen, review the vendors and their compensation to make sure it’s correct, and then click Continue.
On the “Choose a filing method” screen, click Print 1099s.
If you file more than 249 forms, you have to e-file your 1099s. In that case, you can click “Go to Intuit 1099 E-File Service” to use Intuit’s e-file service (which costs extra).
In the “Printing 1099-MISC and 1096 Forms” dialog box, click OK.
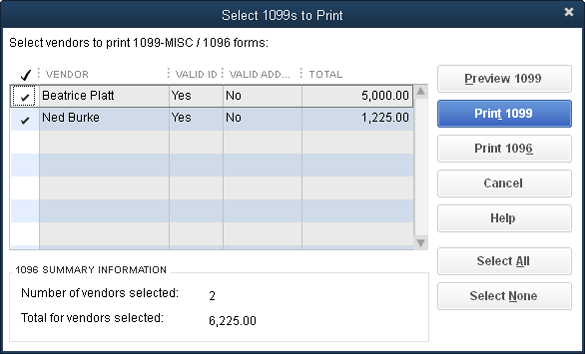
QuickBooks opens the “Select 1099s to Print” dialog box shown in Figure 17-20 and automatically selects every vendor whose pay exceeds the government threshold (Generating 1099 Reports).
When the Valid ID and Valid Address columns are replete with the word Yes, click Preview 1099 to see the final forms before you print them.
In the Print Preview window, click Zoom In (if necessary) to verify the information. When you’ve reviewed the forms, click Close.
Figure 17-20. In addition to columns for the vendors’ names and total pay, this table also includes the Valid ID and Valid Address columns. If you tend to create vendors on the fly without bothering to enter pesky details like their tax ID numbers or street addresses, scan these columns for the word “No.” If you see it in any cell, click Cancel, and then edit your vendors to add this essential information. Then repeat steps 10 and 11 and verify that all the Valid ID and Valid Address cells say Yes.
QuickBooks opens the Print 1099 window. If the preprinted forms are waiting in a printer other than the one that the program chose, in the “Printer name” box, select the printer that holds your preprinted forms.
Click Print.
A few months after the end of a fiscal year, when tax returns rest under the gimlet-eyed scrutiny of the tax authorities, most companies close their books for the previous fiscal year. Doing so locks the transactions that you’ve already reported on tax returns or in financial results, because the IRS and shareholders alike don’t look kindly on changes to the reports they’ve received.
QuickBooks, on the other hand, doesn’t care whether you close the books in your company file. The closing task is mainly to protect you from the consequences of changing the numbers in previous years (like altering the company file so that it no longer matches what you reported to the IRS). But you’re free to keep your books open if you’re not worried about editing older transactions by mistake.
If you do close your books in QuickBooks, you can still edit transactions prior to the closing date. Unlike other bookkeeping programs in which closed means closed, in QuickBooks, folks who know the closing-date password can still change and delete closed transactions to, say, correct an egregious error before you rerun your end-of-year reports.
Closing the books in QuickBooks takes place in the Preferences dialog box. Switch to single-user mode (Switching Between Multi- and Single-User Mode), and then choose Edit→Preferences→Accounting and click the Company Preferences tab. To close the books as of a specific date, click the Set Date/Password button. Figure 17-21 shows what to do next.

Figure 17-21. In the Closing Date box, type or select the last day of the previous fiscal year. If you want to let only authorized people make changes to the closed books, type a password in the Closing Date Password box. Then press Tab and, in the Confirm Password box, type the password a second time.
Tip
Don’t cut and paste the password from the Closing Date Password box to the Confirm Password box. These boxes display dots instead of the actual characters, which means you can’t see typos. So if you set a password with a typo in it, you’ll be unlikely to stumble on the correct password, and your closed books will remain shut as tight as a clam.
After you’ve set a password for the closing date, you’ll have to enter that password whenever you want to modify transactions prior to that date. For example, if you try to edit a check that you wrote before the closing date, QuickBooks opens a message box with a Password field in it. Type the closing-date password, and then click OK to complete your edit.
Tip
After you’ve completed all your year-end activities in QuickBooks, create a backup of your company file (Backing Up Files). With all the data that contributed to your financial reports and tax forms in this backup, it wouldn’t be overkill to create two copies of it: one to keep close by in your office and one stored safely offsite in case of disaster.