
It wouldn’t be proper to begin a discussion of creating a processor module without including the standard disclaimer that documentation concerning processor modules is scarce. Other than reading through SDK include files and the source of processor modules included with the SDK, you will find that the SDK’s readme.txt file is the only other file that sheds any light on how to create a processor module, with a few notes under the heading “Description of processor modules.”
It is worth clarifying that while the README file references specific filenames within a processor module as if those filenames are set in stone, in fact they are not. They do, however, tend to be the filenames that are used in the included SDK examples, and they are also the filenames referenced in the build scripts included with those examples. Feel free to create your processor modules using any filenames you like, as long as you update your build scripts accordingly.
The general intent of referring to specific processor files is to convey the idea that a processor module consists of three logical components: an analyzer, an instruction emulator, and an output generator. We will cover the purpose of each of these functional components as we work our way through the creation of our Python processor module.
Several example processors can be found in <SDKDIR>/module. One of the simpler processors to read through (if there is such a thing) is the z8 processor. Other processor modules vary in complexity based on their instruction sets and whether they take on any of the loading responsibilities. If you are thinking about writing your own processor module, one approach for getting started (recommended by Ilfak in the README file) is to copy an existing processor module and modify it to suit your needs. In such cases, you will want to find the processor module that most closely resembles the logical structure (not necessarily the processor architecture) that you envision for your module.
As with plug-ins and loaders, processor modules export exactly one thing. For processors, that one thing is a processor_t struct that must be named LPH. This struct is exported automatically if you include <SDKDIR>/module/idaidp.hpp, which in turn includes many other SDK header files commonly required by processor modules. One of the reasons why writing a processor module is so challenging is that the processor_t struct contains 56 fields that must be initialized, and 26 of those fields are function pointers, while 1 of the fields is a pointer to an array of one or more struct pointers that each point to a different type of struct (asm_t) that contains 59 fields requiring initialization. Easy enough, right? One of the principle inconveniences in building processor modules revolves around initializing all of the required static data, a proccess that can be error prone because of the large number of fields within each data structure. This is one of the reasons why Ilfak recommends using an existing processor as the basis for any new processors you develop.
Because of the complexity of these data structures, we will not attempt to enumerate every possible field and its uses. Instead, we will highlight the major fields and refer you to idp.hpp for further details on these and other fields within each structure. The order in which we cover various processor_t fields bears no resemblance to the order in which those fields are declared within processor_t.
Before diving into the behavioral aspects of your processor module, there are some static data requirements that you should take care of. As you build a disassembly module, you need to create a list of every assembly language mnemonic that you intend to recognize for your target processor. This list is created in the form of an array of instruc_t (defined in idp.hpp) structures and is commonly placed in a file named ins.cpp. As shown here, instruc_t is a simple structure whose purpose is twofold. First, it provides a table lookup for instruction mnemonics. Second, it describes some basic characteristics of each instruction.
struct instruc_t {
  const char *name;  //instruction mnemonic
  ulong feature;     //bitwise OR of CF_xxx flags defined in idp.hpp
};
The feature field is used to indicate behaviors such as whether the instruction reads or writes any of its operands and how execution continues once the instruction is executed (default, jump, call). The CF in CF_xxx stands for canonical feature. The feature field basically drives the concepts of control flow and cross-references. A few of the more interesting canonical feature flags are described here:
CF_STOP The instruction does not pass control to the following instruction. Examples might include absolute jumps or function-return instructions. |
CF_CHGn The instruction modifies operand n, where n is in the range 1..6. |
CF_USEn The instruction uses operand n, where n is in the range 1..6, and uses means “reads” or “refers to” (but does not modify; see CF_CHGn) a memory location. |
CF_CALL The instruction calls a function. |
Instructions need not be listed in any particular order. In particular, there is no need to order instructions according to their associated binary opcodes, nor is there any requirement to have a one-to-one correspondence between the instructions in this array and valid binary opcodes. The first and last few lines of our example instruction array are shown here:
instruc_t Instructions[] = {
     {"STOP_CODE", CF_STOP},   /* 0 */
     {"POP_TOP", 0},           /* 1 */
     {"ROT_TWO", 0},           /* 2 */
     {"ROT_THREE", 0},         /* 3 */
     {"DUP_TOP", 0},           /* 4 */
     {"ROT_FOUR", 0},          /* 5 */
    {NULL, 0},                /* 6 */
     ...
     {"CALL_FUNCTION_VAR_KW", CF_CALL}, /* 142 */
     {"SETUP_WITH", 0},                 /* 143 */
     {"EXTENDED_ARG", 0},               /* 145 */
     {"SET_ADD", 0},                    /* 146 */
     {"MAP_ADD", 0}                     /* 147 */
  };
{NULL, 0}, /* 6 */
...
{"CALL_FUNCTION_VAR_KW", CF_CALL}, /* 142 */
{"SETUP_WITH", 0}, /* 143 */
{"EXTENDED_ARG", 0}, /* 145 */
{"SET_ADD", 0}, /* 146 */
{"MAP_ADD", 0} /* 147 */
};In our example, because Python byte code is so simple, we will be maintaining a one-to-one correspondence between instructions and byte codes. Note that in order to do so, some instruction records must act as filler when an opcode is not defined, such as opcode 6 ![]() in this case.
in this case.
An associated set of enumerated constants is typically defined in ins.hpp to provide a mapping from integers to instructions, as shown here:
enum python_opcodes {
   STOP_CODE = 0,
   POP_TOP = 1,    //remove top item on stack
   ROT_TWO = 2,    //exchange top two items on stack
   ROT_THREE = 3,  //move top item below the 2nd and 3rd items
   DUP_TOP = 4,    //duplicate the top item on the stack
   ROT_FOUR = 5,   //move top item below the 2nd, 3rd, and 4th items
   NOP = 9,        //no operation
   ...
   CALL_FUNCTION_VAR_KW = 142,
   SETUP_WITH = 143,
   EXTENDED_ARG = 145,
   SET_ADD = 146,
   MAP_ADD = 147,
   PYTHON_LAST = 148
};
Here we have elected to explicitly assign a value to each enum, both for clarity’s sake and because there are gaps in our sequence because we have elected to use the actual Python opcodes as our instruction indexes. An additional constant has also been added (PYTHON_LAST) to provide easy reference to the end of the list. With a list of instructions and associated integer mapping in hand, we have sufficient information to initialize three fields of LPH (our global processor_t). These three fields are described here:
int instruc_start;   // integer code of the first instruction
  int instruc_end;     // integer code of the last instruction + 1
  instruc_t *instruc;  // array of instructions
We must initialize these fields with STOP_CODE, PYTHON_LAST, and Instructions, respectively. Together these fields enable a processor module to quickly look up the mnemonic for any instruction in the disassembly.
For most processor modules, we also need to define a set of register names and an associated set of enumerated constants for referring to them. If we were writing an x86 processor module, we might begin with something like the following, where for the sake of brevity we restrict ourselves to the basic x86 register set:
static char *RegNames[] = {
   "eax", "ebx", "ecx", "edx", "edi", "esi", "ebp", "esp",
   "ax", "bx", "cx", "dx", "di", "si", "bp", "sp",
   "al", "ah", "bl", "bh",  "cl", "ch", "dl", "dh",
   "cs", "ds", "es", "fs", "gs"
};
The RegNames array is often declared in a file named reg.cpp. This file is also where the sample processor modules declare LPH, which enables RegNames to be declared statically. The associated register enumeration would be declared in a header file, usually named after the processor (perhaps x86.hpp in this case), as follows:
enum x86_regs {
   r_eax, r_ebx, r_ecx, r_edx, r_edi, r_esi, r_ebp, r_esp,
   r_ax, r_bx, r_cx, r_dx, r_di, r_si, r_bp, r_sp,
   r_al, r_ah, r_bl, r_bh,  r_cl, r_ch, r_dl, r_dh,
   r_cs, r_ds, r_es, r_fs, r_gs
};
Make certain that you maintain the proper correspondence between the register name array and its associated set of constants. Together the register name array and the enumerated register constants allow a processor module to quickly look up register names when formatting instruction operands. These two data declarations are used to initialize additional fields in LPH:
int   regsNum;            // total number of registers
  char  **regNames;         // array of register names
These two fields are often initialized with qnumber(RegNames) and RegNames, respectively, where qnumber is a macro, defined in pro.h, that computes the number of elements in a statically allocated array.
An IDA processor module is always required to specify information about segment registers regardless of whether the actual processor uses segment registers or not. Since the x86 utilizes segment registers, the preceding example is fairly straightforward to configure. Segment registers are configured in the following fields within a processor_t:
// If your processor does not use segment registers, You should define // 2 virtual segment registers for CS and DS. // Let's call them rVcs and rVds. int regCodeSreg; // number of CS register int regDataSreg; // number of DS register
To initialize our hypothetical x86 processor module, the previous five fields would be initialized, in order, as follows:
r_cs, r_gs, 2, r_cs, r_ds
Note the comments, ![]() and
and ![]() , regarding segment registers. IDA always wants information about segment registers, even if your processor does not use them. Returning to our Python example, we don’t have nearly as much work to do in setting up register mappings, since the Python interpreter is a stack-based architecture and there are no registers, but we do need to deal with the segment register issue. The typical approach for doing so is to make up names and enumerated values to represent a minimal set of segment registers (code and data). Basically, we are faking the existence of segment registers for no other reason than because IDA expects them. However, even though IDA expects them, we are by no means obligated to use them, so we simply ignore them in our processor module. For our Python processor, we do the following:
, regarding segment registers. IDA always wants information about segment registers, even if your processor does not use them. Returning to our Python example, we don’t have nearly as much work to do in setting up register mappings, since the Python interpreter is a stack-based architecture and there are no registers, but we do need to deal with the segment register issue. The typical approach for doing so is to make up names and enumerated values to represent a minimal set of segment registers (code and data). Basically, we are faking the existence of segment registers for no other reason than because IDA expects them. However, even though IDA expects them, we are by no means obligated to use them, so we simply ignore them in our processor module. For our Python processor, we do the following:
//in reg.cpp
static char *RegNames = { "cs", "ds" };

//in python.hpp
enum py_registers { rVcs, rVds };
With these declarations in place, we can return to initialize the appropriate fields within LPH using the following sequence of values:
rVcs, rVds, 0, rVcs, rVds
Before moving on to the implementation of any behavior in the Python processor, we take some time to knock off some remaining low-hanging fruit where initialization of the LPH structure is concerned. The first five fields of a processor_t are described here:
int version; // should be IDP_INTERFACE_VERSION
int id;     // IDP id, a PLFM_xxx value or self assigned > 0x8000
ulong flag; // Processor features, bitwise OR of PR_xxx values
int cnbits; // Number of bits in a byte for code segments (usually 8)
int dnbits; // Number of bits in a byte for data segments (usually 8)
The version field should look familiar, as it is also required in plug-in and loader modules. For custom processor modules, the id field should be a self-assigned value greater than 0x8000. The flag field describes various characteristics of the processor module as a combination of PR_xxx flags defined in idp.hpp. For the Python processor, we choose to specify only PR_RNAMESOK, which allows register names to be used as location names (which is okay since we have no registers), and PRN_DEC, which sets the default number display format to decimal. The remaining two fields, cnbits and dnbits, are each set to 8.
At this point we have filled in enough of the LPH structure that we can begin thinking about the first portion of a processor module that will execute—the analyzer. In the example processor modules, the analyzer is typically implemented by a function named ana (you may name it anything you like) in a file named ana.cpp. The prototype for this function is very simple, as shown here:
int idaapi ana(void); //analyze one instruction and return the instruction length
You must initialize the u_ana member of the LPH object with a pointer to your analyzer function. The analyzer’s job is to analyze a single instruction, populate the global variable cmd with information about the instruction, and return the length of the instruction. The analyzer should not make any changes to the database.
The cmd variable is a global instance of an insn_t object. The insn_t class, defined in ua.hpp, is used to describe a single instruction in the database. Its declaration is shown here:
class insn_t {
  public:
    ea_t cs; // Current segment base paragraph. Set by kernel
    ea_t ip; // Virtual address of instruction (within segment). Set by kernel
    ea_t ea; // Linear address of the instruction. Set by kernel
   uint16
 itype; // instruction enum value (not opcode!). Proc sets this in ana
   uint16 size;  // Size of instruction in bytes. Proc sets this in ana
    union {       // processor dependent field. Proc may set this
      uint16 auxpref;
      struct {
        uchar low;
          uchar high;
      } auxpref_chars;
    };
    char segpref;     // processor dependent field.  Proc may set this
    char insnpref;    // processor dependent field.  Proc may set this
   op_t Operands[6]; // instruction operand info.  Proc sets this in ana
    char flags;       // instruction flags.  Proc may set this
  };
op_t Operands[6]; // instruction operand info. Proc sets this in ana
char flags; // instruction flags. Proc may set this
};Prior to calling your analyzer function, the IDA kernel (the core of IDA) fills in the first three fields of the cmd object with the segmented and linear address of the instruction. After that, it is the analyzer’s job to fill in the rest. The essential fields for the analyzer to fill in are itype ![]() ,
, size ![]() , and
, and Operands ![]() . The
. The itype field must be set to one of the enumerated instruction type values discussed previously. The size field must be set to the total size of the instruction (in bytes) and should be used as the return value of the instruction. If the instruction cannot be parsed, the analyzer should return a size of zero. Finally, an instruction may have up to six operands, and the analyzer should fill in information about each operand used by the instruction.
The analyzer function is often implemented using a switch statement. The first step in the analyzer is typically to request one or more (depending on the processor) bytes from the instruction stream and use those bytes as the switch test variable. The SDK offers special functions for use in the analyzer for the purpose of retrieving bytes from the instruction stream. These functions are shown here:
//read one byte from current instruction location
uchar ua_next_byte(void);
//read two bytes from current instruction location
ushort ua_next_word(void);
//read four bytes from current instruction location
ulong ua_next_long(void);
//read eight bytes from current instruction location
ulonglong ua_next_qword(void);
The current instruction location is initially the same value contained in cmd.ip. Each call to one of the ua_next_xxx functions has the side effect of incrementing cmd.size according to the number of bytes requested by the ua_next_xxx function being called (1, 2, 4, or 8). The retrieved bytes must be decoded enough to assign the appropriate instruction type enumerated value into the itype field, determine the number and type of any operands required by the instruction, and then determine the overall length of the instruction. As the decoding process progresses, additional instruction bytes may be required until a complete instruction has been retrieved from the instruction stream. As long as you utilize the ua_next_xxx function, cmd.size will be updated automatically for you, eliminating the need to keep track of the number of bytes you have requested for a given instruction. From a high-level perspective, the analyzer somewhat mimics the instruction fetch and instruction decode phases employed in real CPUs. Mirroring real life, instruction decoding tends to be easier for processors with fixed instruction sizes, as is often the case with RISC-style architectures, while instruction decoding tends to be more complicated for processors that use variable-length instructions, such as the x86.
Using the retrieved bytes, the analyzer must initialize one element in the cmd.Operands array for each operand used by the instruction. Instruction operands are represented using instances of the op_t class, which is defined in ua.hpp and summarized here:
class op_t {
public:
  char n;  // number of operand (0,1,2).  Kernel sets this do not change!
  optype_t type; // type of operand.  Set in ana, See ua.hpp for values

  // offset of operand relative to instruction start
  char offb;  //Proc sets this in ana, set to 0 if unknown
  // offset to second part of operand (if present) relative to instruction start

  char offo;  //Proc sets this in ana, set to 0 if unknown
  uchar flags; //Proc sets this in ana.  See ua.hpp for possible values

  char dtyp; // Specifies operand datatype. Set in ana. See ua.hpp for values

  // The following unions keep other information about the operand
  union {
    uint16 reg;    // number of register for type o_reg
    uint16 phrase; // number of register phrase for types o_phrase and o_displ
                   // define numbers of phrases as you like
  };

  union {          // value of operand for type o_imm or
    uval_t value;  // outer displacement (o_displ+OF_OUTER_DISP)
    struct {       // Convenience access to halves of value
        uint16 low;
        uint16 high;
    } value_shorts;
  };

  union {   // virtual address pointed or used by the operand
    ea_t addr;  // for types (o_mem,o_displ,o_far,o_near)
    struct {    // Convenience access to halves of addr
        uint16 low;
        uint16 high;
    } addr_shorts;
  };

  //Processor dependent fields, use them as you like.  Set in ana
  union {
    ea_t specval;
    struct {
        uint16 low;
        uint16 high;
    } specval_shorts;
  };
  char specflag1, specflag2, specflag3, specflag4;
};
Configuring an operand begins with setting the operand’s type field to one of the enumerated optype_t constants defined in ua.hpp. An operand’s type describes the source or destination of the operand data. In other words, the type field roughly describes the addressing mode employed to access the operand. Examples of operand types include o_reg, which means that the operand is the content of a register; o_mem, which means the operand is a memory address known at compile time; and o_imm, which means that the operand is immediate data contained within the instruction.
The dtype field specifies the size of the operand data. This field should be set to one of the dt_xxx values specified in ua.hpp. Example values include dt_byte for 8-bit data, dt_word for 16-bit data, and dt_dword for 32-bit data.
The following x86 instructions demonstrate the correspondence of some of the primary operand datatypes to commonly used operands:
mov  eax, 0x31337          ; o_reg(dt_dword), o_imm(dt_dword)
push word ptr [ebp - 12]   ; o_displ(dt_word)
mov [0x08049130], bl       ; o_mem(dt_byte), o_reg(dt_byte)
movzx eax, ax              ; o_reg(dt_dword), o_reg(dt_word)
ret                        ; o_void(dt_void)
The manner in which the various unions within an op_t are used is dictated by the value of the type field. For example, when an operand is type o_imm, the immediate data value should be stored into the value field, and when the operand type is o_reg, the register number (from the enumerated set of register constants) should be stored into the reg field. Complete details on where to store each piece of an instruction are contained in ua.hpp.
Note that none of the fields within an op_t describe whether the operand is being used as a source or a destination for data. In fact, it is not the analyzer’s job to determine such things. The canonical flags specified in the instruction names array are used in a later stage in the processor to determine exactly how an operand is being used.
Several of the fields within both the insn_t class and the op_t class are described as processor dependent, which means that you may use those fields for any purpose you wish. Such fields are often used for storing information that does not fit neatly into one of the other fields within these classes. The processor-dependent fields are also a convenient mechanism for passing information along to later stages of the processor so that those stages do not need to replicate the work of the analyzer.
With all of the ground rules for an analyzer covered, we can take a stab at crafting a minimal analyzer for Python byte code. Python byte code is very straightforward. Python opcodes are 1 byte long. Opcodes less than 90 have no operands, while opcodes greater than or equal to 90 each have a 2-byte operand. Our basic analyzer is shown here:
#define HAVE_ARGUMENT 90
int idaapi py_ana(void) {
   cmd.itype = ua_next_byte();    //opcodes ARE itypes for us (updates cmd.size)
   if (cmd.itype >= PYTHON_LAST) return 0;             //invalid instruction
   if (Instructions[cmd.itype].name == NULL) return 0; //invalid instruction
   if (cmd.itype < HAVE_ARGUMENT) { //no operands
      cmd.Op1.type = o_void;      //Op1 is a macro for Operand[0] (see ua.hpp)
      cmd.Op1.dtyp = dt_void;
   }
   else {   //instruction must have two bytes worth of operand data
      if (flags[cmd.itype] & (HAS_JREL | HAS_JABS)) {
         cmd.Op1.type = o_near;  //operand refers to a code location
      }
      else {
         cmd.Op1.type = o_mem;   //operand refers to memory (sort of)
      }
      cmd.Op1.offb = 1;          //operand offset is 1 byte into instruction
      cmd.Op1.dtyp = dt_dword;   //No sizes in python so we just pick something

      cmd.Op1.value = ua_next_word(); //fetch the operand word (updates cmd.size)
      cmd.auxpref = flags[cmd.itype]; //save flags for later stages

      if (flags[cmd.itype] & HAS_JREL) {
         //compute relative jump target
         cmd.Op1.addr = cmd.ea + cmd.size + cmd.Op1.value;
      }
      else if (flags[cmd.itype] & HAS_JABS) {
         cmd.Op1.addr = cmd.Op1.value;  //save absolute address
      }
      else if (flags[cmd.itype] & HAS_CALL) {
         //target of call is on the stack in Python, the operand indicates
         //how many arguments are on the stack, save these for later stages
         cmd.Op1.specflag1 = cmd.Op1.value & 0xFF;         //positional parms
         cmd.Op1.specflag2 = (cmd.Op1.value >> 8) & 0xFF;  //keyword parms
      }
   }
   return cmd.size;
}
For the Python processor module, we have elected to create an additional array of flags, one per instruction, used to supplement (and in some cases replicate) the canonical features of each instruction. The HAS_JREL, HAS_JABS, and HAS_CALL flags were defined for use in our flags array. We use these flags to indicate whether an instruction operand represents a relative jump offset, an absolute jump target, or the description of a function call stack, respectively. Explaining every detail of the analysis phase is difficult without descending into the operation of the Python interpreter, so we summarize the analyzer here and through comments in the preceding code, remembering that the analyzer’s job is to dissect a single instruction:
The analyzer gets the next instruction byte from the instruction stream and determines whether the byte is a valid Python opcode.
If the instruction has no operands,
cmd.Operand[0](cmd.Op1) is initialized too_void.If the command has an operand,
cmd.Operand[0]is initialized to reflect the type of the operand. Several processor-specific fields are used to carry information forward to later stages in the processor module.The length of the instruction is returned to the caller.
More sophisticated instruction sets are almost certain to require more complex analyzer stages. Overall, however, any analyzer’s behavior may be generalized as follows:
Read enough bytes from the instruction stream to determine whether the instruction is valid and to map the instruction to one of the enumerated instruction type constants, which is then saved in
cmd.itype. This operation is often performed using a large switch statement to categorize instruction opcodes.Read any additional bytes required to properly determine the number of operands required by the instruction, the addressing modes in use by those operands, and the individual components of each operand (registers and immediate data). This data is used to populate elements of the
cmd.Operandsarray. This operation may be factored into a separate operand-decoding function.Return the total length of the instruction and its operands.
Strictly speaking, once an instruction has been dissected, IDA has enough information to generate an assembly language representation of that instruction. In order to generate cross-references, facilitate the recursive descent process, and monitor the behavior of the program stack pointer, IDA must obtain additional details about the behavior of each instruction. This is the job of the emulator stage of an IDA processor module.
Whereas the analyzer stage is concerned with the structure of a single instruction, the emulator stage is concerned with the behavior of a single instruction. In IDA example processor modules, the emulator is typically implemented by a function named emu (you may name it anything you like) in a file named emu.cpp. Like the ana function, the prototype for this function is very simple, as shown here:
int idaapi emu(void); //emulate one instruction
According to idp.hpp, the emu function is supposed to return the length of the instruction that was emulated; however, the majority of sample emulators seem to return the value 1.
You must initialize the u_emu member of the LPH object with a pointer to your emulator function. By the time emu is called, cmd has been initialized by the analyzer. The emulator’s primary purpose is to create code and data cross-references based on the behavior of the instruction described by cmd. The emulator is also the place to keep track of any changes to the stack pointer and create local variables based on observed access to a function’s stack frame. Unlike the analyzer, the emulator may change the database.
Determining whether an instruction results in the creation of any cross-references is typically done by examining the instruction’s canonical features in conjunction with the type field of the instruction’s operands. A very basic emulator function for an instruction set whose instructions may take up to two operands, which is representative of many of the SDK examples, is shown here:
void TouchArg(op_t &op, int isRead);  //Processor author writes this

int idaapi emu() {
   ulong feature = cmd.get_canon_feature(); //get the instruction's CF_xxx flags

   if (feature & CF_USE1) TouchArg(cmd.Op1, 1);
   if (feature & CF_USE2) TouchArg(cmd.Op2, 1);

   if (feature & CF_CHG1) TouchArg(cmd.Op1, 0);
   if (feature & CF_CHG2) TouchArg(cmd.Op2, 0);

   if ((feature & CF_STOP) == 0) { //instruction doesn't stop
      //add code cross ref to next sequential instruction
      ua_add_cref(0, cmd.ea + cmd.size, fl_F);
   }
   return 1;
}
For each instruction operand, the preceding function examines the instruction’s canonical features to determine whether a cross-reference of any kind should be generated. In this example, a function named TouchArg examines a single operand to determine what type of cross-reference should be generated and handles the details of generating the correct cross-reference. When generating cross-references from your emulator, you should use the cross-reference-creation functions declared in ua.hpp rather than in xref.hpp. The following rough guidelines may be used in determining what type of cross-references to generate.
If the operand type is
o_imm, the operation is a read (isReadis true), and the operand value is a pointer, create an offset reference. Determine whether an operand is a pointer by calling theisOfffunction, for example,isOff(uFlag, op.n). Add an offset cross-reference usingua_add_off_drefs, for example,ua_add_off_drefs(op, dr_O);.If the operand type is
o_displand the operand value is a pointer, create an offset cross-reference with a read or write cross-reference type as appropriate, for example,ua_add_off_drefs(op, isRead ? dr_R : dr_W);.If the operand type is
o_mem, add a data cross-reference with a read or write cross-reference type as appropriate usingua_add_dref, for example,ua_add_dref(op.offb, op.addr, isRead ? dr_R : dr_W);.If the operand type is
o_near, add a code cross-reference with a jump or call cross-reference type as appropriate usingua_add_cref, for example,ua_add_cref(op.offb, op.addr, feature & CF_CALL ? fl_CN : fl_JN);.
The emulator is also responsible for reporting on the behavior of the stack pointer register. The emulator should use the add_auto_stkpnt2 function to inform IDA that an instruction changed the value of the stack pointer. The prototype for add_auto_stkpnt2 is shown here:
bool add_auto_stkpnt2(func_t *pfn, ea_t ea, sval_t delta);
The pfn pointer should point to the function that contains the address being emulated. If pfn is NULL, it will be automatically determined by IDA. The ea parameter should specify the end address (typically cmd.ea + cmd.size) for the instruction that changes the stack pointer. The delta parameter is used to specify the number of bytes by which the stack pointer grows or shrinks. Use negative deltas when the stack is growing (such as after a push instruction) and positive deltas when the stack is shrinking (such as after a pop instruction). A simple 4-byte adjustment to the stack pointer in conjunction with a push operation might be emulated as follows:
if (cmd.itype == X86_push) {
   add_auto_stkpnt2(NULL, cmd.ea + cmd.size, −4);
}
In order to maintain an accurate record of stack pointer behavior, the emulator should be able to recognize and emulate all instructions that change the stack pointer, not just the simple push and pop cases. A more complex example of tracking the stack pointer occurs when a function allocates its local variables by subtracting a constant value from the stack pointer. This case is illustrated here:
//handle cases such as:  sub  esp, 48h
if (cmd.itype == X86_sub && cmd.Op1.type == o_reg
    && cmd.Op1.reg == r_esp && cmd.Op2.type == o_imm) {
   add_auto_stkpnt2(NULL, cmd.ea + cmd.size, -cmd.Op2.value);
}
Because CPU architectures vary significantly from one CPU to another, it is not possible for IDA (or any other program for that matter) to account for every possible way that an operand may be formed or every way that an instruction may reference other instructions or data. As a result, there is no precise cookbook recipe for building your emulator module. Reading through existing processor module source code along with a lot of trial and error may be required before your emulator does everything you want it to do.
The emulator for our example Python processor is shown here:
int idaapi py_emu(void) {
   //We can only resolve target addresses for relative jumps
   if (cmd.auxpref & HAS_JREL) { //test the flags set by the analyzer
      ua_add_cref(cmd.Op1.offb, cmd.Op1.addr, fl_JN);
   }
   //Add the sequential flow as long as CF_STOP is not set
   if((cmd.get_canon_feature() & CF_STOP) == 0) {
      //cmd.ea + cmd.size computes the address of the next instruction
      ua_add_cref(0, cmd.ea + cmd.size, fl_F);
   }
   return 1;
}
Again, owing to the architecture of the Python interpreter, we are severely limited in the types of cross-references that we can generate. In Python byte code, there is no concept of a memory address for data items, and the absolute address of each instruction can be determined only by parsing metainformation contained in the compiled Python (.pyc) file. Data items are either stored in tables and referenced by index values or they are stored on the program stack, where they cannot be directly referenced. Here again, while we can directly read data item index values from instruction operands, we cannot know the structure of the tables that hold the data unless we have parsed additional metainformation contained in the .pyc file. In our processor, we can compute only the target of relative jump instructions and the address of the next instruction because they are located relative to the current instruction address. The fact that our processor can provide a better disassembly only if it has a more detailed understanding of the file structure is a limitation that we discuss in Processor Module Architecture in Processor Module Architecture.
For similar reasons, we have elected not to track the stack pointer’s behavior in our Python processor. This is primarily because IDA treats stack pointer changes as relevant only when those changes are made within the confines of a function and we have no means at present for recognizing function boundaries within Python code. If we were to implement stack-pointer tracking, it would be wise to remember that, as a stack-based architecture, virtually every Python instruction modifies the stack in some way. In this case, to simplify the process of determining how much the stack pointer is changed by each instruction, it might be easier to define an array of values, one per Python instruction, that contains the amount by which each instruction modifies the stack. These amounts would then be used in calls to add_auto_stkpnt2 each time an instruction is emulated.
Once the emulator has added all of the cross-references that it can and made any other modifications to the database that it deems necessary, you are ready to start generating output. In the following section, we discuss the role of the outputter in generating IDA’s disassembly display.
The purpose of the outputter is to output a single disassembled instruction, as specified by the cmd global variable, to the IDA display. In IDA processor modules, the outputter is typically implemented by a function named out (you may name it anything you like) in a file named out.cpp. Like the ana and emu functions, the prototype for this function is very simple, as shown here:
void idaapi out(void); //output a single disassembled instruction
You must initialize the u_out member of the LPH object with a pointer to your output function. By the time out is called, cmd has been initialized by the analyzer. Your output function should not make any changes to the database. You are also required to create a helper function whose sole purpose is to format and output a single instruction operand. This function is typically named outop and is pointed to by the u_outop member of LPH. Your out function should not call outop directly. Instead, you should call out_one_operand each time you need to print an operand portion of your disassembly lines. Data output operations are handled by a separate function typically named cpu_data and specified by the d_out member field of the LPH object. In our Python processor, this function is named python_data.
Output lines in a disassembly listing are composed of several components, such as a prefix, a name label, a mnemonic, operands, and possibly a comment. The IDA kernel retains responsibility for rendering some of these components (such as prefixes, comments, and cross-references), while others are the responsibility of the processor’s outputter. Several useful functions for generating pieces of an output line are declared in ua.hpp under the following heading:
//--------------------------------------------------------------------------
//      I D P   H E L P E R   F U N C T I O N S  -  O U T P U T
//--------------------------------------------------------------------------
Colorizing portions of each output line is possible through the use of functions that insert special color tags into your output buffers. Additional functions for generating output lines may be found in lines.hpp.
Rather than use a console-style output model in which you write content directly to the IDA display, IDA utilizes a buffer-based output scheme in which you must write a single line of display text into a character buffer and then ask IDA to display your buffer. The basic process for generating an output line follows:
Call
init_output_buffer(char *buf, size_t bufsize)(declared in ua.hpp) to initialize your output buffer.Utilize the buffer output functions in ua.hpp to generate a single line of content by adding to the initialized buffer. Most of these functions automatically write to the destination buffer specified in the previous step, so there is often no need to explicitly pass a buffer into these functions. These functions are typically named
out_xxxorOutXxx.Call
term_output_buffer()to finalize your output buffer, making it ready to send to the IDA kernel for display.Send the output buffer to the kernel using either
MakeLineorprintf_line(both declared in lines.hpp).
Note that init_output_buffer, term_output_buffer, and MakeLine are usually called only within your out function. Your outop function typically makes use of the current output buffer as initialized by out and usually has no need to initialize its own output buffers.
Strictly speaking, you can skip all of the buffer manipulation described in the first four steps of the preceding list and go straight to calling MakeLine as long as you don’t mind taking complete control of the buffer-generation process and passing up the convenience functions offered in ua.hpp. In addition to assuming a default destination for generated output (as specified via init_out_buffer), many of the convenience functions automatically work with the current contents of the cmd variable. Some of the more useful convenience functions from ua.hpp are described here:
OutMnem(int width, char *suffix)Outputs the mnemonic that corresponds to
cmd.itypein a field of at leastwidthcharacters, appending the specified suffix. At least one space is printed after the mnemonic. The default width is 8, and the default suffix is NULL. An example of the use of the suffix value might be for operand size modifiers, as in the following x86 mnemonics:movsb,movsw,movsd.out_one_operand(int n)Invokes your processor’s
outopfunction to printcmd.Operands[n].out_snprintf(const char *format, ...)Appends formatted text to the current output buffer.
OutValue(op_t &op, int outflags)Outputs constant fields of an operand. This function outputs
op.valueorop.addr, depending on the value ofoutflags. See ua.hpp for the meaning ofoutflags, which defaults to 0. This function is meant to be called from withinoutop.out_symbol(char c)Outputs the given character using the current color for punctuation (
COLOR_SYMBOLas defined in lines.hpp). This function is primarily used for outputting the syntactic elements within operands (thus called fromoutop), such as commas and brackets.out_line(char *str, color_t color)Appends the given string, in the given
color, to the current output buffer. Colors are defined in lines.hpp. Note that this function does not output a line at all. A better name for this function might beout_str.OutLine(char *str)Same as
out_linebut without the use of color.out_register(char *str)Outputs the given string using the current color for registers (
COLOR_REG).out_tagon(color_t tag)Inserts a turn color on tag into the output buffer. Subsequent output to the buffer will be displayed in the given color until a turn color off tag is encountered.
out_tagoff(color_t tag)Inserts a turn color off tag into the output buffer.
Please refer to ua.hpp for additional output functions that may be of use in building your outputter.
One output capability that is missing from ua.hpp is the ability to easily output a register name. During the analysis phase, register numbers are stored into an operand’s reg or phrase field, depending on the addressing mode used for that operand. Since many operands make use of registers, it would be nice to have a function that quickly outputs a register string given a register number. The following function provides a minimal capability to do so:
//with the following we can do things like: OutReg(op.reg);
void OutReg(int regnum) {
   out_register(ph.regNames[regnum]);  //use regnum to index register names array
}
IDA calls your out function only as needed, when an address comes into view in one of the IDA displays or when portions of a line are reformatted. Each time out is called, it is expected to output as many lines as are necessary to represent the instruction described in the cmd global variable. In order to do this, out will generally make one or more calls to MakeLine (or printf_line). In most cases one line (and hence one call to MakeLine) will be sufficient. When more than one line is required to describe an instruction, you should never add carriage returns to your output buffers in an attempt to generate several lines at once. Instead, you should make multiple calls to MakeLine to output each individual line. The prototype for MakeLine is shown here:
bool MakeLine(const char *contents, int indent = −1);
An indent value of −1 requests default indentation, which is the current value of inf.indent as specified in the Disassembly section of the Options ▸ General dialog. The indent parameter has additional meaning when an instruction (or data) spans several lines in the disassembly. In a multiline instruction, an indent of −1 designates a line as the most important line for that instruction. Please refer to the comments for the printf_line function in lines.hpp for more information on using indent in this manner.
Up to this point, we have avoided discussion of comments. Like names and cross-references, comments are handled by the IDA kernel. However, you are afforded some control over which line of a multiline instruction the comment is displayed on. The display of comments is controlled to some extent by a global variable named gl_comm, which is declared in lines.hpp. The most important thing to understand about gl_comm is that comments cannot be displayed at all unless gl_comm is set to 1. If gl_comm is 0, then a comment will not be displayed at the end of the output you have generated, even if the user has entered one and comments are enabled in the Options ▸ General settings. The trouble is, gl_comm defaults to 0, so you need to make sure that you set it to 1 at some point if you ever expect users to see comments while using your processor module. When your out function generates multiple lines, you need to control gl_comm if you want any user-entered comments to be displayed on anything other than your first line of output.
With the highlights of building an outputter under our belts, here is the out function for our example Python processor:
void py_out(void) {
   char str[MAXSTR];  //MAXSTR is an IDA define from pro.h
   init_output_buffer(str, sizeof(str));
   OutMnem(12);       //first we output the mnemonic
   if(cmd.Op1.type != o_void) {  //then there is an argument to print
      out_one_operand(0);
   }
   term_output_buffer();
   gl_comm = 1;      //we want comments!
   MakeLine(str);    //output the line with default indentation
}
The function works its way through the components of a disassembled line in a very simple fashion. If Python instructions could take two operands, we might use out_symbol to output a comma and then call out_one_operand a second time to output the second operand. In most cases, your outop function will be somewhat more complex than your out function, as the structure of an operand is generally more complex than the high-level structure of an instruction. A typical approach for implementing the outop function is to use a switch statement to test the value of the operand’s type field and format the operand accordingly.
In our Python example, we are forced to use a very simple outop function, because in most cases we lack the information required to translate the integer operands into anything more intelligible. Our implementation is shown here, with special handling for comparisons and relative jumps only:
char *compare_ops[] = {
    "<", "<=", "==", "!=", ">", ">=",
    "in", "not in", "is", "is not", "exception match"
};

bool idaapi py_outop(op_t& x) {
   if (cmd.itype == COMPARE_OP) {
      //For comparisons, the argument indicates the type of comparison to be
      //performed.  Print a symbolic representation of the comparison rather
      //than a number.
      if (x.value < qnumber(compare_ops)) {
         OutLine(compare_ops[x.value]);
      }
      else {
         OutLine("BAD OPERAND");
      }
   }
   else if (cmd.auxpref & HAS_JREL) {
      //we don't test for x.type == o_near here because we need to distinguish
      //between relative jumps and absolute jumps.  In our case, HAS_JREL
      //implies o_near
      out_name_expr(x, x.addr, x.addr);
   }
   else {  //otherwise just print the operand value
      OutValue(x);
   }
   return true;
}
In addition to disassembled instructions, a disassembly listing usually contains bytes that should be represented as data. In the output stage, data display is handled by the d_out member of the LPH object. The kernel calls the d_out function to display any bytes that are not part of an instruction, whether the datatype of those bytes is unknown or whether the bytes have been formatted as data by the user or the emulator. The prototype for d_out is shown here:
void idaapi d_out(ea_t ea); //format data at the specified address
The d_out function should examine the flags associated with the address specified by the ea parameter and generate an appropriate representation of the data in the style of the assembly language being generated. This function must be specified for all processor modules. A bare-bones implementation is offered by the SDK in the form of the intel_data function, but it is unlikely to meet your specific needs. In our Python example, we actually have very little need to format static data because we don’t have the means to locate it. For the sake of example, we make use of the function shown here:
void idaapi python_data(ea_t ea) {
   char obuf[256];
   init_output_buffer(obuf, sizeof(obuf));
   flags_t flags = get_flags_novalue(ea);  //get the flags for address ea
   if (isWord(flags)) {  //output a word declaration
      out_snprintf("%s %xh", ash.a_word ? ash.a_word : "", get_word(ea));
   }
   else if (isDwrd(flags)) {  //output a dword declaration
      out_snprintf("%s %xh", ash.a_dword ? ash.a_dword : "", get_long(ea));
   }
   else { //we default to byte declarations in all other cases
      int val = get_byte(ea);
      char ch = ' ';
      if (val >= 0x20 && val <= 0x7E) {
         ch = val;
      }
      out_snprintf("%s %02xh   ; %c", ash.a_byte ? ash.a_byte : "", val, ch);
   }
   term_output_buffer();
   gl_comm = 1;
   MakeLine(obuf);
}
Functions for accessing and testing the flags associated with any address in the database are available in bytes.hpp. In this example, the flags are tested to determine whether the address represents word or dword data, and appropriate output is generated using the appropriate data declaration keyword from the current assembler module. The global variable ash is an instance of an asm_t struct that describes characteristics of the assembler syntax that is being utilized in the disassembly. We would need significantly more logic in order to generate more complex data displays, such as arrays.
In Chapter 17, we discussed the ability of plug-ins to hook various notification messages using the hook_to_notification_point function. By hooking notifications, plug-ins could be informed of various actions taking place within the database. The concept of notification messages exists for processor modules as well, but processor notifications are implemented in a slightly different manner than plug-in notifications.
All processor modules should set a pointer to a notification function in the LPH object’s notify field. The prototype for notify is shown here:
int idaapi notify(idp_notify msgid, ...); //notify processor with a given msg
The notify function is a variable-arguments function that receives a notification code and a variable list of arguments specific to that notification code. The complete list of available processor notification codes may be found in idp.hpp. Notification messages exist for simple actions such as loading (init) and unloading (term) the processor to more complex notifications that code or data is being created, functions are being added or deleted, or segments are being added or deleted. The list of parameters supplied with each notification code is also specified in idp.hpp. Before looking at an example of a notify function, it is worth noting the following comments found only in some of the SDK’s sample processor modules:
// A well-behaving processor module should call invoke_callbacks()
// in its notify() function. If invoke_callbacks function returns 0,
// then the processor module should process the notification itself.
// Otherwise the code should be returned to the caller.
In order to ensure that all modules that have hooked processor notifications are properly notified, the invoke_callbacks function should be called. This causes the kernel to propagate the given notification message to all registered callbacks. The notify function used in our Python processor is shown here:
static int idaapi notify(processor_t::idp_notify msgid, ...) {
   va_list va;
   va_start(va, msgid);   //setup args list
   int result = invoke_callbacks(HT_IDP, msgid, va);
   if (result == 0) {
      result = 1;             //default success
      switch(msgid) {
         case processor_t::init:
            inf.mf = 0;       //ensure little endian!
            break;
         case processor_t::make_data: {
            ea_t ea = va_arg(va, ea_t);
            flags_t flags = va_arg(va, flags_t);
            tid_t tid = va_arg(va, tid_t);
            asize_t len = va_arg(va, asize_t);
            if (len > 4) { //our d_out can only handle byte, word, dword
               result = 0; //disallow big data
            }
            break;
         }
      }
   }
   va_end(va);
   return result;
}
This notify function handles only two notification codes: init and make_data. The init notification is handled in order to explicitly force the kernel to treat data as little-endian. The inf.mf (most first) flag indicates the endianness value in use by the kernel (0 for little and 1 for big). The make_data notification is sent whenever an attempt is made to convert bytes to data. In our case, the d_out function is capable of dealing with only byte, word, and dword data, so the function tests the size of the data being created and disallows anything larger than 4 bytes.
In order to wind up the discussion on creating processor modules, we need to at least touch on several additional fields in the LPH object. As mentioned previously, there are a tremendous number of function pointers within this structure. If you read through the definition of the processor_t struct in idp.hpp, it is clear in some cases that you can safely set some function pointers to NULL, and the kernel will not call them. It seems reasonable to assume that you are required to provide implementations for all of the other functions required by processor_t. As a general rule of thumb, you can often get away with an empty stub function when you are at a loss as to what you should do. In our Python processor, where it was not clear that NULL was a valid value, we initialized function pointers as follows (refer to idp.hpp for the behavior of each function):
header Points to empty function in example. |
footer Points to empty function in example. |
segstart Points to empty function in example. |
segend Points to empty function in example. |
is_far_jump Is set to NULL in example. |
translate Is set to NULL in example. |
realcvt Points to ieee_realcvt from ieee.h. |
is_switch Is set to NULL in example. |
extract_address Points to a function that returns (BADADDR−1) in example. |
is_sp_based Is set to NULL in example. |
create_func_frame Is set to NULL in example. |
get_frame_retsize Is set to NULL in example. |
u_outspec Is set to NULL in example. |
set_idp_options Is set to NULL in example. |
In addition to these function pointers, the following three data members are worth mentioning:
shnames A NULL-terminated array of character pointers that point to short names (fewer than nine characters) associated with the processor (such as python). Terminate this array with a NULL pointer. |
lnames A NULL-terminated array of character pointers that point to long names associated with the processor (such as Python 2.4 byte code). This array should contain the same number of elements as the shnames array. |
asms NULL-terminated array of pointers to target assembler (asm_t) structs. |
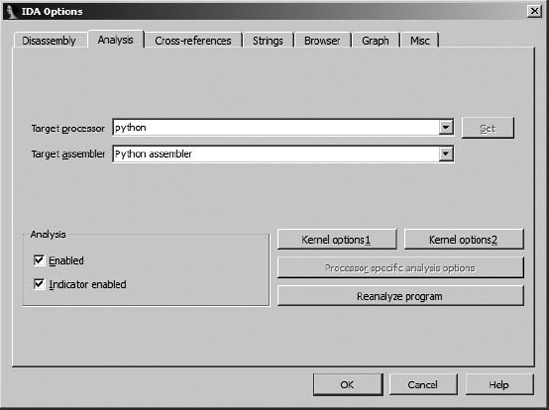
The shnames and lnames arrays specify the names of all processor types that can be handled by the current processor module. Users may select alternate processors on the Analysis tab of the Options ▸ General dialog, as shown in Figure 19-1.
Processor modules that support multiple processors should process the processor_t.newprc notification in order to be informed of processor changes.
The asm_t structure is used to describe some of the syntactic elements of an assembly language, such as the format of hexadecimal numbers, strings, and character delimiters, as well as various keywords commonly used in assembly languages. The intent of the asms field is to allow several different styles of assembly language to be generated by a single processor module. Processor modules that support multiple assemblers should process the processor_t.newasm notification in order to be notified of processor changes.
Ultimately, the completed version of our simple Python processor is capable of generating code such as the following:
ROM:00156                 LOAD_CONST 12
ROM:00159                 COMPARE_OP ==
ROM:00162                 JUMP_IF_FALSE loc_182
ROM:00165                 POP_TOP
ROM:00166                 LOAD_NAME 4
ROM:00169                 LOAD_ATTR 10
ROM:00172                 LOAD_NAME 5
ROM:00175                 CALL_FUNCTION 1
ROM:00178                 POP_TOP
ROM:00179                 JUMP_FORWARD loc_183
ROM:00182 # ----------------------------------------------------------
ROM:00182 loc_182:                           # CODE XREF: ROM:00162j
ROM:00182                 POP_TOP
ROM:00183
ROM:00183 loc_183:                           # CODE XREF: ROM:00179j
ROM:00183                 LOAD_CONST 0
ROM:00186                 RETURN_VALUE
While it is possible to generate Python disassemblies that reveal far more information than this, they require far greater knowledge of the .pyc file format than was assumed for this example. A somewhat more fully featured Python processor module is available on the book’s website.