
Chapter 6 Ourmon: Overview and Installation
Introduction
Botnets can be difficult to detect in a network, but recently, Portland State University’s Jim Binkley, a professor and network security engineer, modified a tool called ourmon to detect the presence of botnets using network traffic analysis. The basic idea is that ourmon detects network anomalies based on hosts that are attacking other hosts via denial-of-service (DoS) attacks or by network scanning. It can then correlate this information with IRC channels and tell you if an entire IRC channel (set of communicating hosts) is suspicious. Thus, it is possible to find an entire set of infected hosts at one time.
Ourmon is an open source tool. Originally, it was designed for network monitoring but after a period of time it was discovered that it was also an anomaly-based tool, meaning that once you knew what was normal, you could begin to get suspicious about what was abnormal (anomalous). Ourmon is a network-based tool and not a per-host tool like a garden-variety virus detector. It typically is used to tell you the state of all the hosts in an enterprise from one vantage point (the logical network center) and can be viewed as a statistical network trend indicator.
In this chapter and subsequent chapters we are going to take a look at various aspects of ourmon that pertain to low-level anomaly detection and higher-level detection of botnets. We will do this by looking at ourmon and how it works and also by looking at a few botnet-related case histories. Here is our chapter plan for the chapters on ourmon.
![]() Ourmon—Overview and Installation In this chapter we introduce ourmon and explain how it works and how to install it. We also introduce our case histories, which we look at in this chapter and in subsequent chapters.
Ourmon—Overview and Installation In this chapter we introduce ourmon and explain how it works and how to install it. We also introduce our case histories, which we look at in this chapter and in subsequent chapters.
![]() Ourmon—Anomaly Detection Tools—including the TCP report, UDP report, and e-mail reports. We look first at ourmon’s user interface (GUI) so that we can find our tools. Then we look at the low-level anomaly detection arsenal for detecting fundamental attacks of various sorts including scanning, DoS, and mass quantities of spam.
Ourmon—Anomaly Detection Tools—including the TCP report, UDP report, and e-mail reports. We look first at ourmon’s user interface (GUI) so that we can find our tools. Then we look at the low-level anomaly detection arsenal for detecting fundamental attacks of various sorts including scanning, DoS, and mass quantities of spam.
![]() Ourmon and Botnet Detection Here we look at both botnet client mesh and on-campus server mesh (C&C) detection. Ourmon collects IRC information with its IRC module and uses the TCP report in particular to attempt to figure out if an IRC channel is actually a botnet.
Ourmon and Botnet Detection Here we look at both botnet client mesh and on-campus server mesh (C&C) detection. Ourmon collects IRC information with its IRC module and uses the TCP report in particular to attempt to figure out if an IRC channel is actually a botnet.
![]() Advanced Ourmon Techniques In this chapter we look at how we can use ourmon to get more information about attackers including analyzing log data, using ourmon’s event-driven automated tcpdump feature. We will also talk about how to make ourmon more efficient in order to resist DDoS attacks.
Advanced Ourmon Techniques In this chapter we look at how we can use ourmon to get more information about attackers including analyzing log data, using ourmon’s event-driven automated tcpdump feature. We will also talk about how to make ourmon more efficient in order to resist DDoS attacks.
So the basic plan is to first look at four botnet-related case histories, and then discuss how ourmon works and how to install it. Then we proceed to the next chapter to look at the fundamental anomaly-based tools, which do not rely on IRC but simply look for “strange things” using statistics. Once we understand the anomaly-based tools we can take a look at the higher-level IRC-based statistics that can reveal botnets. Finally, we will take a look at some advanced data-mining tools and techniques that can help you differentiate borderline cases where, for example, it may not be clear that a given IRC host is due to malware, an IRC game, or possibly even a hacked host with an IRC channel used by a group of hackers for discussion or warez distribution.
 TIP
TIPHere are some Web sites for either downloading ourmon or getting more information about it:
![]() http://ourmon.sourceforge.net—ourmon info and download page at sourceforge
http://ourmon.sourceforge.net—ourmon info and download page at sourceforge
![]() http://sourceforge.net/projects/ourmon—ourmon project page at sourceforge
http://sourceforge.net/projects/ourmon—ourmon project page at sourceforge
![]() http://ourmon.cat.pdx.edu/ourmon—live data page at Portland State University
http://ourmon.cat.pdx.edu/ourmon—live data page at Portland State University
![]() http://ourmon.cat.pdx.edu/ourmon/info.html—online help for ourmon
http://ourmon.cat.pdx.edu/ourmon/info.html—online help for ourmon
Case Studies: Things That Go Bump in the Night
Before we take the plunge and give an overview of ourmon’s architecture, let’s first present four real-world case studies that we will reinforce as we go along. Here we will just briefly present some ourmon outputs in the form of reports or Web graphs and discuss them a little bit. Don’t worry if you don’t get all the details here. First let’s understand the big picture and details will emerge in later chapters. Each case study has a short name tag to go with it and there are four in all. One thing to point out is that all these cases are botnet related. We should also point out that all four cases have been collected from the Portland State University network. PSU currently has about 10,000 Ethernet switch ports with 26,000 students and faculty and a gigabit connection to the Internet. It’s a large network and can be said to be typical of larger enterprise networks.
Case Study #1: DDoS (Distributed Denial of Service)
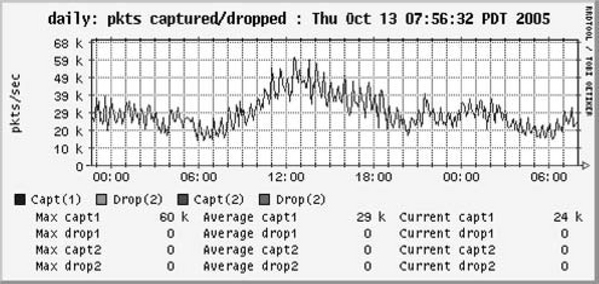
Ourmon uses graphics based on Tobias Oetiker’s popular RRDtool system (http://oss.oetiker.ch/rrdtool). Figure 6.1 shows a typical RRDtool graph used in ourmon. In this case, the graph (or filter in ourmon lingo) is called the pkts filter, which shows how many packets per second (pps) the ourmon system is processing. It also shows whether the operating system and ourmon collection system are dropping packets. The system will drop packets when there is too much work to do and not enough time. In this case, we are not dropping packets. We see a daily stripchart, where the current time (now) is on the right-hand side and “moves” left based on ourmon’s cycle time of 30 seconds. In other words, the graph is updated twice a minute. Essentially, this is a normal graph and shows PSU’s normal daily traffic with an early afternoon peak of 60k pps.
It is important to understand what is normal in order to understand what is abnormal. You need to observe your ourmon graphs and data daily and over time build up some idea of what is normal. Then you will be able to spot anomalies.
In Figure 6.2 we see a very abnormal version of the pkts filter. This is a DDoS attack. Keep in mind that there are thousands of hosts contributing to this graph. However, it is also possible for one host to put a spike in the graph with a DoS attack.
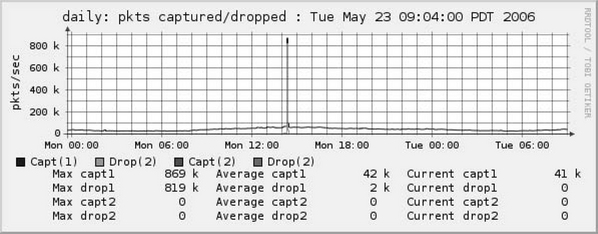
If you were the head network engineer and you looked at this graph, you might reach for the aspirin. There’s an anomaly now. Hopefully, you can spot it! Instead of the daily peak of 60,000 pps, apparently 870,000 pps have decided to show up for a brief time. The theoretical maximum for a gigabit Ethernet connection for 64-byte (minimum size) packets is on the order of 1.4 million pps. This is close enough (and bad). Ourmon and some human intelligence eventually got to the bottom of this attack. Apparently a student on campus was having a dispute with another person external to campus. The other person used a botnet to stage a multiple-system, large DoS attack on the PSU student’s IP host (and on port 22, the ssh port) for “revenge.” Many hosts (1000s) sent small TCP SYN packets to one PSU host. A botnet was used as the attack vehicle. This attack and similar attacks have damaged network services on campus at times in various ways. It is often the case that a DDoS attack will do damage to innocent parties by perhaps clogging up the Internet connection or causing network equipment to crash or suffer degraded performance. In fact, this attack caused ourmon to more or less stop during the attack because all the operating system could do was drop packets. The lesson here is that botnets can cause serious resource problems. We will return to this case study in Chapter 9 when we give some advanced techniques for interpreting ourmon data. One important lesson here: A remote DDoS attack via a botnet may take your network (or your network instrumentation) off the air.
Case Study #2: External Parallel Scan
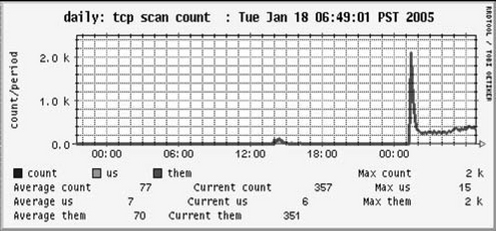
In the next chapter (Chapter 7), we will talk about some fundamental tools that ourmon uses to detect anomalies of various kinds. These include scan detection tools. In Figure 6.3 we see a picture of a particular ourmon feature called the worm graph that graphs the number of internal (home subnet) or external network “worms” A “worm” in this case, doesn’t really mean hosts having viruses. It more or less means hosts exhibiting behavior you might expect from a worm. In ourmon, a host that scans is said to be wormy. We show scanners with a red color for outside to inside (them) and green for inside to outside (us). In this case we had a rather alarming scan with over 2,000 hosts from the outside to the inside. Again, this had to be a botnet. It was used to perform a parallel scan of PSU’s /16 address space. This graph sometimes shows parallel scans and sometimes shows DDoS attacks. In this case, data elsewhere showed that a hacker was looking for e-mail systems at port 25. This particular tool is related to the TCP port report, which we will discuss in the next chapter at length.
Hackers Fingering Hackers
A graph like the one presented above once occurred because apparently hacker party A got mad at hacker party B and staged a botnet-based DoS attack on party B’s box and IRC server. However, party B’s box happened to be a very important but badly administered Windows server. The hackers didn’t know that the box had important administrative software on it. The administrators didn’t know that the box had hackers on it. The upshot of the massive DoS attack was that the administrators finally discovered that box B was hacked and fixed it.
Case Study #3: Bot Client
For our discussion of ourmon in this section, we are using two tables taken from an ourmon report called the IRC report (see Tables 6.1 and 6.2). This report is produced hourly and is a statistical analysis of various IRC channels seen in the packet stream. We have simplified the report and left out all kinds of details and numbers and reduced it to two tables for our discussion here. From a thousand miles up, the IRC report consists of a set of IRC channels (chat room names) and the IRC hosts that belong to those channels (IP addresses). Various statistics and sorts are presented for both channels and IRC hosts. Channels and hosts may be sorted in various ways including most messages in a channel.
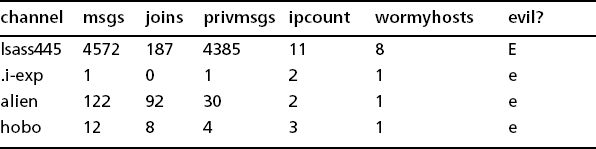
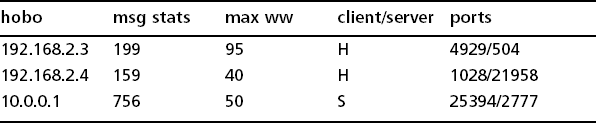
Our first table gives the evil channel sort. In this sort we rank channels high if they have more hosts in them with per-host higher-scanning weights. We will talk more about the scanning weight in the next chapter. For now, accept that we are just counting hosts (under the wormyhosts label). A scanner is a host that performed what appears to be an act of scanning. It is simply looking for other hosts—probably to attack them with an exploit. So for some reason channel lsass445 had eight scanners apparently out of 11 hosts. Given eight scanners out of 11 hosts in the channel including any IRC servers, it is pretty likely that this channel is a botnet. However, false positives do occur and a channel with just a host or two with a high scanner weight may easily turn out to be a false positive (not guilty). We call the scanning weight the TCP work weight and will talk more about it in the next chapter. We are also interested in the other three channels because they are borderline cases and far less easy to declare a botnet client network. Here it turned out that channels hobo and .i-exp were botnet channels with the same IP server address (we are not giving real IP addresses and will confine ourselves to giving addresses as either net 192.168/16 or 10/8. In our examples, addresses with 192.168 as a prefix may be assumed to be local. Addresses using net 10 may be assumed to be remote). It turns out that alien is innocent, and the other two channels are guilty. We will explain these details in Chapter 8 on botnets, and in that chapter and Chapter 9 give more details about how we investigated our data to determine if these channels were botnets.
From the enterprise perspective, you may encounter two types of botnet environments in your log files. The set of hosts participating in the bot traffic is called a mesh. You determine the type of mesh based on whether the botnet server is located inside or outside your enterprise:
![]() Client bot mesh This is the term for a set of botnet clients that exists within a campus or enterprise and communicates with an extenal botnet server. Botnet clients are sometimes called zombies.
Client bot mesh This is the term for a set of botnet clients that exists within a campus or enterprise and communicates with an extenal botnet server. Botnet clients are sometimes called zombies.
![]() Server bot mesh This bot mesh includes an on-site botnet server. Botnet servers are sometimes called Command and Control (C&C) hosts.
Server bot mesh This bot mesh includes an on-site botnet server. Botnet servers are sometimes called Command and Control (C&C) hosts.
Case Study #4: Bot Server
Case study #4 is about how we can detect an on-campus botnet server (C&C). Ourmon has the IRC report mentioned before and also a small set of RRDtool-based graphs, as seen in Figure 6.4. The graph shows the total network count of important IRC protocol message counts including JOIN, PINGS, PONGS, and PRIVMSGS. We suspect you can spot the anomaly. PING and PONG messages are used between servers and clients to maintain connectivity (JOINS too for that matter). Our normal count for PING and PONG messages is about 30 per sample period (a sample period is the 30-second fundamental ourmon sample time). All of a sudden PINGs and PONGS have gone way up. Wonder why? Simple. A botnet client was turned into a botnet server and all of a sudden had around 50,000 remote botnet clients. Our IRC report shows the amazing upsurge in connectivity as well. We will return to this botnet server case in a later chapter.

Botnet Servers and Clients
Botnet servers can have thousands of clients. Typical IRC channels used for chat by real human beings will not have that many clients. At our school we have never seen an IRC channel with more than 50 hosts in it used for real human chat. Thus, if you see an IRC channel with 36,000 hosts in it, you can be fairly sure you have a botnet server.
A botnet client is a piece of software. It may download a new version of itself. It can take commands from the C&C server. Thus, a botnet client can become a botnet server at any time. Or it can change its IRC channel, port, remote botnet server IP, and probably other attributes as well, including the set of attacks it uses. It is just software and it can always download a new version with more capabilities.
How Ourmon Works
In order to install and use ourmon, it is necessary to understand its architecture. In this section please refer to Figure 6.5, the Ourmon Architecture Overview, for our discussion. We will introduce some important configuration files and output files as we go along.
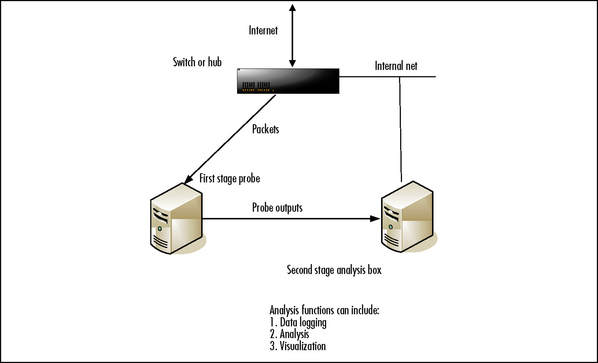
First of all, we need to understand that as software, ourmon is a packet-sniffing system and it has to be hooked up to a network in such a way that it either gets all the packets via an Ethernet switch set up to do port mirroring (send packets from one port to the ourmon sniffing port) or via the older Ethernet hub technology that by default shares all packets on all Ethernet ports. We can call this setup network capture. It is also possible to run ourmon on a single host to just look at that host’s packets, which we might call host capture. This may make sense for an important server or for a host that for some reason you believe to be the target of hackers. Normally, however, ourmon is an enterprise-level tool and is used for watching all the packets in an enterprise (or all the packets in a server farm). We will assume an enterprise install in this book.
Ourmon has two big software pieces, which we call either
![]() The probe (sometimes called the front-end in ourmon documentation), which sniffs packets and summarizes them into various bits of statistical information.
The probe (sometimes called the front-end in ourmon documentation), which sniffs packets and summarizes them into various bits of statistical information.
![]() The back-end graphics engine, which processes the probe’s outputs and makes Web graphics, ASCII reports, log entries, and reports and makes some of the results available on the Web via the ourmon Web interface. Some results (like logs) are not available on the Web. The graphics engine requires the user to install a Web server (like the popular Apache Web server).
The back-end graphics engine, which processes the probe’s outputs and makes Web graphics, ASCII reports, log entries, and reports and makes some of the results available on the Web via the ourmon Web interface. Some results (like logs) are not available on the Web. The graphics engine requires the user to install a Web server (like the popular Apache Web server).
The probe is written in C and uses the libpcap library to read packets out of a kernel buffer. Libpcap (from www.tcpdump.org) is a library used in UNIX systems that hides the details of packet sniffing so that tools like ourmon and snort, which use it, are more portable. The ourmon probe is actually called ourmon (perhaps not a clever name) and is typically invoked at boot via a shellscript called ourmon.sh as follows:# ourmon.sh start
Or it can be stopped just as easily with:
The probe is configured via an ASCII configuration file called ourmon.conf, which is supplied but needs some customization. For example, it is important to set an enterprise home network address plus mask. This enables ourmon to determine if IP addresses belong to your enterprise or are external. The probe runs (we hope) forever and is typically started at the boot time for the system. The probe can run on Linux or FreeBSD. We prefer FreeBSD for heavy packet loads, but Linux will work. (We will talk in Chapter 9 a bit more about how to optimize the probe). The probe produces a set of heavily aggregated output files. These ASCII files are fed as inputs to the back-end graphics engine. The probe’s output files thus become the back-end graphics engine’s input files.
We should point out that as an optimization it is possible to install the probe on a separate box and then arrange for the output files to somehow be copied to the back-end graphics engine box. This enables you to devote more CPU to the probe host and also to isolate the Web server behind a firewall (out of your DMZ) if desired. The simplest installation is to put all parts of ourmon on the same host, though (which will be our assumption for this book).
One other point to make about the probe and the graphics-engine software is what we might call cycle-times. There are a number of cycle-times in the system. This concept is fundamental to network management and ourmon at base is a network management system that happens to do interesting anomaly detection as well. The probe runs in a 30-second cycle. In other words, every 30 seconds it generates a snapshot of packet inputs in its various output files (for example, the main output file for the probe is called mon.lite, but it’s just an ASCII file full of data). So basically the probe runs for 30 seconds, generates a bunch of statistics in various forms, and then writes those stats out and zeroes its counters, starting over. This gives us a view of the network that is shown in the back end that we can call the “current” view. This view never lags more than one minute behind what is going on now. So in summary the probe produces data at 30-second snapshot intervals. This is not a real-time view, but is typically described as “near-time” because it does not lag very far behind reality. Now we can talk about the graphics-engine software, which has some additional cycle times including hourly and daily summarizations for reports.
The graphics-engine software is driven out of a UNIX crontab script entry with three fundamental cycle times. Crontab is just a way for UNIX to schedule tasks. Once a minute a script called omupdate.sh is invoked that produces Web page/graphics and 30-second ASCII reports. This script actually does its work twice a minute so that ourmon can have its 30-second update of Web information. There are also scripts that run on the hour and one script that runs around midnight. Hourly scripts take 30-second logged information and produce hourly summarization reports. The midnight run takes the last hourly report of the day and creates a daily report. Ourmon keeps roughly a week of daily reports around. Not everything has a daily report, but there are a number of such reports that will be important for our botnet-related work. Figures 6.1, 6.2, and 6.3 (note the graph label “Daily”) are examples of 30-second outputs and are examples of the RRDtool sub-system as well. Table 6.1 for our botnet client case is an hourly summarization for the current day in the form of an ASCII report. Thirty-second summaries for IRC do exist as a report, but they typically aren’t very useful until summarized simply because IRC is a slow and sporadic communications mechanism.
The back-end graphics-engine software can be said to be organized around the cycle-time concept, which is related to an old network management notion called baselining. Baselining simply means we want the system to give us some notion of history about the data. For example, in Figure 6.4 we can see a week’s worth of IRC message counts and this lets us see at a glance that Friday was a bit exceptional. The Web server software portion produces two kinds of graphics, including RRDtool strip charts and top N talker histograms. In this book we neglect the histograms because they are more important for traditional flow-based network monitoring. However, the RRDtool strip charts have an interesting feature and that is that any RRDtool strip chart in ourmon comes as a set of four including daily, weekly, monthly, and yearly graphs. This enables us to baseline data over a year. ASCII report data, like the anomaly reports we look at in the next chapter, including the TCP and UDP reports and the botnet ASCII reports in Chapter 8, only have one week’s worth of data at the most. Put another way, if it’s not RRDtool data, we may have a 30-second report (now), an hourly summarization, and a daily summarization. We keep about one week’s worth of ASCII daily summarizations.
Roughly, the back-end graphics engine produces the following kinds of data placed on the Web:
![]() RRDtool strip charts. Figure 6.1 is an example.
RRDtool strip charts. Figure 6.1 is an example.
![]() Thirty-second ASCII reports. We will see an example of this in the next chapter called the TCP port report.
Thirty-second ASCII reports. We will see an example of this in the next chapter called the TCP port report.
![]() Hourly summarizations, which are rolled over to daily summarizations at midnight. Our bot client information in Tables 6.1 and 6.2 is an example.
Hourly summarizations, which are rolled over to daily summarizations at midnight. Our bot client information in Tables 6.1 and 6.2 is an example.
![]() There is also an event log (which is kept as a daily report for a week and rolled over every day). Important system events (like warnings about too many IP hosts in an IRC channel) are logged in the event log, which is also available in a daily/weekly format like the summarized reports. We will discuss the event log in the final ourmon chapter.
There is also an event log (which is kept as a daily report for a week and rolled over every day). Important system events (like warnings about too many IP hosts in an IRC channel) are logged in the event log, which is also available in a daily/weekly format like the summarized reports. We will discuss the event log in the final ourmon chapter.
The back-end graphics engine also stores two kinds of logging information. One directory called rrddata stores RRDtool data, which has a special format that enables the one year of baselining graphs to be created. The other directory, called logs, is where the back-end graphics engine scripts store all logging information for anything in ourmon that is not RRDtool related. For example, 30-second IRC reports from the front end are stored here and are then built into hourly summaries placed on the Web. We will return to the logs directory in Chapter 9 for some advanced data-mining techniques that can help us extract botnet-related IP addresses from data stored in some of the log directories. One important aspect of the ourmon log system is that in general it gets to a certain size after a week and doesn’t get any bigger. RRDtool logs have a fixed permanent size when first created, so they don’t grow over time either. The other kinds of data stored in the logs directory are rotated every day so that, for example, today becomes yesterday, yesterday becomes the day before yesterday, etc. The very last day is deleted. Thus the logs reach a rough size and don’t become an administrative problem.
Installation of Ourmon
In this section we will assume that you just downloaded the ourmon tar archive that will have a name something like ourmon27.tar.gz and you wish to install it. We must first discuss ourmon’s directory layout so that you know which files are which and where to look for data. We then discuss library dependencies, which are needed by both the probe and Web server software. Finally, we discuss running the configure.pl configure script that does most of the work and also touch on how to bring the system up.
We typically install ourmon in a /home/mrourmon directory and will make that assumption for the remainder of our discussion. If you have problems with installation, be sure and look at these two files for more information:
/home/mrourmon/INSTALL—installationguide
/home/mrourmon/src/web.pages/info.html—ourmon help file (use a Web browser)
With a few exceptions, ourmon is a self-contained system that can be installed anywhere on a UNIX system. The best approach is to unpack it (tar xzvf ourmon27.tar.gz) and then decide if you want the system where you unpacked it or if you want to move it somewhere else. Assuming you are happy with your install directory, it is a good idea to read the INSTALL file before you install it, and then run configure.pl, which will configure and install the system.
Important directories and files (for example, /home/mrourmon) are located within the base of the ourmon directory (see Table 6.3).
Table 6.3 Ourmon Directory Guide
| directory/filename | notes |
|---|---|
| INSTALL | install howto file |
| configure.pl | ourmon configure script—run to build, install |
| bin | executables including shellscripts—installed by configure.pl |
| bin/ourmon | the probe executable |
| bin/ourmon.sh | the shellscript wrapper that starts/stops the probe |
| bin/omupdate.sh | the shellscript wrapper that runs the graphics engine |
| bin/omupdate.pl | the most important back-end script—there are others |
| etc/ourmon.conf | probe configuration and input file |
| logs/* | non-RRDtool ASCII log directories (lots of them) |
| logs/portreport | TCP port report logs—will look at this in later chapter |
| rrddata | RRDtool log directory |
| rrddata/ourmon.log | RRDtool error output file—look here if RRD problems |
| web.pages | symbolic link to ourmon Web browser data directory |
| web.pages/index.html | main ourmon html file—installed by configure.pl |
| web.pages/info.html | ourmon help—refer to this for detailed info on output and configuration |
| src/ourmon | ourmon probe source—note Makefile for BSD/Linux |
| src/web.code | ourmon back-end scripts |
| src/web.pages | ourmon-supplied static html pages—installed by configure.pl |
In addition to the above important files and directories contained within the ourmon directory subsystem, there are some external directories. For example, depending on the local Apache Web server setup, you might have an external directory like /var/www/htdocs/ for graphics-engine-generated data files to be put on the Web. You need to know the name of the external data directory for Web files before you run configure.pl. The system data directory for Apache servers is different from installation to installation. Refer to the Apache documentation for more information. You can find Apache at www.apache.org.
Let us first talk about system dependencies. This means those libraries or facilities assumed by the underlying ourmon system. Because ourmon is an open-source system, we don’t install binaries. We give you the source code, and therefore a C compiler and Perl are understood as system components. In addition, there are four pieces of software that the open-source ourmon system assumes are available. Three of them need to be installed before you run configure.pl. The important system dependencies are:
![]() A Web server. Installation of a Web server is necessary and we recommend Apache (www.apache.org).
A Web server. Installation of a Web server is necessary and we recommend Apache (www.apache.org).
![]() libpcap.a. This is needed by the probe. Typically, this isn’t a problem, but if it is, download and install it from www.tcpdump.org. Unfortunately, some UNIX distributions have an old version of libpcap. If you run the probe the first time, and it exits and complains about parsing errors in the supplied ourmon.conf BPF expressions, then you need to download your own version of libpcap and install it.
libpcap.a. This is needed by the probe. Typically, this isn’t a problem, but if it is, download and install it from www.tcpdump.org. Unfortunately, some UNIX distributions have an old version of libpcap. If you run the probe the first time, and it exits and complains about parsing errors in the supplied ourmon.conf BPF expressions, then you need to download your own version of libpcap and install it.
![]() libpcre.a. This is also needed by the probe for pattern-matching tags. Often libpcre.a is installed in /usr/local/lib (or /usr/lib). The main Web site for it is: www.pcre.org. A port for it exists on FreeBSD in /usr/ports/devel/pcre. On ubuntu Linux this command should install it:
libpcre.a. This is also needed by the probe for pattern-matching tags. Often libpcre.a is installed in /usr/local/lib (or /usr/lib). The main Web site for it is: www.pcre.org. A port for it exists on FreeBSD in /usr/ports/devel/pcre. On ubuntu Linux this command should install it:
![]() RRDtool. RRDtool Perl libraries are needed by the Web server software. You can get it from Tobia Oetiker’s RRDtool site (http://oss.oetiker.ch/rrdtool).
RRDtool. RRDtool Perl libraries are needed by the Web server software. You can get it from Tobia Oetiker’s RRDtool site (http://oss.oetiker.ch/rrdtool).
For FreeBSD, a port for ourmon itself exists that can be found on our ourmon site. The Web page for the release mentioned in this book is: http://ourmon.cat.pdx.edu/ourmon/distros/fbsd.port.27. Files found there can be used to automatically install ourmon. The port deals with dependency issues (barring Apache).
For Linux, see the /home/mrourmon/ubuntudep.sh shellscript in the base ourmon directory, which uses the Debian getapt utility to install the needed dependencies. After running this script, you can go ahead and run configure.pl.
Now we can run configure.pl, but first it is wise to be aware of what it will try to do and of the questions it will ask you. In general, when it asks a question you can go with the default (just press Enter), but sometimes you may want to change the answer to get things right. There are a couple of important questions that you want to get right. If configure.pl can’t find a compile-time dependency (like libpcap) for the probe, it will complain and stop. However, it doesn’t care if RRDtool is installed or not (you want to make sure that RRDtool does get installed). We will, however, give you a tip below for checking the RRDtool install. Roughly, configure.pl does the following things:
1. It compiles and installs the ourmon probe in the bin directory.
2. It creates a bin/ourmon.sh script for running the probe.
3. It installs a copy of the ourmon.sh script in whatever system directory is needed so that ourmon will start at system boot time.
4. It modifies /home/mrourmon/etc/ourmon.conf with a home het-work net/mask and also may modify the back-end graphics software so that all the ourmon system knows the difference between home network IP addresses and remote IP addresses.
5. It installs the graphics-engine software in the ourmon bin directory.
6. It creates log directories as needed.
7. It installs the supplied Web pages in the system ourmon Web directory.
Before you run configure.pl, spend some time going over the configuration tips in the next section.
Ourmon Install Tips and Tricks
When you use configure.pl to install the ourmon software, there are a couple of important things you should know first:
1. Know the name of your Ethernet interface. The configure.pl script will try to guess, but it may get it wrong. For example, on FreeBSD it might be em0. On Linux it might be eth1.
2. If it makes sense to have a home/mask network, then change the default supplied by the script. For example, you might have net 192.2.0.0/16, so put that in. If you don’t do this, you can always fix it later by changing etc/ourmon.conf and rebooting the probe.
3. When you install the graphics-engine software, configure.pl wants to know where it should put the supplied Web files that arrived when you unpacked ourmon and also where runtime-generated Web files should be put. This is the external Web directory that you need to make available to the Web via the (Apache) Web server. Web server configuration, which is beyond our scope, is needed to make that happen. Depending on which UNIX distribution you choose, your Apache Web server will have a global htdocs directory. For example, with FreeBSD is could be /var/www/data. You need to know where this directory is located before running configure.pl. Configure.pl will take your supplied Web server directory and append ourmon to it (thus making the directory /var/www/data/ourmon in the file system and http://yoursystem/ourmon available on the Web). Supplied Web files and generated files at runtime (barring log files) will all be put in that directory. Typically, any Web server has a default data directory and that is a good place for an ourmon Web file directory. Put the ourmon Web file directory inside the default data directory.
4. Configure.pl attempts to determine what form of crontab is in use on the system and creates the needed crontab directories. You can choose to have the installation process modify a root crontab file or you can choose to have the installation process write the necessary crontab directives to a file for you to update the root crontab file manually.
Without the crontab directives, the system won’t work. Note that if you do put the crontab directives in the live directory crontab file (for example, /root/crontab on FBSD), the Web server software will start to run and you may get e-mail from the system complaining that the probe input files do not exist. Delete the e-mail and start the probe so that the complaints will stop.
One more trick is worth mentioning. It doesn’t hurt to run any executable in the ourmon bin just to test things. So, for example, an easy way to check if the RRDtool package is installed is simply to run bin/omupdate.pl by hand. Or just invoke Perl on it in debug mode:
In the etc/ourmon.conf file, there is a magic configuration line called honeynet net/mask
In the TCP port report (and other places) that we mention in the next chapter, various application flags are used, which appear when ourmon learns something interesting about packets sent by a particular IP host. One application flag is called P for “honeypot.” If you have the space in your network to create a so-called darknet (or honeynet) and can tell ourmon the net/mask for that net, it will then flag IP hosts sending packets into that net. A darknet is a net with no hosts in it. This is a fairly effective and foolproof method for catching scanners and barring some P2P applications (Kazaa is reputed to behave badly but we have no experience with it), it can quite effectively reduce any false positive questions. Put another way, if you see a P, you have a scanner at 99.9% certainty. The network space that one needs to devote to a darknet is an interesting and open question. We believe that a /24 network will work. Your mileage may vary. In any case, this is a tremendously useful thing to do, so if at all possible have a darknet for capturing scanners.
Running it once will not seriously damage your logging. In either of the two cases (running it by hand or invoking the Perl debugger on it), complaints will be made if the RRDtool package cannot be found. If this is the case, see the INSTALL file for tips on how to get RRDtool installed.
Summary
In this chapter, we have introduced you to the ourmon network management and anomaly-detection system. Ourmon is a free open-source tool downloadable from www.sourceforge.com. We also introduced you to four case histories that we will use to dig deeper into ourmon in the next three chapters. In addition, we discussed how ourmon works as a software system and looked into how to configure and install it.
In terms of botnets, we want to reiterate a few fundamental behavior patterns that we saw in our case histories. In our first case history we saw that a multiple host DoS attack might be launched from the outside aimed at a local server of some sort. We will return to this case history in Chapter 9 on Advanced Ourmon Techniques. This case history is disturbing, because large DDoS attacks are very hard to monitor and can cause a great deal of network distress. Our second case history is focused on large parallel network scans, and we will touch on how to get more details about such a scan in the Chapter 7 on anomalies. Of course, both our case histories show external attacks. Sometimes these attacks may be inside out and in that case they reveal serious signs of infected hosts in an enterprise. Ourmon’s anomaly system is both powerful and fundamental and a good understanding of it can help you fight botnets at least in terms of detecting attacking systems. Obviously, ourmon’s IRC mechanism may not always detect botnets or systems with a worm or virus because such systems may not use IRC or may lack a communication channel entirely. This is another good reason for understanding ourmon’s fundamental anomaly-detection subsystems. Our last two case histories are on botnet meshes, botnet client meshes, and internal (by definition) botnet server meshes. In Chapter 8 we will discuss ourmon’s IRC statistics and report features that can help you determine if you have attacking (and sometimes passive) botnet meshes of both kinds.
Solutions Fast Track
Case Studies: Things That Go Bump in the Night
![]() Ourmon uses graphics based on Tobias Oetiker’s popular RRDtool system (http://oss.oetiker.ch/rrdtool).
Ourmon uses graphics based on Tobias Oetiker’s popular RRDtool system (http://oss.oetiker.ch/rrdtool).
![]() The pkts filter shows how many packets per second (pps) the ourmon system is processing.
The pkts filter shows how many packets per second (pps) the ourmon system is processing.
![]() You need to observe your ourmon graphs and data daily and over time build up some idea of what is normal. Then you will be able to spot anomalies.
You need to observe your ourmon graphs and data daily and over time build up some idea of what is normal. Then you will be able to spot anomalies.
![]() The pkts filter can be used to see DoS and DDoS attacks.
The pkts filter can be used to see DoS and DDoS attacks.
![]() The worm graph filter can be used to see large parallel scans.
The worm graph filter can be used to see large parallel scans.
![]() The hourly IRC report can be used to look for anomalous IRC channels and may indicate botnet activity.
The hourly IRC report can be used to look for anomalous IRC channels and may indicate botnet activity.
![]() The RRDtool IRC message count graph can show an on-campus botnet server.
The RRDtool IRC message count graph can show an on-campus botnet server.
How Ourmon Works
![]() Ourmon architecturally has two main components, a probe (sniffer) used for packet capture and a back-end graphics engine that makes Web pages.
Ourmon architecturally has two main components, a probe (sniffer) used for packet capture and a back-end graphics engine that makes Web pages.
![]() The ourmon system has three important cycle times. The probe produces outputs every 30 seconds. The back-end software produces base-lined data including hourly and daily ASCII reports.
The ourmon system has three important cycle times. The probe produces outputs every 30 seconds. The back-end software produces base-lined data including hourly and daily ASCII reports.
![]() RRDtool graphs include daily, weekly, monthly, and yearly graphs.
RRDtool graphs include daily, weekly, monthly, and yearly graphs.
![]() Ourmon dynamically creates Web pages and logs. The logs may be used for extracting more details about a particular case and are also used internally by ourmon to produce hourly summarizations.
Ourmon dynamically creates Web pages and logs. The logs may be used for extracting more details about a particular case and are also used internally by ourmon to produce hourly summarizations.
Installation of Ourmon
![]() The supplied tool configure.pl is used for installing ourmon.
The supplied tool configure.pl is used for installing ourmon.
![]() Ourmon has various dependencies (software not supplied by us) including a Web server, the RRDtool library, the libpcap library, and the PCRE library. These should be installed before ourmon is configured.
Ourmon has various dependencies (software not supplied by us) including a Web server, the RRDtool library, the libpcap library, and the PCRE library. These should be installed before ourmon is configured.
![]() The ourmon.sh script is used to start the probe.
The ourmon.sh script is used to start the probe.
![]() The back-end graphics software is run from the root crontab once a minute.
The back-end graphics software is run from the root crontab once a minute.
![]() If you have installation problems refer to the INSTALL file.
If you have installation problems refer to the INSTALL file.
![]() It is a very good practice to dedicate a small subnet as a darknet. This can be very helpful in detecting scanning hosts.
It is a very good practice to dedicate a small subnet as a darknet. This can be very helpful in detecting scanning hosts.
The following Frequently Asked Questions, answered by the authors of this book, are designed to both measure your understanding of the concepts presented in this chapter and to assist you with real-life implementation of these concepts. To have your questions about this chapter answered by the author, browse to www.syngress.com/solutions and click on the “Ask the Author” form.
Q: What parts of ourmon are important for botnet detection?
A: The anomaly-detection systems discussed in the next chapter and in Chapter 8 on botnets are useful for botnet detection.
Q: What parts of ourmon are important for anomaly detection?
A: In the next chapter we will talk about the TCP and UDP port reports and the new e-mail version of the port report, which are all useful for anomaly detection. That said, most of ourmon is in some general sense useful for anomaly detection simply because if you know what is normal, you can detect what is abnormal. The downside is that you have to look at the statistics over some period of time (say a week at least).
Q: What parts of ourmon might be useful to detect spammers?
A: The e-mail port report is useful for detecting spammers. Although we won’t discuss top N talkers in this book, packet counts and use of port 25 for top hosts can be a giveaway. The real tip here is to use a firewall or access control lists to block port 25 for hosts that are not e-mail servers.
Q: How can we detect DoS or DDoS attacks with ourmon?
A: The two RRDtool graphs mentioned in this chapter as case histories are a good start. The fundamental packets graph (pkts filter) can show multiple attacks or scans and can even be affected by a single instance of one host used for a DoS attack. The worm graph is also useful for detecting parallel scans. Sometimes the event log will give an IP address for a scanner (UDP in particular if the automated TCPDUMP function is turned on—see Chapter 9). For TCP, one needs to find the associated TCP port report based on a time estimate (again, see Chapter 9).
Q: Should my probe system have only one Ethernet interface or should it have two, one for sniffing, and one for remote access?
A: It is far better and more secure to have two interfaces. The sniffing interface at least on BSD can be configured to have no IP address (or you can use a private non-routable IP address like 10.0.0.1). This makes it difficult for attackers to feed fake packets directly to the monitor box, thus tying up its CPU. Two interfaces also mean that the control interface can be protected in various ways, possibly using switched VLANS so that it cannot be addressed by external hosts. If you can use two interfaces on the probe, by all means do so.
Q: I run the ourmon probe and nothing happens? Any advice?
A: Try running the startup script by hand. Also, look in the system log directory or on the console for error messages. Often the system log directory is /var/log/messages. One common error is getting the interface the probe wants to use wrong. For example, on Linux you might tell configure.pl that the probe interface is eth0 when it should have been eth1. Looking at /var/log/messages or using the dmesg command can help you figure out which interface goes with which interface name. The netstat command can also be used to see if an interface is up or if packets are being sent or received.
Q: Do I have to worry about the ourmon logging system? Will it fill up and devour all known disk space eventually?
A: Probably not. After one week, it will more or less occupy a fixed amount of space. RRDtool rrd databases do not grow after they are initially created. The log directory files do get rolled over from day to day, but typically one day is about the same size as the next day, thus the overall amount of used disk space does not change.