
Chapter 9 Advanced Ourmon Techniques
Introduction
In this chapter we present some advanced techniques, including ways to help you resolve anomalies when they crop up in the ourmon graphs or reports. At the end of the chapter we will look at some other techniques for improving ourmon’s performance. These methods are important because they can lead to both a more efficient front-end probe capable of doing more work; they can also help prevent the probe system from being overwhelmed by a denial-of-service (DoS) attack.
First we’ll look at ourmon’s automated packet capture feature that can be used to automate packet capture by the probe in the case of certain events. We will also look at the associated event-logging mechanism in ourmon and see what kinds of events show up in the daily system event log. We then look at a grab-bag of techniques that include ways to mine the ourmon files for data and a couple of sniffing tools, including ngrep and an ourmon toolkit tool called ircfr. These tools can be used to extract more detailed information when you are suspicious of particular IP hosts. Finally we will look at ways to improve ourmon’s performance.
Automated Packet Capture
Regarding analysis, remember: The problem with anomaly detection is that you might clearly see that an anomaly exists, but you might not have a good explanation for it. For example, in Chapter 6, we discussed a rather horribly graphic anomaly, but we didn’t explain how we resolved it. The anomaly was an unprecedented packet count spike, but few, if any, details about who was doing the attack, what kinds of packets were used, and what exactly was the target. The attack described in Chapter 6 is an outstanding example of the system presenting the analyst with an anomaly but not providing enough clues to resolve the anomaly.
In the ourmon.conf file, it is possible to turn on various automated packet capture triggers. Roughly, this means that when some integer counter (say, the number of scanners) hits a threshold of some sort (say, 60 hosts), ourmon will record the next N packets in a file. The file is a tcpdump file, meaning that it can be replayed with any sniffer software that uses the well-known pcap (www.libpcap.org) packet capture library. This is commonly used by tools like ourmon, Snort, and, of course, tcpdump itself, which is an open-source network sniffer (found at www.libpcap.org). WireShark (www.wireshark.org) is another sniffer you might want to use.
In this chapter we discuss three ourmon triggers that are closely associated with anomaly detection. However, before we explain the triggers and look at sample trigger data, let’s first give a general overview of how the automated packet capture feature operates. In the first place, all the triggers are turned off when ourmon is installed. This is an advanced feature and not something you want ourmon to do until you are ready for it. Automated packet capture can be very useful for explaining what happened during an anomalous event. On the downside, it imposes a lot of overhead on the probe system, primarily due to file I/O during the normal ourmon probe sampling cycle time.
Roughly all the triggers have similar ourmon.conf syntax:
The trigger has a name that reflects its function. For example, as we see in the following, a trigger_worm trigger attempts to record packets from large numbers of scanners. A trigger has a threshold that causes ourmon to start storing packets when the threshold is exceeded. The threshold might be a packet count, but it might be something else, too, such as a rate (for example, bits/sec or packets/sec). Of course, this depends on exactly what type of trigger is being used, as we will see when we examine details about specific triggers. The packet_count specifies the number of packets to store in the output dump file. The dump_directory is a directory name on the probe system that tells the probe where to put the stored packets. Be sure to create this directory by hand, because ourmon will not create it for you. The filename is automatically constructed by ourmon and includes the trigger_name and a timestamp so that all the packet capture tcpdump files have a unique filename.
In general, all the triggers work like this:
1. In the config file, you turn on a trigger by putting in the config parameters as described previously.
2. You then reboot ourmon and it checks your trigger syntax. It fails if you made a mistake. (See /var/log/messages for errors or check the console display.)
3. Every 30 seconds, ourmon now checks the trigger threshold.
4. If the trigger threshold is exceeded, ourmon creates a unique filename for the trigger that does not conflict with other triggers or trigger files produced by the same trigger.
5. Ourmon then begins to store packets until either the packet count is exhausted or the trigger threshold is crossed in the opposite direction (going down). For example, packets will no longer be stored if the trigger is set at 50 hosts for the worm trigger and the threshold is crossed from 60 hosts to 40 hosts during a sample period.
In general, packets are stored based on a per-trigger filter specification. For example, the UDP trigger we mention in a moment is per IP address, and only UDP packets involving that IP address will be stored. Some triggers have a trigger filter specification, and some don’t. For the kinds of triggers we talk about here, the trigger filter specifications are not user programmable. (However, there is a form of trigger that we are ignoring here that is associated with the BPF user graph feature and is programmable by the user. See info.html for more information; we won’t cover it here.)
When ourmon decides to store packets, it opens a file in the specified directory with the filename syntax as follows:
There are two things to note in general about the stored packets. One is that the packets will not be any bigger than the so-called snap length, which is passed into the ourmon probe when it is booted. Currently that value is 256, which will catch a great deal of Layer 7 payload information (IRC information in particular). Second, it is always possible that a trigger will fail to capture any packets. This is because triggers get turned on only after one basic probe cycle of 30 seconds. There might simply be no packets after the trigger is turned on, so the packet capture dump file might have no content for the obvious reason that no packets are arriving.
For anomaly detection, the three triggers of most interest are the tworm (trigger_worm) trigger, the UDP weight trigger, and the drops trigger. These triggers are not the only triggers in the ourmon system. (See the info.html Web page for more information.) However, these three in particular are extremely useful in resolving some kinds of malware-related problems, including DoS attacks launched remotely, or worse, from your internal network aimed at the outside world. Now let’s talk about each trigger in detail.
Anomaly Detection Triggers
The tworm trigger stores a certain number of TCP packets when the probe detects that the counters associated with the TCP worm graph have exceeded a specified number of IP hosts. This is the total count (not “us” and not “them”). In the ourmon.conf file this trigger is specified as follows:
In this case we are saying that we want to store 10,000 packets in our output file when the count of all scanners in the TCP worm graph is 60 or more. This particular trigger stores only TCP packets. Only TCP SYN packets are stored. Output filenames have the form:
The UDP weight trigger stores the specified number of packets for a single UDP host when the UDP work weight threshold specified to the probe is exceeded. The config syntax is as follows:
This means that if the UDP work weight exceeds 10 million as a threshold, 10,000 packets will be stored in the output file. Only UDP packets from the IP host in question are stored. The output file-naming convention is as follows:
Our last trigger is the trigger that solved Case Study #1. It is called the drops trigger. This trigger is associated with the fundamental packets/drops RRDTOOL graph that shows the total number of packets seen by the probe and the operating system buffer drops, which are packets that did not get to the probe. Drops may occur because the system is doing too much work. This could be because the NIC interrupt system and CPU are just not fast enough to get the job done. The name here might be said to be a misnomer. We obviously cannot store dropped packets. However, the name refers to the trigger threshold. Because the pcap library can count dropped packets even though they are not stored, we choose to trigger on a drop threshold. If our probe is not dropping packets or at least is dropping packets in a regular way, we can choose to make it try to store packets when something really big comes along—and something big might be a botnet-related DOS attack. So the threshold is the RRDTOOL current drop value in the associated packets graph. Our config language is as follows:
This means if we are dropping 20,000 packets or more, store 40,000 packets in the output file. The output file format is as follows:
It is counterintuitive that this particular trigger might actually work. It has worked on some occasions, and on some occasions it has failed. This is because we can state that triggers will work better in general if they are looking for something that is well defined in the packet stream. The tworm and UDP triggers both have a better logical signal-to-noise ratio, which in this case means that the packets stored are more likely to be what has caused the trigger threshold to be exceeded. If you see a lot of packets per second in your network and you store them all, you might not be able to find what caused the problem. So, it is better if the answer more closely approximates the problem. In the case of the drops trigger, this is not necessarily the case, because there is no filtering at all. Any packet seen is stored. However, if there is a very large DoS attack, it is quite possible that all the packets actually seen by the probe will only be DoS packets. In fact, the bigger the DoS attack, the more likely this outcome becomes. In the next section we will look at some actual examples of this trigger system at work and learn how to analyze the outputs.
 Tip
TipSo, how does one tune the trigger thresholds? At first, simply watch the three graphs: the associated TCP worm (Figure 6.3), the UDP weight graph (Figure 7.4), and packet/drops RRDTOOL graphs (Figure 6.1). Note the daily highs over a week or two. In other words, learn what is normal first. Then turn on the triggers at a point higher than daily peaks over a period of time. This makes sense if you are in a benign environment. If you find you are in a very hostile environment (lots of spikes), you really won’t have a problem choosing a threshold.
Real-World Trigger Examples
In this section we look at two real-world examples of data taken from triggers. First, though, we have to mention that the ourmon event log is where you find out that a trigger has been turned on. Trigger on and off messages are posted there. So any time a trigger is turned on, basic information about the trigger is stored in the event log. Refer to Chapter 7, where Figure 7.1 shows the top of the main ourmon page. Note the two headings event log today and event log yesterday. The weekly summarization for the event log is near the bottom of the page as well. The event log entries will tell you the name of the trigger dump file, the time the file was created, and some information about cause, including at least the name of the trigger type. For example, if the UDP weight trigger goes off, we might see something like this:
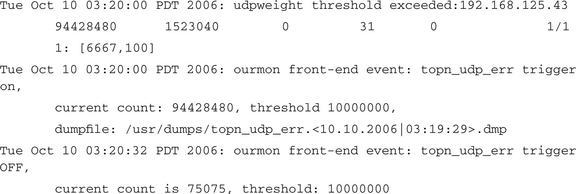
There are two features here. The first one is that the UDP port report information for the threshold violation is stored in the event log. This is a back-end software feature. This is shown in the first line above. As a result you are told the IP address of the violator, and in fact the entire UDP port report line is put in as well. Ironically, in this case if you have any experience, you probably don’t need to go look at the packet data. Why? Because you see that a lot of UDP packets (15 million in 30 seconds) were sent to one IP destination at one port and the port in question was 6667 (which is an IRC port, but IRC uses TCP). It smacks too much of a retaliatory UDP DOS attack. The trigger-on and trigger-off messages also provide useful information. For example, the trigger-on message shows the configured threshold and gives the filename in which we hope to find packets. The real filename is:
So let’s actually use the tcpdump utility and look at the packet dump. To do this, we have to change directory to our configured directory on the probe system and invoke the tcpdump utility on the filename. The dump filenames are cumbersome and are not something you ever want to type in. The best thing to do is to use cut and paste. One problem with the current syntax is that it defeats the Unix shell because of the > and < characters and the | (pipe) character as well; this should be fixed in a future release. In general, you want to put quotes around the filename as a result. So, assume that you cut and paste and feed the filename to tcpdump as follows:
It is worth pointing out that we can use shell wildcard characters and cheat without using the full filename, like this:
So, –n means no reverse pointer DNS lookup, -X means that you want a hexdump and a traditional ASCII translation (if available) on the right-hand side of the packet contents, and –r tells tcpdump to take its input from a file, not the network. As a result, we get something like the following:


If you don’t know enough about the TCP/IP protocols, choose one of these two well-known foundation books on TCP/IP and read it:
1. The Protocols (TCP/IP Illustrated, Volume 1), by W. Richard Stevens; Addison-Wesley, 1993, ISBN 0201633469
2. Internetworking with TCP/IP, Vol. 1 (Fifth Edition), by Douglas Comer.; Prentice-Hall, 2005, ISBN 0131876716
Either of these books will give you the fundamental knowledge you need to deal with decoding TCP/IP packets. Unfortunately, Stevens passed away in 1999, but his book is still very useful in terms of details. Comer’s book is more up to date.
If you want more details about tcpdump itself as a utility, you should read the man page itself; it is well written and has examples. Tcpdump comes from www.tcpdump.org and works on all Unix systems as well as Windows. Another very popular free sniffer is WireShark, which you can find at www.wireshark.org. WireShark has plenty of documentation and an extensive set of protocol dissectors. Both tools can use the standard tcpdump format files produced as output by ourmon.
So, what can we learn from our tcpdump data? The first line of the tcpdump output is as follows:
So an internal system using the source UDP port 35415 was sending packets at a particular external system with the destination port 6667. The payload size (L7 data) was 10 bytes. The reason we used the –X parameter was actually to inspect the contents of the data payload above the UDP header. The hexdump starts with 0x45, which indicates an IPv4 packet and is the start of the IP header itself. IP headers are normally 20 bytes long. UDP headers are 8 bytes long. The ASCII dump on the right-hand side shows that the data contents were the ASCII numbers 0123456789. We can observe that the strength of the outburst (1.5 million packets in 30 seconds), the remote port (UDP/6667), the size of the packets themselves (small as possible), and of course the lack of any significant data, as well as the UDP weight metric itself, all strongly suggest that the data flow was useless and was crafted as a DoS attack.
We know from our own forensic experience that attacks like this are commonly aimed at Unix-based Web servers running Web scripts using a program with unpatched bugs. An example of this sort of attack is the Perl-based Santy worm (see www.norman.com/Virus/Virus_descriptions/19122/en), which used Google to look for vulnerable sites to attack. Once a system has been compromised with some malware like the Santy, a tool might be downloaded that allows the attackers to start large UDP-based attacks at remote sites and could very well include a botnet master connection as well. We don’t have any specific knowledge about why UDP port 6667 might have been chosen. Typically that port is associated with an IRC server, but traditionally IRC servers use TCP port 6667. Of course, we can say that sending a high volume of useless UDP packets at a remote system is an antisocial act.
Now let’s look at another example. In this case we’ll examine the output created by the drops trigger during the DDoS attack described in Chapter 6. Here we have three sample packets:
12:58:29.366866 IP 10.0.10.1.32560 > 192.168.4.4.22: S
549104161:549104161(0) win 32120 <mss 1460,sackOK,timestamp 9651414
12:58:29.366869 IP 10.0.10.2.17001 > 192.168.4.4.22: S
1301935973:1301935973(0) win 32120 <mss 1460,sackOK,timestamp 8936451
12:58:29.366872 IP 10.0.10.3.1878 > 192.168.4.4.22: S
3044014642:3044014642(0) win 32120 <mss 1460,sackOK,timestamp 2950212
Here we are seeing external IPs targeting one interior network IP at port 22, which is typically used by the Secure Shell daemon (SSHD). All the packets are TCP SYNs, which means that all the packets are as small as possible. (Ethernet packets above the Ethernet layer must have at least 46 bytes minimally. This is why the UDP packets that appeared previously have zeros following the 10 bytes of ASCII payload.) Thus these SYN packets (as is usually the case with DoS attacks) are small packets that have only an IP header and a TCP header, typically only 40 bytes in all. In addition to small, SYN packets can, of course, cause the receiving operating system to have problems processing them because the operating system might want to believe that the remote host is sincere about starting a TCP connection. This can exhaust resources on the target’s operating system because there will be a high number of half-open sockets. Of course, in this case the remote hosts are the complete opposite of sincere.
In this case the drops trigger worked, probably due to the overwhelming nature of the attack. Most if not all of the packets received were part of the attack. We were lucky that we were able to get the IP address and port number of the attacked system. Evidence seems to indicate that the attackers were from multiple sites and were in fact likely a botnet being used to launch a DDoS attack. One must not forget that with such an attack, IP spoofing (meaning fake IP source addresses) is a possibility. One-way attacks do not require two-way conversations.
Hackers, DoS, and Packet Size
Remember the Hacker Rule of Economy we mentioned previously? It applies to DoS attacks, too. The goals from the dark side include sending as many useless and harmful packets as fast as possible. Sending one TCP SYN packet a minute might work for scanning, but it would not be much of a DoS attack. With a gigabit Ethernet connection, one can receive approximately 1.5 million packets per second (pps). If you have a 100-megabit Ethernet connection, divide by 10, so 150,000pps are possible. Ten megabits means the best small packet throughput would be 15,000pps. More worrisome, a 10-gigabit Ethernet connection could potentially receive 15 million pps! Ouch. This is a doable number with a botnet of a certain size. On the other hand, for gigabit Ethernet, using the maximum Ethernet packet size of around 1500 bytes, we only get 81,300 pps. These days your garden-variety PC can handle 81,300 pps, so a hacker is not going to send 1500-byte packets.
The implications here are clear. Small packets are nasty for the receiving host or network. NICs on the receiving side and host operating systems could be overwhelmed due to interrupts and other problems. Intermediate smaller systems like routers, wireless access points, and the like, if not robust enough, might also have severe problems. Although this won’t help everyone, Cisco has some suggestions for making its systems more robust, including using its TCP intercept feature. For example, see http://cio.cisco.com/warp/public/707/4.html or http://cio.cisco.com/univercd/cc/td/doc/product/software/ios113ed/113ed_cr/secur_c/scprt3/scdenial.htm.
In general, dealing with these kinds of attacks is very difficult, and it is a problem that’s far from being solved.
Ourmon Event Log
In this section we briefly discuss the ourmon event log, which we introduced in the previous section. Ourmon stores various front-end probe and back-end “events” of interest in the event log. For the most part, events are either important security events or important system events such as probe reboots. A daily log of events is created and placed on the Web for reference. The event log can be found on the main Web page. Refer back to Figure 7.1 and note that the daily event log and yesterday’s event log are available for quick reference under the important security and availability reports/web pages heading. The week’s worth of event logs is available at the bottom of the main page as shown in Figure 7.3. Like every other log in ourmon, the event log is also saved for a week and rotated at midnight.
Roughly anything that is deemed highly important is put in the event log, including the following types of events:
![]() Important probe events like reboots and trigger-on and -off messages
Important probe events like reboots and trigger-on and -off messages
![]() Back-end software problems, including taking too much time to process the 30-second probe outputs
Back-end software problems, including taking too much time to process the 30-second probe outputs
Any event log message starts with a timestamp, followed by the event message itself, which can come from any part of the ourmon system. For example, we previously saw a UDP work weight threshold message that started like this:
Note the time of the event, which is followed by an explanation of the event and other data. Given our focus on anomaly detection, the anomaly detection events are of the most interest. These include the UDP work weight threshold event and the trigger-on and -off messages mentioned previously. In addition, we have two events that can come from the IRC software:
The first message is trying to alert you to an evil botnet channel that has at least three scanning hosts. The second message alerts you to the possible presence of a bot server on campus. In both cases, X is replaced by the actual channel name. If you see these messages, go straight to the IRC data page and check out what is happening.
In general, see the ourmon help page (info.html) for more information on the event log. This page also includes information on how to change the botnet-related event log constants that trigger these two messages.
In summary, the event log is something you should check daily. If an interesting anomaly-related event occurs, you might want to either refer to various sections of ourmon for more details, including your IRC logs (Chapter 8) and tcpdump packet traces as discussed in this chapter, or possibly your TCP port report summarizations and logs (Chapter 7 and the next section).
Tricks for Searching the Ourmon Logs
A couple of basic tricks can be useful for searching for information in both the ourmon Web directory and in the ourmon log directory. Consider the following two questions:
1. Given that you know that IP address 10.10.10.10 is suspicious, how can you search any and all ourmon data to find out more about it? Let’s call this the IP search question.
2. Given that the TCP worm graph (as in “Case Study #2: External Parallel Scan”) has a large spike in it, just how do you find the associated TCP port report for that time so you can see details about the scan? Let’s call this the port report search question.
So let’s address the IP search question first. Log in to the back-end system and locate the two directories in which ourmon data is stored (barring the RRDTOOL data). We have either the Web pages directory or the logs directory (which is not available on the Web). Assuming you installed ourmon in /home/mrourmon, those two directories would be:
Of course, we are going to use the Unix grep pattern-matching tool for doing the search. For the Web directory, we might do something like the following:
This could work. However, the problem with such a search is that we might get too much data. There is also the problem that you are “peeking under the covers” and looking at web-based reports with their real filenames as opposed to their more symbolic hypertext links seen with a Web browser on the main index.html page. Given our interest in botnets, the two more interesting sets of files are probably the daily IRC report summarizations and the daily syndump summarization that gives you summarized home network TCP port report information. You might also be interested in the summarized files for the TCP port report itself, which includes both local and remote addresses.
For example, for IRC data, the daily file is called ircreport_today.txt, and the previous day’s file is called ircreport.0.txt, followed by ircreport.1.txt for yesterday, and so on. For the syndump reports, today’s file is called syndump.daily.txt, and the previous day’s file is called syndump.0.txt, followed by syndump.1.txt, and so on. For unfiltered TCP port reports based on nonzero TCP work weights, the daily file is called wormsum.all_daily.txt. Yesterday’s file is called wormsum.all.0.txt, and so on. In all cases, 0.txt means yesterday, 1.txt means the day before yesterday, and the like. Now, armed with that knowledge, we could do something more focused, such as first searching all the IRC summarizations and then the syndump summarizations for a particular IP address to see what it had been doing for the last week:
With the IRC data, we might get something like the data shown in Table 9.1. (For formatting reasons, some data has been excised and the output has been expressed as a table with a header.)

In a similar manner, we can grep the syndump files, but each IP host has multiple lines of data. So first we use grep to find relevant files (output not shown), and then we can use a text editor to learn something like the following from one or more files:
Another possibility is to simply use grep –A 4 on the IP address, with no need for a text editor, as follows (the result should be the same):
Since we saw a high scanning value in the IRC data, we also might choose to examine individual TCP port report files in the log directory. Remember, these are 30-second report files. This can help us learn more details about the scanning behavior of this host. In this case we go to the /home/mrourmon/logs/portreport/Sun directory and use the find command to do a grep across those files. The Unix find command is useful here because it is often the case that there are too many files in a log directory and simpler commands like ls will not work. Find always works. So, for example, we might do something like the following to get individual 30-second port report data (see Table 9.2):

Again we have cleaned this data up for formatting reasons and eliminated some fields. The entries are sorted in increasing order of time because the files are stored with the filename and timestamp matching. We can thus search the individual TCP port reports and watch what happens over time. In effect, you can play the data back. From an analysis point of view, we can see that there really were high work weights (94, 92, 79). Our host was sending about one packet per second, and the destination ports 8080 and 8000 were the target. The target did not seem to be sending many packets back. There is one more point we can make: We still didn’t figure out exactly what the host was doing. Given the ports in question, it is possible that this host was scanning for open Web relay hosts, which are often used for sending spam. If the host is active at this point, you might go and look at Layer 7 payloads with a sniffer. For example, you can use tcpdump as we mentioned or ngrep, which we will discuss briefly in the next section.
Regarding the port report search question, one trick worth mentioning is a somewhat sneaky way to search the port report logging directory. If you have a case like Case Study #2 with a dominant scanner count spike in a particular day, you really want to find the biggest port report file in that day. This is because there is one line per IP address in the 30-second port report file. So, given one line per IP address, obviously the scan in Figure 6.3 will produce the largest files in the directory for that day. We use the wc (word count) utility to determine the lines in each file, and we sort by that output like so:
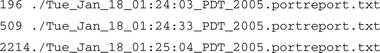
The sort makes the largest file come out last. When examined, this file (the one with 2214 lines) showed one IP address as the target for many external hosts. which were all doing the same form of attack. Thus the port report file itself fingered the target IP host. In general, parallel scans or DDoS attacks will result in large port report files.
Sniffing IRC Messages
Sometimes the IRC reports mentioned in Chapter 7 are not enough information to help you find possible botnet-related IRC channels. You have learned two analysis techniques so far:
1. Look for evil channels and you can assume that more than a handful (two or more) that are scanning IP hosts means you probably have a scanning botnet.
2. Look for channels that you have never seen before and then keep an eye on new names.
However, the latter point is vague. The question is, can you do anything about a possible bot-related IRC channel before it attacks? One thing we can do is branch out from ourmon and use other tools to keep an eye on packet payloads. For example, we can choose to watch a suspicious IRC channel with a tool like ngrep and try to figure out what is going on with that channel. That might work, or it might fail because the interesting events already happened or nothing is happening now. Another possible tool is to use a small sniffer supplied as an ourmon tool in the ourmon release called ircfr (IRC flight recorder) that records all IRC traffic. With ircfr, if you find a suspicious channel (say, #y3## for a channel name), you can go back in time and check out yesterday’s log to see what messages, if any, appeared. This could help you decide if an IRC channel is benign or “botty.”
Lost Botnet Hosts
A botnet host might or might not be used for an attack., so keep in mind that it is always possible that the host might belong to a botnet (and there might be IRC PING and PONG messages), but it might just sit there waiting for orders. These orders might never come; the owner of the botnet might be in jail or on a fishing trip. Another possibility is that the owner might have lost track of the botnet host or simply chooses to not use it, for some reason. For example, a botnet server might exist but be unavailable to the hacker controlling it. This might be because a communication channel to the botnet server was blocked at a router or firewall. So, don’t be surprised if a botnet host just sits there. Sometimes such hosts are passive. Sometimes they could be attacking in a subtle way. For example, the botnet software might be spyware, recording keystrokes and sending them out on some channel you don’t know about. Or the host might sit there today and join a DDoS attack tomorrow.
The ngrep tool is a nice custom sniffer that can be used to pick ASCII strings out of packet data payloads. It can be used for watching for messages from a known C&C botnet IP address. It can also be used with pattern matching since it has grep regular expressions (really, Perl Compatible Regular Expressions, or PCRE; see www.pcre.org) built into it. It can also read and write tcpdump format files. Here we will just give a few syntax examples, explain them, and then look at one example of ngrep in combat.
The overall syntax for ngrep has the form:
Here are three examples. First:
We use –q to make ngrep quiet, so it only prints out strings. The host 10.0.0.1 part is a tcpdump expression to tell it to print strings for any packets to and from that particular host. This expression format is the same for other sniffers, too, including tcpdump and WireShark (and Snort and ourmon, for that matter). Our goal is to watch traffic to and from the suspicious host in question. This might be IRC traffic or HTTP traffic or something else entirely.
In this case we want any packet with PRIVMSG or JOIN in it from two possible hosts. These both might be botnet servers. We are trying to use pattern matching to look at interesting IRC messages, and this pattern would rule out any PING or PONG messages or other types of IRC messages.
In this third example, we show how to use the Unix script command to create a log of any ngrep output. This allows you to leave the computer without worrying about interesting information scrolling off the screen. Script records all output in a file called typescript by default in the local directory. Control-D is end of file, which terminates the script session. Script can take an argument like serverip.log so that you can choose the filename for logging and avoid the default filename typescript.
So, what might we see? Given our first example, you could see something like this:
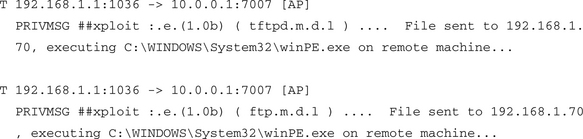
If you have any doubts about this you could always search the Internet for winPE.exe. In that case, you will find http://www.sophos.com/security/analyses/w32rbotajl.html to make for interesting reading.
Ngrep is telling us that TCP is being used (T) and that packets are going from 192.168.1.1 at port 1036 to the remote (botnet server!) 10.0.0.1 at port 7007. The channel name is #xploit and the message is rather alarming. Apparently a new system has just been exploited, and some file named win PE.exe has been downloaded to it.
Ngrep is a fine tool and can be used to watch current targets or used with previously stored tcpdump format information.
On the other hand, one might find something suspicious in a previous ourmon IRC summarization (see Table 9.3).
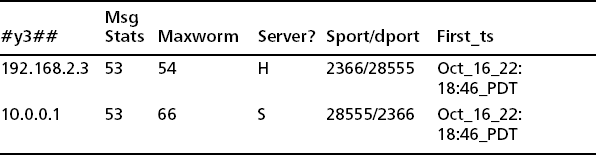
So the problem is that we have a very small IRC network with one local host and a very strange channel name. We had not seen this channel name before. The work weight is of a middle value and is not a smoking gun in terms of scanning. If the local client 192.168.2.3 had a work weight of 99, we could be more confident about scanning behavior. Assume that this channel appeared yesterday. We don’t happen to have yesterday’s packets to help us investigate what was actually going on. Here we can use the ircfr IRC flight recorder program to see what if anything might be learned about suspicious borderline channels such as this one.
The program ircfr is a sniffing tool supplied with ourmon. It is new and as a result is rather primitive. It can be found in /home/mrourmon/src/tools/ircfr. See the README in that directory for installation. The basic idea is that it captures IRC payloads (PRIVMSG or JOIN) and stores them in a few days’ worth of files. The file for yesterday is called ircfr.yesterday.txt. The file for today is called ircfr.today.txt, At midnight the file for today is moved to become the file for yesterday. Then ircfr is restarted to capture today’s output. All we really need to do is find the stored files for ircfr and use grep to pick out the channel name as follows:
The packet payload is an IRC PRIVMSG command with data. The data tells us that a piece of malware called winl0gon.exe was downloaded. So #y3## is a botnet channel.
Optimizing the System
One problem that you can have with a tool like ourmon or Snort is performance. Performance problems can occur because the system has too much load or there are many scanners, or possibly worst of all, because you are the target of a large DDOS attack. So what can be done? Of course, you could turn filters off in ourmon, or you could give Snort less signatures. In other words, you give the system less work to do. But that isn’t helping you get your job done, and it also is not very secure. With ourmon you might turn off a feature that otherwise might show an important anomaly. With Snort you might turn off a signature that would otherwise have detected the next SQL slammer attack. So in this section we will look at some ways to parallelize the ourmon system. We should point out that some of these techniques apply to sniffers in general, not just the ourmon probe.
Before we discuss our speedup efforts, first look at Figure 9.1, which shows the operating system architecture for the way packets are read by sniffing applications such as ourmon’s probe.

Traditional operating systems such as FreeBSD and Linux have approaches that differ in details but are actually pretty similar in the way packets arriving from the network are handed off to sniffing applications. The basic idea is that the NIC may interrupt (or be read by polling, ultimately driven from a hardware clock interrupt) and then some number of packets are read in and placed in operating system buffers (not shown). These buffers are then copied to a ring buffer of a certain size inside the kernel. Conceptually the ring buffer is a queue. The application can then use the read system call to read the queued packets from the ring buffer and process them. This is actually a very traditional operating system design model called the producer-consumer model. The producer is the operating system, which includes both the NIC driver as well as the ring buffer code that stuffs packets into the queue. The consumer is the ourmon probe application.
One very general problem is that for important reasons, the operating system will run before applications run; otherwise the operating system might not be able to service the applications. Here this could mean that the device driver might be so busy stuffing packets into the ring buffer that the application never gets to read any packets out of the ring buffer. This can easily happen with a single-CPU system. Interrupts can also play a harmful role. If too many packets are coming in too fast (say, with a small-packet DDOS attack), the NIC might simply lock up the entire system. The system only processes interrupts and more or less nothing else happens. This is a form of deadlock called livelock (not dead, but not doing anything useful either). Now, given the big picture, let’s turn and look at various optimization techniques.
Buy a Dual-Core CPU for the Probe
One possible approach to parallelization is rather easy these days and is becoming cheaper all the time. Both AMD and Intel now have computers with dual-core processors. Dual-core means that with a symmetric multiprocessing (SMP) operating system, you will effectively run the NIC on one CPU and the ourmon probe on the second. The outcome is that you avoid the situation where they are contending for one CPU (and the application always loses). This can help a lot and should be standard practice for anyone running an important sniffing application. If you get a dual-core CPU, make sure that the operating system is actually using SMP! It won’t do you much good if you have the hardware but forgot to enable the software.
Separate the Front End and Back End with Two Different Computers
Ourmon’s configure.pl application (which we discussed in Chapter 6) separates the installation of the front-end probe and back-end processing software. So, you can install the front end on one computer and install the back end on a different computer. As a result, by definition they will not compete for one computer. Then arrange somehow for the front end’s output files to be transferred using TCP (for reliability) to the back-end computer. We typically run a small Web server on the probe and use the well-known wget application to copy the files. You could also use Secure Shell (www.openssh.org) in batch mode with no passphrase. Our wget approach can be found in the back-end script /home/mrourmon/bin/omupdate.sh and simply needs to be commented in with a suitable IP address for the probe. It is a good idea to use an access control list on the probe to make sure that only the back-end host can access it to get the files. (It is also a good idea to make sure that no external host can talk to the probe.)
Buy a Dual-Core, Dual-CPU Motherboard
If you buy a dual CPU where each CPU is actually dual-core, SMP operating systems will think you have four CPUs. This way you can run all of ourmon on one system, both front end and back end. One hardware thread is for the NIC reading packets; one is for the probe application. A third thread will be used by Perl, which runs the back-end code, for the most part. This leaves you one NIC, possibly for running a program like ngrep, ircfr, or Snort. In the future we hope to have a threaded ourmon probe; four logical CPUs will be needed for such software.
Make the Kernel Ring Buffer Bigger
We have found in our lab that a large kernel buffer size will sometimes help reduce the number of dropped packets. This doesn’t always work, but it has worked often enough that if you have drops, this is the first thing to try. If it doesn’t work, maybe you need new hardware. First find the shell script that is used for starting ourmon and then modify the kernel buffer size parameters in it to make them bigger. You need to do this based on data gathered with the pkts filter pictured in Figure 6.1. If you see that you consistently have drops and these drops are in the thousands, that could mean that the probe is not getting to run enough and packets are piling up in the kernel buffer but not getting read out in time. So, find the ourmon.sh script used to start ourmon. For example, on FreeBSD or Linux, the ourmon startup script used to boot the probe might exist in one of the following spots (make sure you modify the one you actually use):
![]() FreeBSD/Linux /home/mrourmon/bin/ourmon.sh or /usr/local/mrourmon/bin/ourmon.sh (depending on the install directory)
FreeBSD/Linux /home/mrourmon/bin/ourmon.sh or /usr/local/mrourmon/bin/ourmon.sh (depending on the install directory)
![]() FreeBSD /usr/local/etc/rc.d/ourmon.sh (boot startup directory)
FreeBSD /usr/local/etc/rc.d/ourmon.sh (boot startup directory)
Edit the script and find the two parameters just before the ourmon probe (called ourmon) is started. This will be in the function called start_om(). For example, on a FreeBSD 5.X system, you might see the following:
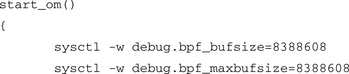
On both Linux and FreeBSD, two sysctl command calls are used to set the size of the kernel buffer. Stop ourmon, modify the two calls, and then restart ourmon. Here we want to change both instances of 8388608 to twice as big, say, 16777216. What you have done is increase the size of the kernel buffer from 8 megabytes to 16 megabytes. Don’t be shy about the size here. Sixteen megabytes in a modern computer is nothing in terms of size. See if this change has a positive effect on the drops; sometimes it will prove effective, but sometimes you simply don’t have enough CPU horsepower.
Reduce Interrupts
If a DDoS attack shows up, your ourmon or Snort probe might be having a bad day at the office. Most modern NICs will not turn one packet into one interrupt. But remember that with a 1Gbit NIC, you can potentially get roughly 1.5 million small packets per second. Therefore, your host operating system could lock up processing interrupts and nothing will get done. On Linux it is likely that no operator actions are needed due to the kernel’s new API (NAPI) architecture for network device drivers. NAPI was designed to mitigate the livelock problem we mentioned previously. On the other hand, with 6.X FreeBSD systems, device polling might be turned on in the operating system and used with drivers that support it. The basic idea behind device polling is that a particular device driver will no longer interrupt. Instead, clock interrupts will cause the operating system itself to poll the device for packets. Although we aren’t going to explain BSD kernel configuration here (one good place to start to learn about that is to look at the supplied BSD documentation with a Web browser), the rough idea is as follows:
1. Configure the kernel by turning on device polling, and set the HZ rate to 1k or 2k. The latter is better for high rates of packets.
2. Once the kernel is reinstalled and rebooted, turn on the polling option for the device. For example, if we have an Intel gigabit card and the NIC’s interface name is em, the following will turn polling on:
The result here might look something like Figure 6.2 in Chapter 6. Without polling, the probe could not have captured this spike.
Summary
In this chapter we looked at various techniques that either help the analyst reduce “the fog of war” or help make the ourmon system more efficient. Efficiency might be needed in the face of attack or because the system is doing too much work for the local computer platform. Techniques that help with analysis include the trigger mechanism, which helps us automatically dump interesting packets to a tcpdump-style file, as well as the associated event logging that goes with it. Event logging gives us trigger-on and -off messages and can include important ourmon system events. We also looked at analysis of data files in the Web directory or the log directories. The logs are not online, but they are used for some of the Web-based summarizations. In addition, they can be searched and at times can provide important clues about borderline behavior. Finally, we looked at various optimization techniques. Most of these techniques are aimed at improving the performance or robustness of the front-end probe. If we make the probe faster, we can make it do more work. Hopefully we can also make it more robust in the face of large-scale DoS attacks.
Solutions Fast Track
Automated Packet Capture
![]() Ourmon has an automated packet-capture feature that allows packet capture during certain types of anomalous events.
Ourmon has an automated packet-capture feature that allows packet capture during certain types of anomalous events.
![]() Automated packet capture is turned on in the probe config file. In general, you must create a dump directory and specify a threshold number and packet count for each trigger you use.
Automated packet capture is turned on in the probe config file. In general, you must create a dump directory and specify a threshold number and packet count for each trigger you use.
![]() Trigger-on and -off events are logged in the ourmon event file, which you can find from the main Web page (both at top and bottom).
Trigger-on and -off events are logged in the ourmon event file, which you can find from the main Web page (both at top and bottom).
![]() Triggers of interest for anomaly detection include the trigger_worm trigger, the UDP work weight trigger, and the drops trigger.
Triggers of interest for anomaly detection include the trigger_worm trigger, the UDP work weight trigger, and the drops trigger.
![]() The trigger_worm trigger is used to capture packets when the supplied threshold of scanning IP hosts is exceeded.
The trigger_worm trigger is used to capture packets when the supplied threshold of scanning IP hosts is exceeded.
![]() The UDP work weight trigger is used for capturing packets when the supplied threshold (a UDP work weight) is exceeded. Packets are captured per host.
The UDP work weight trigger is used for capturing packets when the supplied threshold (a UDP work weight) is exceeded. Packets are captured per host.
![]() The drops trigger is used to capture packets when a supplied dropped packet threshold is exceeded. This trigger has a poor signal-to-noise ratio and is more likely to succeed if most packets are DoS attack packets. However, the probe system itself might fail under these circumstances.
The drops trigger is used to capture packets when a supplied dropped packet threshold is exceeded. This trigger has a poor signal-to-noise ratio and is more likely to succeed if most packets are DoS attack packets. However, the probe system itself might fail under these circumstances.
![]() Captured packets can be viewed with a sniffer such as tcpdump or WireShark.
Captured packets can be viewed with a sniffer such as tcpdump or WireShark.
Ourmon Event Log
![]() The event log records both probe and back-end events of interest. The goal of the event log is to store significant security-related events as well as important ourmon system events.
The event log records both probe and back-end events of interest. The goal of the event log is to store significant security-related events as well as important ourmon system events.
![]() Note that the event log stores both bot client mesh detection and bot server detection events.
Note that the event log stores both bot client mesh detection and bot server detection events.
![]() The event log is rolled over at midnight to become the previous day’s event log. Event logs for roughly a week are kept by the system and made available at the bottom of the main Web page.
The event log is rolled over at midnight to become the previous day’s event log. Event logs for roughly a week are kept by the system and made available at the bottom of the main Web page.
Tricks for Searching the Ourmon Logs
![]() Log information in ourmon exists in two directories: the Web directory on the back-end graphics system or the log directory. Depending on installation path, the Web directory might be /home/mrourmon/web.pages, and the logging directory might be /home/mrourmon/logs.
Log information in ourmon exists in two directories: the Web directory on the back-end graphics system or the log directory. Depending on installation path, the Web directory might be /home/mrourmon/web.pages, and the logging directory might be /home/mrourmon/logs.
![]() In the Web directory, IRC summarizations are stored in ircreport_today.txt (today) and ircreport.0.txt (yesterday), ircreport.1.txt (day before yesterday), and so on.
In the Web directory, IRC summarizations are stored in ircreport_today.txt (today) and ircreport.0.txt (yesterday), ircreport.1.txt (day before yesterday), and so on.
![]() In the Web directory, syndump (all local host) TCP work weight information is stored in syndump.daily.txt (today), syndump.0.txt (yesterday), and so on.
In the Web directory, syndump (all local host) TCP work weight information is stored in syndump.daily.txt (today), syndump.0.txt (yesterday), and so on.
![]() In the Web directory, normal TCP work weight information is stored in wormsum.all_daily.txt, wormsum.all.0.txt, and so on.
In the Web directory, normal TCP work weight information is stored in wormsum.all_daily.txt, wormsum.all.0.txt, and so on.
![]() TCP work weight summarization files and IRC files can be searched with grep.
TCP work weight summarization files and IRC files can be searched with grep.
![]() TCP work weight summarization files currently have four lines per IP address, so grep –A 4 could be very useful.
TCP work weight summarization files currently have four lines per IP address, so grep –A 4 could be very useful.
![]() Searching the TCP port report logs (or the UDP port report logs) found in /home/mrourmon/logs/portreport (TCP) or /home/mrourmon/logs/udpreport (UDP) with find and grep can show behavior of an attacking system over time.
Searching the TCP port report logs (or the UDP port report logs) found in /home/mrourmon/logs/portreport (TCP) or /home/mrourmon/logs/udpreport (UDP) with find and grep can show behavior of an attacking system over time.
![]() Searching the TCP port report log with find, wc, and sort can easily find the biggest file of the day. This file can often be correlated with peaks in the RRDTOOL worm graph.
Searching the TCP port report log with find, wc, and sort can easily find the biggest file of the day. This file can often be correlated with peaks in the RRDTOOL worm graph.
Sniffing IRC Messages
![]() Ngrep is a sniffer designed to search for string patterns, primarily in Layer 7 payloads.
Ngrep is a sniffer designed to search for string patterns, primarily in Layer 7 payloads.
![]() It can often be used to look at IRC traffic to and from suspicious IP hosts.
It can often be used to look at IRC traffic to and from suspicious IP hosts.
![]() Ourmon also includes an additional sniffer called the IRC Flight Recorder (ircfr) that can be used to log all IRC data. This allows the security engineer to look up suspicious IRC hosts or channels in border-line anomaly detection cases to determine whether the host or channel is benign or evil.
Ourmon also includes an additional sniffer called the IRC Flight Recorder (ircfr) that can be used to log all IRC data. This allows the security engineer to look up suspicious IRC hosts or channels in border-line anomaly detection cases to determine whether the host or channel is benign or evil.
Optimizing the System
![]() Ourmon and other systems (like Snort) rely on packet sniffing, which is modeled in conventional operating system theory as the consumer-producer problem. The operating system produces packets and shoves them in an OS queue, and the application (the ourmon probe) reads them out and finally processes them.
Ourmon and other systems (like Snort) rely on packet sniffing, which is modeled in conventional operating system theory as the consumer-producer problem. The operating system produces packets and shoves them in an OS queue, and the application (the ourmon probe) reads them out and finally processes them.
![]() High packet rates can lead to problems due to the operating system side either not allowing the application to run or livelocking due to too many interrupts.
High packet rates can lead to problems due to the operating system side either not allowing the application to run or livelocking due to too many interrupts.
![]() One performance improvement is to use a dual-core CPU, which gives one CPU for interrupts and one for application processing under an SMP operating system.
One performance improvement is to use a dual-core CPU, which gives one CPU for interrupts and one for application processing under an SMP operating system.
![]() Dual-core, dual-CPU systems can allow all of ourmon to run efficiently on one CPU.
Dual-core, dual-CPU systems can allow all of ourmon to run efficiently on one CPU.
![]() If packets are being dropped, it might help to make the operating system queue bigger.
If packets are being dropped, it might help to make the operating system queue bigger.
![]() If packets are being dropped, it might help on FreeBSD to try polled I/O in the NIC driver.
If packets are being dropped, it might help on FreeBSD to try polled I/O in the NIC driver.
The following Frequently Asked Questions, answered by the authors of this book, are designed to both measure your understanding of the concepts presented in this chapter and to assist you with real-life implementation of these concepts. To have your questions about this chapter answered by the author, browse to www.syngress.com/solutions and click on the “Ask the Author” form.
Q: Is Linux or FreeBSD better for a probe?
A: This is a good question. There are some tradeoffs here. For example, with Linux there are more people working on more network device drivers or supporting them than for FreeBSD. On the other hand, the basic subsystem for getting packets out of the kernel is better with FreeBSD than with Linux. (We have measured this in our lab at PSU with a high-speed packet generator.) Phil Wood at http://public.lanl.gov/cpw has a libpcap variation for Linux that pairs libpcap changes with the Linux kernel supplied memory-mapped ring buffer for packet sniffing, and this system (libpcap+kernel) substantially improves Linux performance. We use FreeBSD with Intel NICs and insist on at least a dual-core CPU. At this time, we recommend FreeBSD.
Q: Besides interrupts, are there other possible sources of packet loss?
A: Packet loss during a DDoS attack is a difficult problem with multiple facets. We have discovered that some NICs might simply lose packets if too many small packets are arriving at the port. On both BSD and Linux, the netstat –in command might show possible input errors and should be used to check your NIC to see if it has large amounts of errors. Unfortunately, we can’t recommend anything useful here other than to try another kind of NIC.