
Chapter 7 Ourmon: Anomaly Detection Tools
Introduction
Before we turn to the higher-level IRC tools in the next chapter, we need to first discuss a set of fundamental anomaly detection tools available in ourmon. These are TCP, UDP, and e-mail tools. In this chapter we first discuss how ourmon’s Web-based user interface works and then give a little theory about anomaly detection. As a result you will both understand the technical background and also be able to find the important anomaly detection parts of the ourmon user interface.
There are several reasons for studying anomaly detection tools before we look at the IRC botnet detection system in the next chapter. For one thing, the IRC botnet detection system uses the TCP port report that we present in this chapter. Another simple reason is that anomaly detection might detect an infected system that is not part of a botnet. Finally, many botnets currently use IRC for communication, but there is no guarantee now or in the future that a botnet will use IRC as a control channel. They could use other protocols, such as HyperText Transfer Protocol (HTTP), or simply wrap IRC with encryption.
The TCP and UDP port reports give us details about scanners that are typically scanning for TCP- or UDP-based exploits at various port numbers. Scanning could be due to the use of manual tools such as the famous nmap tool (www.nmap.org) or due to various forms of automated malware, including botnets. Our TCP tool of choice, called the TCP port report, has an associated graph called the worm graph that we saw in the previous chapter. The TCP port report is a fundamental and very useful tool; understanding what it has to say helps you detect scanners of various types. It actually comes in several flavors—the basic TCP port report and several variations on that report called the p2p port report, the syndump port report, and the e-mail port report. We treat e-mail as a separate category from TCP simply because botnets may generate spam, and spam detection is very important in network security.
The UDP port report is somewhat similar to the TCP port report and also has an associated graph called the UDP weight graph that shows the intensity and time of large UDP packet scans. In its case we have rarely seen botnet attacks that use UDP, although they do occur. Most use TCP, but we will look at UDP anyway, just in case.
Before we delve into these topics, let’s take a brief tour of the ourmon Web interface. This will help you find the TCP and UDP port reports and associated tools in the future as well as find important bits of information, such as the ourmon help page.
The Ourmon Web Interface
Figure 7.1 shows the top of the main ourmon Web page (index.html) that is supplied by the configuration process. Here there are three HTML tables (tables of hypertext links) that provide different ways to get around the ourmon interface. At the top we have a single line of hypertext links that we can call the ourmon global directory. Underneath it we find the largest link table, called important security and availablility reports/web pages. We will spend most of our time with this table. The last table is called main page sections. It simply breaks up the main page into subsections and allows you to jump to any subsection in the main page.
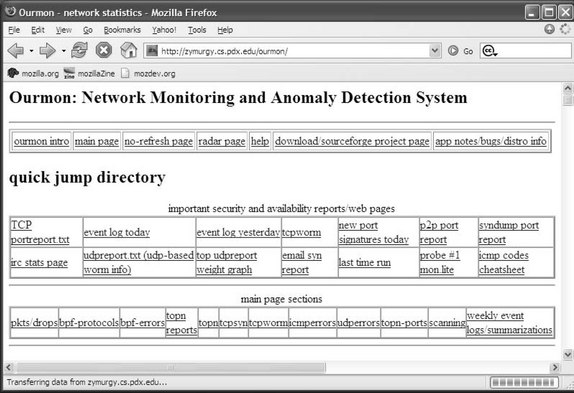
In the top table, the most important link is the help link, which takes you to the ourmon help page (called info.html). The help page was installed locally as part of the configuration process. The help page (not shown here) in turn has a table of contents that attempts to spell out all details about a particular part of ourmon, including configuration and data interpretation. For example, if you want to take a look at more details concerning the packets filter mentioned in “Case History #1: DDOS” in the previous chapter, you can jump to help either in the packets filter section of the main page (see Figure 7.2) or from the table of contents in the help page.
Another important link in the top table is the no-refresh page link. By default, the index.html main page is updated every 30 seconds. The no-refresh page is a copy of the main page that is not updated every 30 seconds. On that page, you must use a Web browser to refresh the main page yourself. Several of those links take you to places like the Sourceforge pages for ourmon so that you can check for updates, but we won’t say more about that here. You can explore those links on your own.
The second jump table is called important security and availability reports/web pages. It is probably the most important of the three main tables at the top of the main page. You would normally use to it find the sections of ourmon we will talk about in this chapter and in the next few chapters. The idea of this table is to determine the sections that are important for security. Regarding the third and last table, called main page sections, we will only talk about the summarization section, which is called weekly event logs/summarizations in the first two figures.
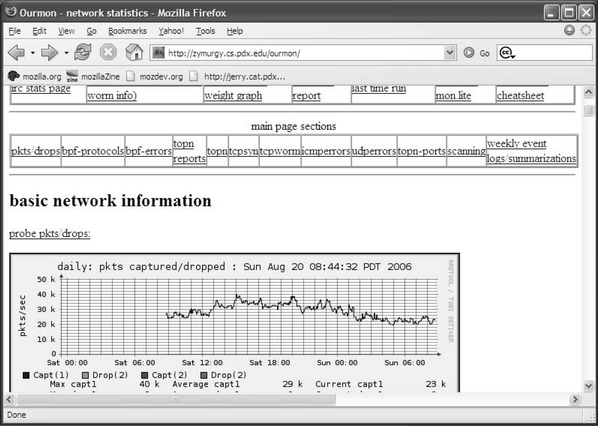
In Figure 7.2 we have moved down the main page a bit and are looking at the current RRDTOOL graph for the packets filter. The packets filter is the first real data on the main page. Here there are two important things to notice. Note how probe pkts/drop: is underlined. Also note how the entire RRDTOOL current time graph is also outlined. Both of these are hypertext links. The probe pkts/drop link takes you directly to the help page, where you can get more information about the packets filter. Thus the help system is available on the main page of ourmon by major data subsection and can be used to more easily navigate to specific information about the system.
The RRDTOOL link takes you to a second-level page that has all the RRDTOOL graphs (daily, weekly, monthly, and yearly) associated with the packets filter. In general, data links on the main page for data will take you to a secondary data page that is concerned with a particular subject (such as the TCP port report, IRC stats, or the packets filter). Main page data graphs typically show the most current information. Older or more complete information (previous days or weeks) is shown on secondary pages.
The links shown in Table 7.1 from the security table are all important security-related links, and we will touch on them all to some extent in this book. In the previous chapter we talked about ourmon cycle-times, including the 30-second view and daily summarizations. With the exception of the event log, which logs any events the system believes to be interesting, most of the links above give the 30-second view of the statistics. RRDTOOL charts on the main page contain both 30-second and daily views so they have a little history, but of course they were updated for the last 30 seconds as well. The one exception is the IRC report section, which has a 30-second report, all RRDTOOL stats, and the very important IRC daily and weekly summarizations. Note that all the IRC information is in one place on the IRC page.
Table 7.1 Important Links in the Security Table
| Link Name | Content | Chapter |
|---|---|---|
| TCP port report.txt | TCP port report: Work weight only used as filter | Chapter 7 |
| Event log today | Important system events so far today | Chapter 9 |
| Event log yesterday | Important system events, previous day | Chapter 9 |
| TCP worm (graph) | RRDTOOL worm graph | Chapter 7 |
| Syndump port report | TCP port report for all home IP addresses | Chapter 7 |
| IRC stats report | All IRC data, RRDTOOL, and reports, including IRC summarizations | Chapter 8 |
| Udp port report.txt | Current UDP port report | Chapter 7 |
| Top udpreport weight graph | RRDTOOL UDP top N graph; top UDP work weight outbursts | Chapter 7 |
| E-mail syn report | Current e-mail version of TCP port report | Chapter 7 |
On the other hand, if you use the last link on the main page sections table, you go to the bottom of the main page, as shown in Figure 7.3. Here you see daily and weekly summarizations for the various TCP port reports and the event log. These represent daily average statistics for the various kinds of TCP port reports. Such summarizations have a different format than the 30-second formats because a lot of the statistics are averages and some statistics are judged more important than others or simply don’t make sense in a 30-second view. In Table 7.2, we list the summarizations provided at the bottom of the main Web page. We will see a few examples of real data for some of these summarizations. There is no UDP port report summarization at this point.
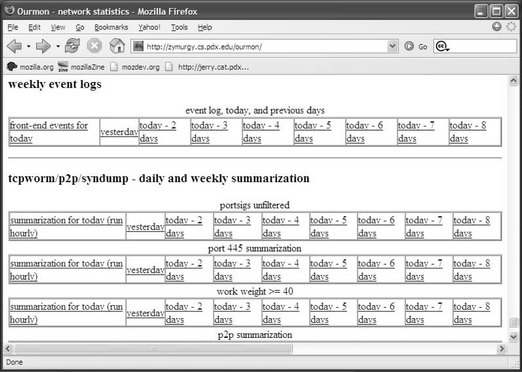
Table 7.2 Ourmon Daily Summarizations
| Summarization Type | Content: One Week’s Worth | Chapter |
|---|---|---|
| Event log | Event logs | Chapter 9 |
| Portsigs unfiltered | TCP port report filtered by nonzero TCP work weight | Chapter 7 |
| Port 445 summarization | TCP port report filtered to port 445 only | Chapter 7 |
| Work weight >= 40 | TCP port report filtered to hosts with TCP work weight >= 40 | Chapter 7 |
| P2P summarization | TCP port report filtered to hosts recognized using various P2P signatures | Chapter 7 |
| Syndump summarization | Local IP TCP port report | Chapter 7 |
| E-mail syn summarization | Hosts sending e-mail SYN packets | Chapter 7 |
We will explain at length about the TCP and UDP work weights in a moment. For now you need only understand that they are measures of efficiency in terms of packets sent by a particular IP host (IP address). Scanners or boxes intent on performing a DOS attack have a tendency to be inefficient.
In Figure 7.3, one important thing to notice about the summarization links is how they are organized in terms of time. The daily summarization is first on the left side. It is updated hourly (say, 10:00 A.M., 11:00 A.M., etc.) on the current day. The next link to that going from left to right is for yesterday; the next link after that is for two days ago. Thus daily links are rolled over at midnight to the next day. Today becomes yesterday. Roughly at the end of the week, the oldest day is lost.
Essentially, barring the IRC data itself, the most important data formats to understand are the 30-second and hourly TCP port report summarization. Even the E-mail summarization format is based on the TCP port report formats. The UDP port report is similar to the TCP port report and only has a 30-second version at this time.
A Little Theory
Before we plunge in, we need to discuss some basic principles of anomaly detection. When we talk about classical mechanisms for intrusion detection, we might distinguish signature detection from anomaly-based tools. For example, if you look at the popular Snort system (www.snort.org), Snort can take patterns expressed in ASCII or hex and apply these patterns on a per-packet basis. Thus it can tell you that a particular packet has the SQL slammer worm in its data payload. We say that is an example of signature detection (although Snort has forms of anomaly detection, too). It is fair to say that signature-based tools are useful because they can detect single-packet attacks and they can alert you to reoccurrences of previously seen attacks. From the hacker point of view, if an attack works, it will be used again, and some attacks are very popular. On the other hand, signature detection does not detect new attacks (often called zero-day attacks) and might not necessarily give you the big picture for an attack. For example, you might not be told that an attack is parallel or how large it is in terms of the number of systems or the number of packets involved.
Note that anomaly detection tools are only useful if you have a feeling for what is normal. We use anomaly detection in detecting new attacks because we do not have to have previous knowledge about any particular attack. From the negative point of view, anomaly detection might not tell us exactly what was going on with an attack. Snort can clearly come along and say “SQL-slammer,” and as a result we at least know what one packet was trying to do. (Of course, a given Snort signature could be wrong or out of date.) Anomaly detection might only make it obvious that there is apparently an anomaly! ”Pssst! Something is wrong (but I won’t tell you what).” As a result you might have to do quite a bit of analytical work to come up with a satisfactory answer, assuming you can find the answer. One of ourmon’s large pluses as an anomaly detection tool is that either its reports or its graphics often give you some idea of the scale of an attack. For example, in the previous chapter we could get a feeling for how large all the attacks were based on the RRDTOOL graphs.
We feel that in some way looking for large anomalies makes sense simply because of what we might call the hacker rule of economy.
The Hacker Rule of Economy
Small attacks don’t pay. A hacker sending spam wants to send a lot of spam. A botnet client scanning for hosts to increase the botnet mesh size wants to scan and exploit a lot of hosts. Otherwise the rate of return is too low. The hacker won’t get enough money from the spam or enough hosts for the botnet. Another economic measure is that using a lot of bots results in an attractive network that might be sold to others. It is also more resistant simply because any bot client can become a bot server. If the human owner of the botnet has many clients, it is less important if one is lost and removed from the mesh.
This is why ourmon looks for anomalies in the large and tries to point out parallelism and give the user some sense of scale in an attack. Ourmon won’t tell you about a single SQL slammer packet. That isn’t a design goal for ourmon. Snort, on the other hand, can tell you about a single SQL slammer packet because detecting individual packet threats is a design goal.
We need one more definition before we go on. In intrusion detection, the terms false positive and false negative are used. A false positive is an event that the system reported that appears bad and in point of fact is benign. Too many false positives can cause an analyst to lose interest. A false negative is worse. In that case the system reports that something is okay (or doesn’t report anything) and in point of fact the event is bad. Not reporting that the wolf is in the house and is wearing grandma’s dress is bad, so false negatives are very bad indeed. On the other hand, systems and analysts using the system have limits. Too many false positives can wear an analyst out to the point that he or she doesn’t pay attention any more. As a result, a family of wolves in the house could be ignored.
TCP Anomaly Detection
In this section we are going to look at the most important tool in ourmon’s arsenal of anomaly detection tools. This is the TCP port report in several forms and formats. First we look at the basic 30-second ASCII TCP port report. The port report is useful for detecting scanning and P2P activity. Second we look at the TCP work weight, which is a statistical measure that is mostly used to detect scanning. The TCP work weight is a fundamental background component for all TCP-based anomaly detection, including the IRC botnet detection mechanism discussed in the next chapter. Our final two sections discuss the TCP worm graph, which shows parallel scanning activity, and the hourly summarized form of the TCP port report. There are a number of forms of the summarized TCP port report that may be sorted on different statistics (for example, TCP SYN counts). All these hourly summarized reports basically have the same statistical format per individual IP host. Thus understanding the format of the 30-second port report and the summarized format is very important for understanding the data provided by ourmon.
TCP Port Report: Thirty-Second View
Table 7.3 is a somewhat simplified TCP port report taken from PSU’s network on the day of “Case History #3: Bot Client.” This report shows a number of typical events in the base TCP port report, including two local attacking systems, several remote attacking systems, and a few systems that are not attackers. Also, to protect the innocent (or the guilty), we use private IP addresses here. For remote hosts we will use net 10 addresses, and for local networks we will use net 192.168 addresses. Normally, of course, these could be real IP addresses. Due to space issues we do not show all the fields in the TCP port report and might not show all the port signature field (the last column) when there are more than a few destination ports. We will just show *** to mean that there are more.
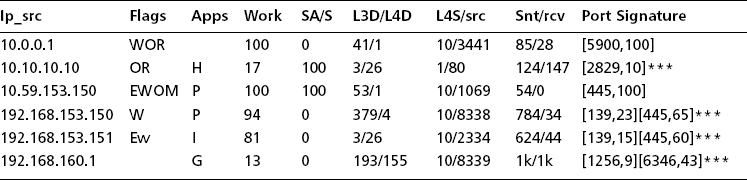
So, before we talk about the individual IP hosts in this report, let’s go through the columns and explain what the individual fields mean. In our explanation, we will include some columns not shown in the table due to space limitations. However, first notice a couple of important things. The fundamental object in the TCP port report is an IP host address and its associated statistics. This is because we want to know if a host has been compromised. We don’t care necessarily about its individual conversations with other TCP hosts. In particular, the 30-second version of the TCP port report is sorted by ascending IP address. The reason for this is that sometimes you might get a hint that a set of hosts on an IP subnet have all been compromised. If that is the case, they will appear next to each other line by line in the report (note 192.168.153.150 and 192.168.153.151 in Table 7.3). Another sorting tactic concerns the far-right column, called the port signature. Here we are looking at a sampled set of 1 to maximum 10 TCP destination ports. Ourmon samples 1–10 maximum destination ports for the host during the 30-second period. This particular column is so important that it is called a port report. Note how the port signatures for 192.168.153.150 and 192.168.153.151 match; this isn’t an accident. They are running the same malware that is currently performing the same scan on both hosts.
IP Address Source Spoofing
Regarding sorting by ascending IP address, once in a while if you are unlucky you might get to see something like 254 ascending IP addresses from the same IP subnet. A few years ago, a host on a PSU subnet was infected with the agobot worm, and all of a sudden it looked like 254 PSU IP hosts on the same /24 (256 IPs) subnet were transmitting at the same time. They all showed up as “scanners” in the TCP port report. It was really only one host spoofing other IP addresses on the same subnet. Agobot has a loop mechanism to spoof IP source addresses so that packets are sent in a loop, with each packet having a different but local IP address. So remember, if you see many contiguous IP addresses that appear to come from the same IP subnet, it might actually only be one IP address using IP address source spoofing. On the other hand, a handful of IPs from the same subnet that are really different could indicate that the local network itself was fertile ground for hackers.
Now let’s go through the column headings:
![]() IP source address The statistics are organized around an individual IP address and are sorted in ascending order based on IP address. This means that your home address network will be grouped together somewhere in the report.
IP source address The statistics are organized around an individual IP address and are sorted in ascending order based on IP address. This means that your home address network will be grouped together somewhere in the report.
![]() Flags The flags are E, W, w, O, R, and M, respectively. They are a heuristic judgment based on whether traffic from this host is deemed one-way or whether there is two-way traffic. Scanners are typically one-way (host to destination). E means ICMP errors are being sent back. W means the TCP work weight is very high (>=90). w means the work weight is >= 50. O means FINS (TCP control packet, meaning end of conversation) are not being returned. R means TCP RESET (TCP control packets are being returned). RESETS means the other end thinks you made an error; these are typically returned by TCP when no service port is open. M means few if any data packets are being returned. Scanners may typically get W, WOM, or something similar. If the system in question is really misbehaving, you might get EWORM.
Flags The flags are E, W, w, O, R, and M, respectively. They are a heuristic judgment based on whether traffic from this host is deemed one-way or whether there is two-way traffic. Scanners are typically one-way (host to destination). E means ICMP errors are being sent back. W means the TCP work weight is very high (>=90). w means the work weight is >= 50. O means FINS (TCP control packet, meaning end of conversation) are not being returned. R means TCP RESET (TCP control packets are being returned). RESETS means the other end thinks you made an error; these are typically returned by TCP when no service port is open. M means few if any data packets are being returned. Scanners may typically get W, WOM, or something similar. If the system in question is really misbehaving, you might get EWORM.
![]() Apps The application flags field uses a set of letters to convey various hints about data seen coming from the host. We call these letters flags or tags. There are hardwired (reserved) flags as well as user-programmable flags that match Unix-style regular expressions put in the ourmon probe configuration. The user-programmable flags use pattern matching via the Perl Compatible Regular Expression (PCRE) system. The goal of the apps flag system overall is to indicate something interesting about traffic from a host. In particular, we might be able to suggest that a particular kind of traffic was seen. We use the apps flag field to help explain why certain classes of hosts will end up in the TCP port report over and over again. Sometimes Web servers or hosts employing peer-to-peer protocols such as BitTorrent or Gnutella will appear. These systems may be considered false positives unless your local policy forbids peer-to-peer applications. We will talk about this phenomenon more later in this chapter. Hardwired application flags include:
Apps The application flags field uses a set of letters to convey various hints about data seen coming from the host. We call these letters flags or tags. There are hardwired (reserved) flags as well as user-programmable flags that match Unix-style regular expressions put in the ourmon probe configuration. The user-programmable flags use pattern matching via the Perl Compatible Regular Expression (PCRE) system. The goal of the apps flag system overall is to indicate something interesting about traffic from a host. In particular, we might be able to suggest that a particular kind of traffic was seen. We use the apps flag field to help explain why certain classes of hosts will end up in the TCP port report over and over again. Sometimes Web servers or hosts employing peer-to-peer protocols such as BitTorrent or Gnutella will appear. These systems may be considered false positives unless your local policy forbids peer-to-peer applications. We will talk about this phenomenon more later in this chapter. Hardwired application flags include:
![]() work This is short for the TCP work weight. We will talk more later about the TCP work weight because it is very important. It varies from 0 to 100 percent, and a high value means the host is sending all control packets. This is often the case with a scanner. For example, SYN packets used by clients to open a TCP conversation or SYN+ACK packets used by servers as a response to a normal SYN from a client are examples of control packets. So are FIN and RESET packets. A 100-percent value means the host is only sending control packets. TCP usually has some control packets and some data packets in a balance or preferably with more data packets than control packets. In summary, the work weight is a measure of control versus data efficiency. Low values, including 0 percent, are common, even with hosts using P2P protocols like BitTorrent. An FTP client transferring a large file would typically have a value of zero.
work This is short for the TCP work weight. We will talk more later about the TCP work weight because it is very important. It varies from 0 to 100 percent, and a high value means the host is sending all control packets. This is often the case with a scanner. For example, SYN packets used by clients to open a TCP conversation or SYN+ACK packets used by servers as a response to a normal SYN from a client are examples of control packets. So are FIN and RESET packets. A 100-percent value means the host is only sending control packets. TCP usually has some control packets and some data packets in a balance or preferably with more data packets than control packets. In summary, the work weight is a measure of control versus data efficiency. Low values, including 0 percent, are common, even with hosts using P2P protocols like BitTorrent. An FTP client transferring a large file would typically have a value of zero.
![]() SA/S SA/S stands for SYN+ACK packets divided by SYN packets. Like the TCP work weight, SA/S is expressed as a percentage, from 0 to 100 percent. The basic idea is that during the 30-second sample period, the number of SYN+ACK flag packets sent by the IP host is divided by the number of SYN packets. A value of 100 percent or high suggests that the host might be a server. A value of 0 on the other hand suggests (only suggests and does not prove; after all, these things are spoofable) the host is a client. Often P2P hosts will have a value somewhere between 0 and 100 percent. Your average bot could have a 0 value. A Web server, on the other hand, typically has a high value. In summary, you can view this as a suggestion as to whether or not a host is mostly a client or a server or a little bit of both.
SA/S SA/S stands for SYN+ACK packets divided by SYN packets. Like the TCP work weight, SA/S is expressed as a percentage, from 0 to 100 percent. The basic idea is that during the 30-second sample period, the number of SYN+ACK flag packets sent by the IP host is divided by the number of SYN packets. A value of 100 percent or high suggests that the host might be a server. A value of 0 on the other hand suggests (only suggests and does not prove; after all, these things are spoofable) the host is a client. Often P2P hosts will have a value somewhere between 0 and 100 percent. Your average bot could have a 0 value. A Web server, on the other hand, typically has a high value. In summary, you can view this as a suggestion as to whether or not a host is mostly a client or a server or a little bit of both.
![]() L3D/L4D L3D/L4D stands for Layer-3 destinations and Layer-4 destinations. This really means the number of unique IP destination addresses and the number of unique TCP destination port addresses seen in packets sent by the IP host during the sample period. A larger number for L3D suggests the host has a lot of fan-out in terms of peer hosts it is trying to converse with (or attack). Scanners sometimes try to talk to a lot of IP hosts to find one with an open destination port. Or in some cases they might talk to one host and try all its TCP destination ports to look for any open port. In that case, the Layer-3 destination value would be 1 and the Layer-4 destination value will be high. Your typical botnet client has a limited set of attacks (let’s say five) and as a result it will scan many IP hosts but only a few ports, because its attacks are limited to certain ports like the Microsoft classic attack destination ports 139 and 445.
L3D/L4D L3D/L4D stands for Layer-3 destinations and Layer-4 destinations. This really means the number of unique IP destination addresses and the number of unique TCP destination port addresses seen in packets sent by the IP host during the sample period. A larger number for L3D suggests the host has a lot of fan-out in terms of peer hosts it is trying to converse with (or attack). Scanners sometimes try to talk to a lot of IP hosts to find one with an open destination port. Or in some cases they might talk to one host and try all its TCP destination ports to look for any open port. In that case, the Layer-3 destination value would be 1 and the Layer-4 destination value will be high. Your typical botnet client has a limited set of attacks (let’s say five) and as a result it will scan many IP hosts but only a few ports, because its attacks are limited to certain ports like the Microsoft classic attack destination ports 139 and 445.
![]() L4S/src This statistic stands for L4 TCP source port information. Ourmon samples both TCP source and destination ports. Destination port information is provided in the port signature field, which we discuss in more detail later. L4S/src, on the contrary, is focused only on source ports associated with the IP host. In this case, during one 30-second sample period the probe stores the first 10 source ports it sees up to a maximum of 10 and counts packets sent to those stored ports. Most of the sampled information is not shown. For L4S the system only gives us the number of src ports seen ranging from 1 to a maximum of 10 (take 10 to mean “many”). The src field itself simply gives us the first sampled source port number. The goal is to provide a few clues about source ports but less information than about destination ports. This information isn’t always useful. However, look at the IP address 10.10.10.10 in Table 7.3. In its case we see that it had one source port in use, and that was port 80. That is a hint that said system is running a Web server (or something) at port 80. A value of 10 typically means that a system is multithreaded and has multiple ports open for sending packets. This is typical of Web clients, peer-to-peer clients, and some kinds of malware where multiple threads are used for scanning.
L4S/src This statistic stands for L4 TCP source port information. Ourmon samples both TCP source and destination ports. Destination port information is provided in the port signature field, which we discuss in more detail later. L4S/src, on the contrary, is focused only on source ports associated with the IP host. In this case, during one 30-second sample period the probe stores the first 10 source ports it sees up to a maximum of 10 and counts packets sent to those stored ports. Most of the sampled information is not shown. For L4S the system only gives us the number of src ports seen ranging from 1 to a maximum of 10 (take 10 to mean “many”). The src field itself simply gives us the first sampled source port number. The goal is to provide a few clues about source ports but less information than about destination ports. This information isn’t always useful. However, look at the IP address 10.10.10.10 in Table 7.3. In its case we see that it had one source port in use, and that was port 80. That is a hint that said system is running a Web server (or something) at port 80. A value of 10 typically means that a system is multithreaded and has multiple ports open for sending packets. This is typical of Web clients, peer-to-peer clients, and some kinds of malware where multiple threads are used for scanning.
![]() ip dst Due to space limitations, this field is not pictured in Table 7.3. Ourmon samples one IP destination address in TCP packets sent from the host in question. Why? Because sometimes one host is the target of many remote attacking hosts, and this will let you see that particular phenomenon. Often this field is not useful, but sometimes with some kinds of attacks it could be highly useful indeed.
ip dst Due to space limitations, this field is not pictured in Table 7.3. Ourmon samples one IP destination address in TCP packets sent from the host in question. Why? Because sometimes one host is the target of many remote attacking hosts, and this will let you see that particular phenomenon. Often this field is not useful, but sometimes with some kinds of attacks it could be highly useful indeed.
![]() snt/rcv These are counts of all TCP packets sent and received by the host during the sample period. Note how with 10.59.153.150 in Table 7.3, packets are only sent and not received. This is another clue that the host in question is a scanner.
snt/rcv These are counts of all TCP packets sent and received by the host during the sample period. Note how with 10.59.153.150 in Table 7.3, packets are only sent and not received. This is another clue that the host in question is a scanner.
![]() sdst/total This field is also not shown due to space limitations. The sdst count gives the total number of packets captured in port signature sampled ports. The total count gives the total number of TCP sent by the IP host. Taken together, they give some idea of how well the sampled destination ports in the port signature caught packets sent by the host. If sdst/total is a low number, that means the IP host was sending packets to many ports.
sdst/total This field is also not shown due to space limitations. The sdst count gives the total number of packets captured in port signature sampled ports. The total count gives the total number of TCP sent by the IP host. Taken together, they give some idea of how well the sampled destination ports in the port signature caught packets sent by the host. If sdst/total is a low number, that means the IP host was sending packets to many ports.
![]() port signatures Ourmon samples 10 destination ports in packets sent by the host and counts packets associated with those ports. The reason for doing this is that some types of scanners (typically malware of various forms, including botnet malware) will have a fixed set of attacks and will send packets only to a certain limited set of ports. For example, bots of the past have targeted Microsoft file share ports like 139 and 445 for many kinds of exploits. In the 30-second port report, this information is presented as a sorted list of ascending ports. Each port is also paired with a frequency count. For example, if you had a host that was sending half its packets to port 139 and the other half to port 445, you would see a port signature like this: [139,50] [445,50]. In other words, 50 percent go to each port. Notice how 192.168.153.150 and 192.168.153.151 in Table 7.3 are sending packets to ports 139 and 445. However, other ports are in the port signature as well. This could be due to a Web-based client running along with a bot, or it might be due to the bot itself using the Web somehow. We do not know. The port signature as a field is important enough that we named the entire report after it.
port signatures Ourmon samples 10 destination ports in packets sent by the host and counts packets associated with those ports. The reason for doing this is that some types of scanners (typically malware of various forms, including botnet malware) will have a fixed set of attacks and will send packets only to a certain limited set of ports. For example, bots of the past have targeted Microsoft file share ports like 139 and 445 for many kinds of exploits. In the 30-second port report, this information is presented as a sorted list of ascending ports. Each port is also paired with a frequency count. For example, if you had a host that was sending half its packets to port 139 and the other half to port 445, you would see a port signature like this: [139,50] [445,50]. In other words, 50 percent go to each port. Notice how 192.168.153.150 and 192.168.153.151 in Table 7.3 are sending packets to ports 139 and 445. However, other ports are in the port signature as well. This could be due to a Web-based client running along with a bot, or it might be due to the bot itself using the Web somehow. We do not know. The port signature as a field is important enough that we named the entire report after it.
Ports are tricky. In some sense, they are both useful and useless. They are useful in that innocent applications use them all the time. For example, ports 80 and 443 are used by Web servers and Web clients to access the Web servers. On the other hand, malware could choose to use a well-known port for an IRC command and control connection (like port 80). Or an employee at work trying to hide use of a P2P application like BitTorrent might run it on port 80. Always remember that spoofing is possible. Typically, benign systems do not spoof, of course.
Analysis of Sample TCP Port Report
Now let’s go through the small set of IP addresses in our port report and analyze them. Remember that our addresses are sorted in ascending order and that 192.168 addresses belong to the home network.
10.0.0.1
The R flag indicates RESETS are coming back. The work weight is 100 percent. L3D/L4D indicates this host is talking to many local hosts at only one port. One destination port is the target (port 5900). This is a scanner, plain and simple. At this point if you don’t know what is going on, use a search engine and search on TCP port 5900. In this case we can rapidly learn that port 5900 is associated with a the Virtual Network Connection (VNC) application, and some version of it must have a bug as a hacker or a bot is looking for hosts to attack using a VNC exploit. Another possibility is that it might be used on hacker boxes and represent some sort of backdoor port. The network authorities might want to make sure port 5900 is protected in some manner.
10.10.10.10
Here we have a false positive, most likely. The H flag means a Web source port was seen, and sure enough, L3S/src shows one source port, port 80. SA/S is also 100 percent, which indicates a likely server. The port signature itself has random high ports in it which suggests dynamically allocated client ports. Web servers sometimes do show up in the basic port report. Of course, the strongest thing we can say here is that the work weight itself was only 17 percent. Therefore it is low and not worrisome. We know from statistical studies done at PSU that work weights fall into two clumps. Typically they range between 0 and 30 percent or are greater than 70 percent. The former, when nonzero, can indicate hosts with multithreaded applications that open multiple threads for efficiency but unfortunately have a high ratio of TCP control packets to data packets (this includes Web servers and P2P clients on hosts). If the number is above 70 percent for several instances of the TCP port report, you probably have a scanner, although it is always possible to have a client that has some sort of problem (like no server). We will say more about false positives in a moment. This is a Web server.
10.59.153.150
Here we instantly know that we have a bad one. Why? Because it has a P for the application flags, meaning that it is sending packets into our darknet. EWOM flags indicate (especially M) that packets aren’t coming back. Oneway TCP is not how TCP was intended to work (TCP is for dialogues, not monologues). Interestingly enough, we also have 100 percent for the work weight and 100 percent for the SA/S value. This tells us the interesting and curious fact that more or less all the packets being sent are SYN+ACK packets. Some scanning uses SYN+ACK packets to get around older IDS systems that only detect SYN packets but assumed SYN+ACK packets came from TCP servers. Note that port 445 is the target (which is often the case). This is a scanner and could easily be part of a botnet mesh, too.
192.168.153.150
This IP and the next IP are local and are on the same subnet. As it turns out, both of these hosts belong to “Case Study #3: Botnet Client.” These two hosts are infected with a botnet client and have been remotely ordered via the IRC connection to scan for exploits. Sure enough, the port signature shows that a large percentage of the packets on those hosts are being directed toward ports 139 and 445. 192.168.153.150 has a P, so it has been scanning into the darknet. Its work weight is 94 percent, too, which is too high.
192.168.153.151
192.168.153.151 is also part of Case Study #3 and is scanning in parallel with the previous host. It is possible that one of these two hosts infected the other host. In this case the application flag has an I, which indicates IRC. This is often not an accident with a scanning and attacking host. It indirectly indicates the IRC channel used for controlling the botnet. Of course, IRC is often used for benign reasons, too, but not in this case.
192.168.160.1
Our last host is another example of a possible false positive that we see on our campus. Here we have a host that is using a Gnutella application of some sort. The G in application flags indicates Gnutella. The work weight is low here, although Gnutella can have high work weights at times. The L3D/L4D values are very common for P2P using hosts because they are both high. In some sense this is the definition of peer to peer. A host talks to many other hosts (IP destinations) at possibly many TCP destination ports. The snt/rcv value is also interesting as it is both high and evenly distributed between packets sent and received. We say P2P hosts may be a false positive, but they might be what you wanted to catch anyway. This depends on whether the local security policy allows P2P or not.
 TIP
TIPSome things to remember about the TCP port report.
1. You may be viewing an attack in parallel. Say, for example, that you have 2000 hosts in it, all with a port signature of port 25. his is probably a remote botnet that has been ordered to scan your network for possible open e-mail proxies. This can very well be the explanation for the spike in the TCP worm graph in Case Study #2 in the previous chapter. In Chapter 9 we will explain how to make this correlation.
2. Sorting by IP address gives us the ability to see multiple infected hosts in an IP subnet.
3. Sorting the destination TCP ports gives us the ability to see patterns in scans initiated by malware. We may be able to see that a set of hosts are under the same remote control or possibly have the same malware program.
4. Our IRC report engine (next chapter) uses the TCP work weight to determine if there are too many attacking clients in a sick IRC channel. If so, it places the IRC channel in its evil channel list.
TCP Work Weight: Details
In this section we will briefly talk about a few aspects of the TCP work weight. It is the most important statistical measure in the port report, and we need to discuss how it is computed and what can seemingly go wrong with that process.
First of all, let’s look at how the work weight is computed. The rough equation for the work weight for one IP host is:
where:
![]() SS is the total number of SYNS sent by the IP during the sample period.
SS is the total number of SYNS sent by the IP during the sample period.
![]() FS is the total number of FINS sent by the IP during the sample period.
FS is the total number of FINS sent by the IP during the sample period.
![]() RR is the total number of TCP RESETS returned to the IP during the sample period.
RR is the total number of TCP RESETS returned to the IP during the sample period.
![]() TP is the total number of TCP packets, including control and data sent and received by the host, during the sample period.
TP is the total number of TCP packets, including control and data sent and received by the host, during the sample period.
Roughly one easy way to understand this is that we are comparing the number of control packets to the count of all packets sent. If it is 100 percent, that means all control packets were sent, which means either the client/server TCP protocol is broken or somebody is doing some sort of scan. We do some funny things like put RESETS into the denominator so that if a host attacks with data packets and only gets RESETS back, it will still have a nonzero work weight.
In the time we have used the TCP work weight, we have noticed several kinds of anomalous hosts showing up that could be considered false positives (benign as opposed to bad). Not everything that shows up there is a scanner. Hosts show up in the port signature report if they are inefficient in terms of TCP control versus data. For example, you would never see a large Web download or an FTP file exchange show up simply because there are very few control packets and a lot of data packets. Here are some known causes that might be considered false positives for hosts showing up in the port report:
![]() Sometimes e-mail servers will show up when they are having a hard time connecting to a remote e-mail server. This is because e-mail will try over and over again to connect. This is its nature. This does not happen with e-mail servers all the time, and ironically it could happen due to e-mail servers trying to reply to spam with fake IP return addresses.
Sometimes e-mail servers will show up when they are having a hard time connecting to a remote e-mail server. This is because e-mail will try over and over again to connect. This is its nature. This does not happen with e-mail servers all the time, and ironically it could happen due to e-mail servers trying to reply to spam with fake IP return addresses.
![]() P2P clients (hosts using P2P) may show up. This is because P2P hosts have to somehow know an a priori set of peer hosts with which to communicate. If that set of peer IP hosts is stale (out of date), many attempts to connect to them will fail. Gnutella in particular can cause these sorts of false positives. This is why we flag it with an application flag. Some P2P applications are more likely to show up than others. For example, Gnutella is more likely to show up than BitTorrent.
P2P clients (hosts using P2P) may show up. This is because P2P hosts have to somehow know an a priori set of peer hosts with which to communicate. If that set of peer IP hosts is stale (out of date), many attempts to connect to them will fail. Gnutella in particular can cause these sorts of false positives. This is why we flag it with an application flag. Some P2P applications are more likely to show up than others. For example, Gnutella is more likely to show up than BitTorrent.
![]() Some TCP clients could get unhappy when their server is taken down and might “beat up” the network with SYNS trying to reconnect to the server. This might be seen as a false positive or a useful IT indicator of a client/server connection problem.
Some TCP clients could get unhappy when their server is taken down and might “beat up” the network with SYNS trying to reconnect to the server. This might be seen as a false positive or a useful IT indicator of a client/server connection problem.
![]() Some Web servers might show up at times. As we saw earlier, Web servers are easy to spot and can be ignored.
Some Web servers might show up at times. As we saw earlier, Web servers are easy to spot and can be ignored.
TCP Worm Graphs
In this section we are going to discuss the relationship between the TCP port report and its companion RRDTOOL graph that we call the worm graph. Refer to Figure 6.3 from the previous chapter that shows the worm graph. This is also “Case Study #2: External Scan.”
How does this graph work? In the ourmon configuration file, you need to specify a portion of the Internet that you consider to be your home network or local enterprise. This is done with the following configuration syntax, which tells the system that subnet 192.168.0.0/16 is home and the rest is the Internet. In the worm graph, ourmon calls this “us” versus “them.” “Us” means the home subnet, of course. “Them” means the outside Internet.
topn_syn_homeip 192.168.0.0/16
When the probe decides to put an IP address in the TCP port report, it simply counts it as “us” or “them,” depending on whether or not it fits into the home range. The RRDTOOL graph has three lines in it for counting: the total (us + them), us, and them. In the graph, “us” is in green, and “them” is in red.
You can see that the graph is really only graphing the number of entries in the TCP port report. In fact, it is more or less graphing the number of separate lines in the port report, given that one IP address gets its own line. However, we can do a little extrapolation. Barring noise from local P2P hosts and Web servers, which tend to be fairly consistent in numbers, we end up graphing the number of scanners. Of course, not all scanners are automated malware. Some scanning is done with manually invoked programs. But the spikes that show up in this graph are almost always due to one of two causes, both botnet-related. If there is a spike, it could be due to an automated parallel scan or an automated parallel DDOS attack. It’s that simple. If you have an infected network, in general, you can also view this graph as a trend indicator for how you are doing. Hopefully the local network indicator (us) will go down over time as you somehow protect or repair individual local hosts.
In the first case, imagine that you are looking at a TCP port report that exactly matches the time in the spike in the worm graph. That port report has 2000 entries in it. Each entry more or less looks something like the entries listed in Table 7.4 (we only have two lines as opposed to 2000, so imagine more lines with more IP addresses from around the Internet).
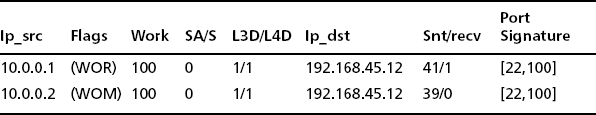
The important thing to notice here is that one port (probably a secure shell server) on one host is the target. The IP destination address is the same, and L3D/L4D indicates one IP and one port. This was a DDOS attack coordinated via a botnet. On the other hand, we might have data that looks like the pattern shown in Table 7.5.
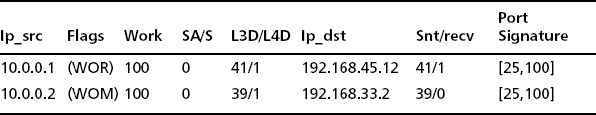
In this case, given that the IP destination addresses are different and L3D data shows 30 or so unique IPs swept in the sample period, we can say that we have a distributed botnet scan looking for e-mail ports.
A good question at this point is: If you have a spike, how can you find the TCP port report? A brutal answer is that you have to go look in the logs directory for the TCP port report and the day in question. First, note the time in the graph, which is around 1:00 A.M. Then change directory to the port report log directory for that day as follows (this depends on the base ourmon install directory; here we assume /home/mrourmon):
Log files are stored with the timestamp as part of their name, which is both convenient and sometimes inconvenient due to possible difficulties with manipulating filenames due to the naming convention. There is one for every 30-second period, of course. For example, you might have a name like:
You could use ls –l to look at filename lengths because typically in a case like this you want the biggest file at the relevant time. You can also use pattern matching to look at various files. For example, you could use the vi editor as follows to look at files around 1:05 A.M.% vi *01:0[3-6]:*
This command lets you use pattern matching to look at files from 1:03 to 1:06 A.M. In summary, an important hint is simply this: Look for the biggest file. In Chapter 9, when we discuss advanced logging techniques, we will give you a sneaky trick that simplifies this task.
TCP Hourly Summarization
We have mentioned that the TCP port report has various forms, including the 30-second TCP port report we saw earlier and a daily hourly summarization that is rolled over every day at midnight for roughly a week. So, on the current day, you will have an hourly summarization of the port report, and you will have a complete summarization for yesterday and the day before yesterday, and so on. The TCP port report is extremely valuable and as a result it comes with a number of different summarization forms.
The basic form consists of those hosts that have nonzero TCP work weights. Refer to Figure 7.3 and Table 7.2. There are three versions of the basic port report. The first one, called portsigs unfiltered, is a summarized version of all the 30-second period TCP port reports for hosts with nonzero TCP work weights. The second version consists of those hosts who had port 445 in their port signature field (called port 445 summarizations). This form exists due to the popularity of scanning against port 445 by malware. The third version (work weight >=40) consists of hosts with any 30-second report having a work weight greater than or equal to 40. This report gives you only hosts with high work weights. The p2p summarization consists of only those hosts having P2P application flags like BitTorrent, Gnutella, or IRC. The syndump summarization is aimed at all home IP addresses that have done any nontrivial traffic and can be a fairly complete summary of all local hosts. The TCP work weight is not used as a filter with the syndump summarization report. We also talk about the e-mail summarization but it is a special topic dealt with later in this chapter. It is worthwhile to know that the format in these reports for individual hosts is pretty much the same. Note that the summarization used in the TCP port report represents a very extreme form of statistical aggregation. Essentially all the TCP traffic for one host has been summarized in a few terse lines.
When you look at the various summarization versions, it is important to understand that the sets of IP addresses in the summarizations are sorted in potentially different ways. For example, the summarization entitled portsigs unfiltered is sorted by instance count. Instance count simply means how many times ourmon saw the particular IP address during the summarization period of today or yesterday, and so on. Each 30-second report can at most represent one instance. If a scanner shows up for 100 instances, that means the IP in question spent 50 minutes scanning. It also means that the IP address is in 100 port report files.
The IP addresses in some files (like the syndump summarization) are sorted by total TCP packet count. This lets you determine who the top talkers were, at least in terms of packets.
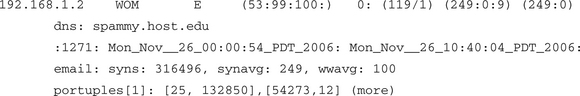
Now let’s look at the individual entry for one of the bot clients in Case Study #3. First let’s look at the data and then we will explain the format. Typically for something like this we look in the syndump summarization because we can be sure local hosts will show up there. So let’s look at an example taken from a daily summarization, discuss the fields in turn, and then explain how this particular entry was interesting in terms of our case history.
We will take these a line at a time. For line one, we have the following fields:
![]() Flags; the flags field from all the 30-second instances are ORed with a logical OR.
Flags; the flags field from all the 30-second instances are ORed with a logical OR.
![]() App flags; application flags from all instances are ORed together.
App flags; application flags from all instances are ORed together.
![]() Work weights; the TCP work weight is presented as a (minimum, average, maximum). The average is computed over all the 30-second instances. Minimum and maximum simply represent the minimum and maximum seen over all instances
Work weights; the TCP work weight is presented as a (minimum, average, maximum). The average is computed over all the 30-second instances. Minimum and maximum simply represent the minimum and maximum seen over all instances
![]() The SA/S field is an average across all instances (as are all the remaining fields on this line).
The SA/S field is an average across all instances (as are all the remaining fields on this line).
![]() The L3D/L4D fields give the number of unique IP address and unique TCP destination ports as averaged across instances.
The L3D/L4D fields give the number of unique IP address and unique TCP destination ports as averaged across instances.
![]() SYN/FIN/RESET; SYN, FIN, and RESET counts are averaged across all instances.
SYN/FIN/RESET; SYN, FIN, and RESET counts are averaged across all instances.
![]() Snt/rcv; total packets sent and received are shown as averages.
Snt/rcv; total packets sent and received are shown as averages.
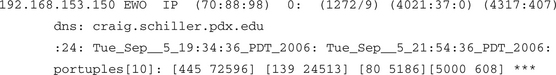
So for line 1, what can we say about our bot client? The application flags field with the value of I for IRC and P for darknet means that the host used IRC and scanned into the darknet. The work weight average is high. And in general the box is scanning with SYNS aimed at unique IP addresses.
For line 2, we have the following field:
![]() DNS name; this is the resolved DNS name. DNS names don’t always resolve, of course, but given that the report in this case is computed over hours, we can take the time to try to resolve them.
DNS name; this is the resolved DNS name. DNS names don’t always resolve, of course, but given that the report in this case is computed over hours, we can take the time to try to resolve them.
For line 3, we have these fields:
![]() Instance count is the count of separate port report files in which the IP address appeared. Divide by two to get the total number of minutes for the host in question. The time here is not necessarily contiguous time.
Instance count is the count of separate port report files in which the IP address appeared. Divide by two to get the total number of minutes for the host in question. The time here is not necessarily contiguous time.
![]() First timestamp is the timestamp for the first port report that included the host. Timestamps are often useful for IT organizations looking at DHCP, router, or switch logs to determine when a host appeared on the network.
First timestamp is the timestamp for the first port report that included the host. Timestamps are often useful for IT organizations looking at DHCP, router, or switch logs to determine when a host appeared on the network.
![]() Last timestamp is the timestamp for the last port report that included the host.
Last timestamp is the timestamp for the last port report that included the host.
Line 4 consists of a special sorted version of the port signature field. This line takes all the destination ports seen and their associated packet counts and sorts the ports by the packet counts. It then prints the ports to show you the busiest ports for the host. The packet counts are not averaged out in terms of frequency. The numbers represent the total packet counts seen added together across all the individual reports. In this case we can see that the popular ports were 445 and 139. This is because those ports were targets of scan probes looking for potential victims for exploits coded into the bot client.
As a graduation exercise, let’s look at one more example taken from a syndump summarization. What would you conclude about this host statistic?
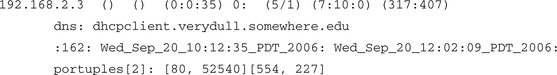
This is “Joe Average” host. There are no flags or application flags for this host. There is nothing very exciting about the average work weight (0) or the SA/S average (0). Probably a Web client was used to surf Web servers at remote port 80. Port 554 is used for real-time streaming, so some video or audio was involved. The average work weight is low. SYNS and FINS are close. More packets were received than were sent. In summary, this is probably just someone using the Web.
UDP Anomaly Detection
In this section we take a brief look at UDP-based anomaly detection. Most of our recent efforts have been on TCP because that is where the majority of security exploits seem to lie. This is not to say there have not been UDP-based exploits or UDP-based DOS attacks. The famous SQL-slammer was such a case; it contained a complete machine program in one UDP packet payload that exploited a SQL server and created a fearsome Internetwide flash storm in just a few minutes.
Here we are going to briefly look at two ourmon facilities for watching for UDP anomalies. The first is the UDP port report, which, like the TCP port report, is collected every 30 seconds. On the main Web page, the UDP port report is called udpreport.txt. The second UDP facility is the RRDTOOL-based UDP weight graph, and it is called the top udpreport weight graph on the main Web page. There is no UDP summarization at this time. In Chapter 9 we will tie UDP anomalies to the event log and ourmon’s automated packet capture feature, so we will return to the UDP case history that we present here one more time. For reference purposes, let’s call this “Case Study #5: UDP Scan.”
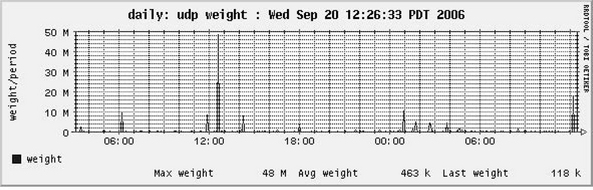
First let’s look at one example of a UDP-based DOS attack that is coming from the outside. There are a number of ways that we might spot that this attack happened, including looking at the ourmon system event log, or perhaps looking at the fundamental packets graph (as in Case Study #1) because it is often the case that a well-connected host can put a spike in that graph, or as in this case we could look at our UDP weight graph itself. The UDP weight graph gives us an RRDTOOL picture of recent UDP anomalies. You’ll note that in Figure 7.4 there was a large spike at 12:40 or so during the previous day.
The UDP weight graph graphs a metric called the UDP work weight. So as with TCP and its port report, there is also a UDP port report and per IP host UDP work weight. In the UDP port report, for each UDP host address we compute a UDP work weight based on a 30-second packet count. The work weight is computed more or less as follows:
One of the major differences between the TCP and UDP work weights is that TCP has control packets for starting, ending, and terminating connections (SYNS, FINS, and RESETS). TCP’s control packets are typically abused by scanners. UDP has no control packets and data flows may in fact be one way. As a result we use ICMP error messages like “ICMP port unreachable” with the UDP work weight to help catch network errors.
If a host sends a lot of UDP packets fast and they cause common ICMP errors like destination host unreachable (used by UDP but not TCP as TCP uses RESET packets), a high UDP work weight will be earned. Informally this means that the Internet found what you were doing to be in error. These sorts of events are often associated with DOS attacks or with UDP-based scans like Internet SPIM probes, which are scans sent to many local IP hosts. SPIM is spam for Internet Messenger applications. SPIM is something that can be done by bots as well and can be viewed as a form of adware. Every 30 seconds the graph adds the current highest work weight from all the UDP work weights in the UDP port report to the right side. So, like all the RRDTOOL graphs, this graph moves from right to left. Assuming we want more details, we need to try to find the 12:40 or so report in our logs directory. In this case we look in /home/mrourmon/logs/udpreport/Tue.
Now let’s assume we found the correct UDP port report and we need only glance at the top entry (see Table 7.6).
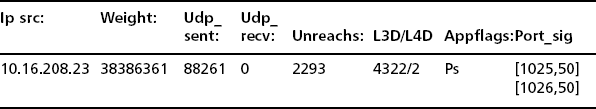
Given that our normal top entry in the UDP port report has an average work weight of less than 10000, this one does seem to be interesting. The UDP work weight is around 380 million. So the aggressor sent 88k UDP packets and none were returned during the sample period. However, it got back about 2k UDP errors. Earlier we oversimplified our UDP work weight compute equation. We actually weight the ICMP errors in such a way that if a host receives ICMP errors, it will get a higher work weight. We show pings too if any, but we left that field out of the example due to space limitations. We show unique IP destination and UDP port destination counts as with the TCP port report. This shows that the host sent packets to 4k local hosts (a lot) at only two ports. It’s clearly a scanner of some sort. We also have a few application flags (not many). P means that packets were sent into the darknet, and s is a built-in ourmon signature for identification of some forms of SPIM. Our port signature mechanism is completely the same as with the TCP port report. Here we see that half the UDP packets were sent to port 1025 and the other half were sent to port 1026. In the past, one type of IM application listened to these ports, and that is why they were the target.
By the way, it’s not that convenient to take an approximate time in the graph and somehow find the logged UDP port entry in a short time. In Chapter 9, when we learn about the event log and automated packet capture, we will learn some easier techniques for finding useful information from the UDP port reports.
Detecting E-mail Anomalies
In this section we take a brief look at detecting e-mail anomalies. We do this with a slightly modified TCP port report called the email syn port report. If you look back at Figure 7.1 you can find the 30-second version of this report in the security jump table. There is also a daily summarization in the summarization section. The goal of the e-mail syn report is to tell you which IP hosts are sending the most SYN packets to start TCP e-mail connections. A box infected with a spam-sending bot client tries to send large amounts of spam to many hosts and could incur failures. Typically such boxes are less efficient than normal e-mail servers. As a result, we sort all e-mail-sending systems by the total number of SYNs sent and put this in a special type of report. You should be able to use the daily summarization to determine which hosts are sending e-mail. Once you know what is normal for your site, you can ask yourself two questions:
The second question here should be taken with a large grain of salt. Email, more than most applications, is failure prone. E-mail servers try over and over again for days at a time before they give up. On the other hand, it could mean something significant if a host sending e-mail never succeeds. In that case, you might simply have a communication or configuration problem that needs to be addressed. For example, one concrete problem we have seen are off-campus e-mail servers trying to talk to a campus e-mail server via a DNS name, where the DNS name exists but the host itself is gone and is never coming back. On the other hand, normal e-mail servers are not likely to always fail. Furthermore, they will typically not try to make as many connections as a spam-sending system.
The port report is a little different in both the 30-second and summarized versions because for each host ourmon computes an e-mail-specific TCP work weight. Usually the work weight is for all the applications on a given host. In this case it is e-mail port-specific for a given host. The e-mail ports are defined as 25 (SMTP), 587 (submission), and 465 (secure SMTP). Put another way, there is a second e-mail packet-only work weight computed in the same fashion as the normal TCP work weight. We also count all e-mail SYN packets. Let’s take a quick look at the data formats to see how they differ. First we look at the 30-second report (see Table 7.7) and then we look at the summarization. We will only look at one data example in both cases. This system is a normal, busy e-mail server on our campus.
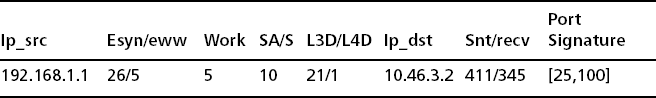
The only real difference in the e-mail syn report is the esyn/eww field, which gives 26 e-mail syns in the last 30 seconds and a computed e-mail-specific work weight of 5. The system work weight happens to be the same here (not always the case). Not surprisingly, port 25 was the target for all packets. In our experience the SA/S value tends to be low, probably due to mail transfer agent (MTA) hosts spending more time trying to connect than actually being servers. E-mail servers spend a lot of time as TCP clients talking to some other e-mail servers somewhere else. They try hard to connect over and over again, often for days at a time, so they are really clients, too. Here’s the summarization across the logs for one day for the same host:
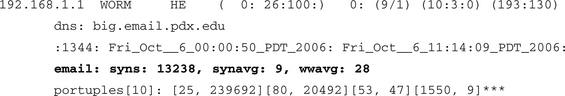
The only thing that’s different here from the normal TCP port report summarization is that there is an extra line (line 4) that is specific to e-mail SYN statistics. Line 4 gives the total number of SYNS seen across 1344 instances (13238). It gives an average SYNS per period of 9 and an average email work weight of 28. This is a portrait of an honest e-mail server. We should point out that in terms of most network applications, e-mail is pretty slow and has a lot of retries. There is also not really a lot of information exchanged in terms of packets compared to other bigger-volume applications like the Web, FTP, or multimedia downloads (video). You personally might feel like you get a lot of spam, but in terms of data it is not significant compared to other Internet applications.
Now let’s turn and look at an instance of a real infected host on campus that was trying to make external spam connections. The host was blocked by a border router and was not allowed to try to connect to port 25. This example is a summarization and should be compared to the previous summarization for 192.168.1.1.
If you compare the e-mail line for the real mail server (which happens to be the biggest mail server on our campus) with the infected host, you can easily see that the infected spam-sending host is trying to do more work. Its e-mail work weight (wwavg) is 100 percent simply because it is blocked getting out by a router. The anomaly here is truly large and easy to spot.
Although spam prevention is beyond the scope of this chapter, there are certain useful policies that can certainly be of assistance. We suspect our most important spam prevention strategy for outward bound traffic is blocking e-mail ports for dynamic IP ranges. We only allow certain boxes on campus to send email. See the Spamhaus FAQ at www.spamhaus.org for more information.
Summary
This chapter is concerned with the anomaly detection parts of ourmon and how you can understand them. We first looked at the ourmon Web interface so that we could learn how to navigate it and find the important graphs and reports concerned with anomaly detection. For TCP we have the TCP port report and the worm graph. We also have the daily TCP port report summarization, which comes in a number of different forms. For UDP we have a UDP port report and a UDP work weight graph. For e-mail we have a variation of the TCP port report that focuses only on systems sending e-mail across the Internet.
The bottom line here is that anomaly detection tools do not need to change if a spammer changes the text of a spam message or if a new worm or bot is introduced to the world. They can still detect abnormal uses of the Internet, including DDOS attacks and scanning. We can criticize these sorts of tools too because they do not detect an infected system before an attack occurs. Still, they do not suffer from the zero-day problem (the day before you have a virus signature for a new virus).
In the next chapter we will look at how the TCP port report’s work weight can be applied to a higher-level technology that understands IRC messages and can allow us to detect groups of attacking bots controlled via an IRC command and control channel.
Solutions Fast Track
The Ourmon Web Interface
The ourmon main Web page has three tables at the top.
![]() The first table includes an important link to a help page and a link to a no-refresh page.
The first table includes an important link to a help page and a link to a no-refresh page.
![]() The second table is focused on security.
The second table is focused on security.
![]() The third table breaks the main page into subsections, including the summarization section at the bottom.
The third table breaks the main page into subsections, including the summarization section at the bottom.
![]() The main page is updated every 30 seconds.
The main page is updated every 30 seconds.
![]() The no-refresh page is identical to the main page but is not updated every 30 seconds.
The no-refresh page is identical to the main page but is not updated every 30 seconds.
![]() Data on the main ourmon page is recent (last 30 seconds).
Data on the main ourmon page is recent (last 30 seconds).
![]() Secondary ourmon pages typically have more data about a particular filter. For example, the packets filter on the main page shows the RRDTOOL graph for now. Its secondary page shows all RRDTOOL graphs, including yearly, monthly, weekly, and daily graphs.
Secondary ourmon pages typically have more data about a particular filter. For example, the packets filter on the main page shows the RRDTOOL graph for now. Its secondary page shows all RRDTOOL graphs, including yearly, monthly, weekly, and daily graphs.
![]() Each filter section on the main page typically includes a link to a secondary page as well as a main-page link to the help page information for that specific filter.
Each filter section on the main page typically includes a link to a secondary page as well as a main-page link to the help page information for that specific filter.
![]() Hourly summarizations for the TCP report, event logs, and top N talker filters are found at the bottom of the main page.
Hourly summarizations for the TCP report, event logs, and top N talker filters are found at the bottom of the main page.
A Little Theory
![]() Anomaly detection depends on baselining of data so that you must first understand what is normal. After you understand normal, you can understand abnormal.
Anomaly detection depends on baselining of data so that you must first understand what is normal. After you understand normal, you can understand abnormal.
![]() Anomaly detection can point out new anomalies.
Anomaly detection can point out new anomalies.
![]() Signature detection can tell you if a particular packet or file is evil. It cannot recognize new evil packets or new evil files and hence is not good at zero-day attacks.
Signature detection can tell you if a particular packet or file is evil. It cannot recognize new evil packets or new evil files and hence is not good at zero-day attacks.
![]() Anomaly detection may only detect anomalies and might not be able to explain them.
Anomaly detection may only detect anomalies and might not be able to explain them.
![]() The hacker rule of economy means that small attacks or small amounts of spam are unrewarding.
The hacker rule of economy means that small attacks or small amounts of spam are unrewarding.
TCP Anomaly Detection
![]() The basic 30-second TCP port report is a snapshot of individual hosts using TCP, the main goal being to catch TCP-based scanning hosts.
The basic 30-second TCP port report is a snapshot of individual hosts using TCP, the main goal being to catch TCP-based scanning hosts.
![]() The basic 30-second TCP port report is sorted by ascending IP address. This allows you to spot hacked hosts on the same subnet.
The basic 30-second TCP port report is sorted by ascending IP address. This allows you to spot hacked hosts on the same subnet.
![]() The basic TCP port report may show large parallel scans. There is one line per IP host.
The basic TCP port report may show large parallel scans. There is one line per IP host.
![]() The basic TCP port report includes only hosts with nonzero TCP work weights.
The basic TCP port report includes only hosts with nonzero TCP work weights.
![]() The TCP work weight is a per-host measurement of TCP efficiency.
The TCP work weight is a per-host measurement of TCP efficiency.
![]() The TCP port report shows a number of attributes per host, including L3 and L4 destination counts. These are unique counts of L3 IP destination addresses and L4 TCP destination ports during the sample period.
The TCP port report shows a number of attributes per host, including L3 and L4 destination counts. These are unique counts of L3 IP destination addresses and L4 TCP destination ports during the sample period.
![]() The TCP port report also includes a SA/S statistic that can indicate that a host is mostly acting as a server.
The TCP port report also includes a SA/S statistic that can indicate that a host is mostly acting as a server.
![]() The TCP port report includes a port signature at the end, which is sorted in ascending order. The port signature can show that more than one host is doing the exact same scan.
The TCP port report includes a port signature at the end, which is sorted in ascending order. The port signature can show that more than one host is doing the exact same scan.
![]() The TCP worm graph shows the overall number of scanners, remote or local, as an RRDTOOL graph.
The TCP worm graph shows the overall number of scanners, remote or local, as an RRDTOOL graph.
![]() The TCP port report has a number of hourly summarized forms, including the basic port signature form, work weight > 40, P2P hosts, and the so-called syndump form, which shows all local hosts.
The TCP port report has a number of hourly summarized forms, including the basic port signature form, work weight > 40, P2P hosts, and the so-called syndump form, which shows all local hosts.
![]() The port host TCP port report summarization statistic is a highly aggregated summarization of work done by an individual host during a day.
The port host TCP port report summarization statistic is a highly aggregated summarization of work done by an individual host during a day.
UDP Anomaly Detection
![]() Ourmon has a 30-second UDP port report that is similar to the TCP port report. There is no summarization at this time.
Ourmon has a 30-second UDP port report that is similar to the TCP port report. There is no summarization at this time.
![]() The port report is sorted by the UDP work weight, which represents a per-host value based on the number of UDP packets sent and ICMP errors returned.
The port report is sorted by the UDP work weight, which represents a per-host value based on the number of UDP packets sent and ICMP errors returned.
![]() The UDP work weight for the top host is graphed in the UDP work weight graph every 30 seconds. This is an RRDTOOL graph. Thus this graph may show large UDP events.
The UDP work weight for the top host is graphed in the UDP work weight graph every 30 seconds. This is an RRDTOOL graph. Thus this graph may show large UDP events.
![]() The UDP anomaly mechanism typically captures UDP scanning systems or UDP DOS attacks.
The UDP anomaly mechanism typically captures UDP scanning systems or UDP DOS attacks.
![]() The default UDP work weight threshold is 10000000. Any events with UDP work weights larger or equal to this threshold are put in the event log (see Chapter 9).
The default UDP work weight threshold is 10000000. Any events with UDP work weights larger or equal to this threshold are put in the event log (see Chapter 9).
Detecting E-mail Anomalies
![]() The e-mail syn report has a 30-second and hourly summarized form.
The e-mail syn report has a 30-second and hourly summarized form.
![]() An e-mail-specific work weight is given so that e-mail connections can be distinguished from other kinds of connections.
An e-mail-specific work weight is given so that e-mail connections can be distinguished from other kinds of connections.
![]() The e-mail syn report is sorted by e-mail SYN count.
The e-mail syn report is sorted by e-mail SYN count.
![]() The e-mail reports may show a local host sending spam. Typically, locally infected hosts will appear high in the summarization compared to normal mail gateways.
The e-mail reports may show a local host sending spam. Typically, locally infected hosts will appear high in the summarization compared to normal mail gateways.
![]() The e-mail syn report is anomaly-based. Normal behavior and local normal e-mail hosts should be determined by observing the summarized daily report over time.
The e-mail syn report is anomaly-based. Normal behavior and local normal e-mail hosts should be determined by observing the summarized daily report over time.
The following Frequently Asked Questions, answered by the authors of this book, are designed to both measure your understanding of the concepts presented in this chapter and to assist you with real-life implementation of these concepts. To have your questions about this chapter answered by the author, browse to www.syngress.com/solutions and click on the “Ask the Author” form.
Q: Why does the TCP port report sometimes spot Web servers?
A: The short answer is: we don’t know why. We would love to understand this better. It could have something to do with HTTP mostly sending a lot of small files, so there are many control packets and just a few data packets. In theory, later designs of HTTP allow one server to put many files in one TCP connection, but this doesn’t work if the Web page itself has separate parts at different IP addresses.
Q: What kinds of real-world situations have you seen diagnosed with the UDP port report?
A: Probably everybody on the planet is getting SPIM 24/7. We have seen SQL-slammer outbreaks that are not exactly hard to spot. We have also seen numerous instances of badly maintained UNIX servers where some component of the Web server (say, using PHP) has been exploited and the web server itself is now being used to DOS a remote host. Bot systems tend to use TCP for scanning, but UDP does pop up sometimes. A UNIX system can have a bot as well, even if the majority of bots are found on Microsoft systems.
Q: Are the parts of ourmon focused on network management (not talked about in the book) ever useful for anomaly detection?
A: Everything in ourmon seems to be useful for anomaly detection. DOS attacks can cause top N talker graphs to show a single system doing the DOS to be the top N system. One system infected on campus with SQL-slammer caused the ICMP top N message graph to entirely point at that system as many systems in the world were busy sending ICMP messages back to the infected host.