
Chapter 6. Building a desktop browser application
This chapter covers
- Building a browser-based web application for the desktop
- Implementing security, tokens, and OAuth 2.0
- Saving security credentials
- Working with more out-of-the-box widgets
- Editing collected data
- Linking collected data with other data
Chapter 5 covered the details of custom editing and using the built-in capabilities of the ArcGIS JavaScript API to build an easy-to-use mobile editing application. The focus was on designing the application to run on mobile devices efficiently. Yet there is still a need for browser-based web applications for use in a desktop environment. Rather than investing in a desktop GIS application, such as ArcMap, which requires additional licenses for each user and comes with features that many users don’t need, you can create a focused web application that meets the specific needs of users. Implementing a web application designed for the desktop also saves time and money otherwise spent training people to use a new GIS application.
In this chapter, we consider the needs and goals of a desktop browser application built with the ArcGIS API for JavaScript. You’ll use some new Dijits that we haven’t yet discussed, and we’ll cover how to make updates or corrections to the data that was collected in the field.
Let’s start with the goals of the application, which we’ll name the RequestViewer.
6.1. The project ahead
Mobile data-collecting applications are fun to build. They present interesting challenges, as you saw in chapter 5 when dealing with disconnected editing, and encourage you to think in simple terms about design, such as implementing a single button-click to collect data. They also provide a practical exercise because data collection is a common use of mobile web-mapping applications. This chapter takes you a step further to look at what happens to the data after it’s been collected in a field application and analyzed in a desktop environment. After all, you should assume that users are collecting data for a reason.
6.1.1. Goals of the RequestViewer
Continuing the municipal services scenario, suppose that the data collected in the field is assigned to specific employees for further investigation, such as determining what work needs to be done to repair a pothole, or verifying the location of a request. Given these requirements, the RequestViewer application must provide users with the following capabilities:
- To choose a location collected in the field
- To assign a location to an employee from a list of employees
- To edit the data that was collected
For example, the user may want to change the location or type of request to more closely match the description of the request. Maybe the user wants to clarify the description or update the location of a report for a pothole.
6.1.2. Freedom of the desktop browser
You took care when building the application in chapter 5 to make sure it worked as efficiently as possible because it’s intended to run in a mobile browser. Care had to go into making sure data could be stored locally in case of a lost internet connection. You had to design a simpler user interface that wouldn’t clutter a small display. All in all, working on a mobile-based application required extra care.
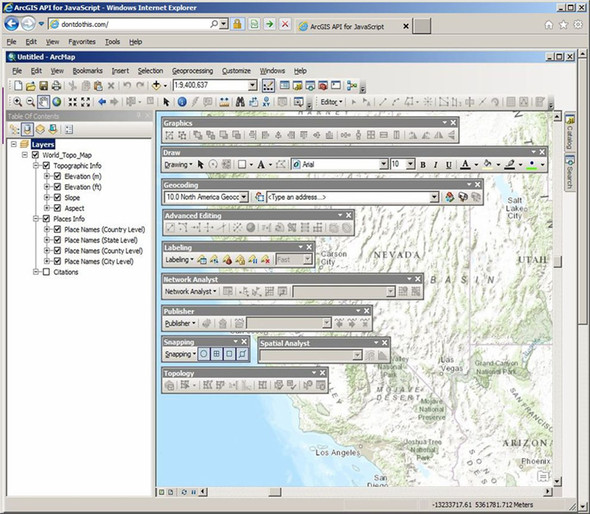
Although you don’t necessarily have the same restrictions when working on a browser-based web application for the desktop, neither do you have carte blanche to throw every widget in the ArcGIS JavaScript API into the RequestViewer. For example, don’t put ArcMap in the browser, which is mocked up in figure 6.1. This is an example of something you should not do! This wall of buttons and menus can be overwhelming for your average user. If users need all this functionality, they may need to use a bona fide installation of ArcMap to do their work.
Figure 6.1. Providing desktop GIS software (literally) in the browser overwhelms users and should be avoided.
You should still take care to make sure the RequestViewer runs well, but you don’t need to work under the threat of losing an internet connection or let tiny, pocketsized displays constrain your application. You can take advantage of Dijits from the ArcGIS JavaScript API, which don’t lend themselves to a mobile application but work fine in a desktop browser.
In chapter 5, you spent time building a custom Editor widget to better meet the needs of a mobile data-collecting web application. Similarly, when building the RequestViewer, it’s important to assess the users’ needs. For example, suppose you determine that users need to be able to search for data and add new features. You can tailor the application to make these tasks easy to complete, and if you can implement these tasks with out-of-the-box tools, you can also save yourself development time.
Note
The code for this application is available in the chapter6/part1 folder of the source code included with the book.
Now that we’ve defined our goals and requirements for the RequestViewer, let’s start writing code.
6.2. Setting up and configuring the RequestViewer
As in previous chapters, to get the application off the ground, you first define the HTML structure and the basic JavaScript files. Let’s start with index.html.
6.2.1. Creating index.html
The HTML for the RequestViewer application is similar to what you used in chapter 5. As shown in the following listing, it contains the structure for the application and references for the required style sheets and JavaScript files. This standard HTML structure can be used to get most projects started.
Listing 6.1. index.html—main HTML for your application

You’ve seen the content of this HTML file in previous chapters. One difference in this case is that you use the full version of the ArcGIS API for JavaScript rather than the compact version. As a result, you have access to many of the widgets in the API without having to manually load them in your modules. You saw how this works in chapter 5 (see section 5.1.2); when using the compact build of the API, you had to load the Identity Manager manually.
Next, let’s take a look at the run.js file.
6.2.2. Configuring run.js
This file sets up your application. As shown in the following listing, its configuration lets Dojo know where the files to build the application are located.
Listing 6.2. js/run.js—set up DojoConfig

Again, this is what you used in chapter 5, aside from omitting the folders you aren’t using. This is a standard way of setting up the Dojo part of the ArcGIS API for JavaScript to use your own custom-built modules.
Let’s take a quick look at the base main.js file of the application.
6.2.3. Starting the RequestViewer
This file defines the options for the map, loads the layers to be used, and starts up the application. This is the same file you used in chapter 5 and is shown in the following listing.
Listing 6.3. js/main.js—entry point to application
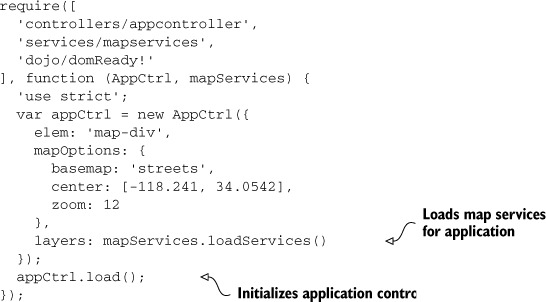
In this application, you use the streets basemap to provide more detail on your map. The next piece we’ll look at is mapServices.js, again the same file you used in chapter 5.
6.2.4. Defining map services
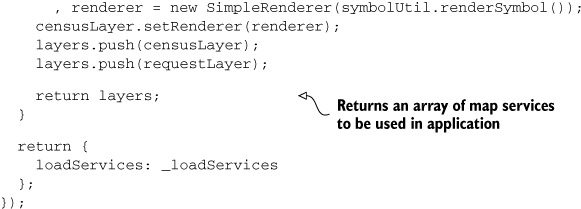
This file, shown in the following listing, defines the various map services to be loaded into the application. This module loads a census layer, which acts as a service request area, and also loads the requests that were created in the application you built in chapter 5.
Listing 6.4. js/services/mapservices.js—helper to load services

You can use the same mapservices.js file you used in chapter 5. You will want to replace the URLs for the map services in this example to use your own map services from your free ArcGIS Developer account.
Let’s look at the appcontroller.js file.
6.2.5. Setting up the application controller
You’re going to start with a simplified appcontroller.js, shown in the following listing, to handle creating the map. Later in this chapter, you’ll use this file to handle loading other modules for the application.
Listing 6.5. js/controllers/appcontroller.js—application controller for application

If you run the application, you should see a map that looks similar to figure 6.2.
Figure 6.2. No-frills base application

You’ll be prompted for your username and password to access your ArcGIS Online service, so have that information ready. Having to enter this information in your application repeatedly gets tedious, so refer to appendix C for information on setting up a proxy page.
After you set up the proxy page, refresh the browser for your application. You should no longer be prompted by the Identity Manager to log in, and your services should work as expected. The proxy page is a handy tool to use in a variety of scenarios. It’s also a great way to work when developing with secured services so you don’t have to log in each time.
Suppose you have a requirement to provide a level of security in your application, but you want something more robust than the Identity Manager to do it. Let’s see how OAuth 2.0 can help.
The ArcGIS API for JavaScript provides a couple of ways to handle working with secured services:
- The Identity Manager and the OAuth 2.0 protocol require users to log in to use and view the application.
- The proxy page method allows users to access the application and services directly without the need to log in repeatedly.
It boils down to a matter of preference in the route you decide to use. Personally, I like to use the proxy method during development and either the Identity Manager or OAuth 2.0 once deployed to production. All options are viable.
6.3. Setting up authentication with OAuth 2.0
A recent addition to ArcGIS Online is the use of OAuth 2.0 to allow access to your applications and services. An open standard for authorization, OAuth allows you to use third parties to access secured resources without having to share credentials. The advantage here is that users can log in using their ArcGIS Online accounts and be redirected back to your application. Your secured services use a token generated by ArcGIS Online, so you don’t have to set up individual users to allow access. This allows you to have application-level logins versus individual user-level logins.
The Esri documentation provides a couple of good OAuth samples (https://developers.arcgis.com/en/javascript/jssamples/portal_oauth_inline.html).
6.3.1. Using your developer account to create an application
In chapter 4 you set up your ArcGIS developer account, and you created the Requests feature service for use in your application; but you didn’t explore the features available from the My Applications page, specifically the security features.
Log in to your ArcGIS developer account and click the Applications link. You’ll see a screen similar to figure 6.3 that shows the steps to create an application.
Figure 6.3. My Applications page of ArcGIS developer account

Click the Create an Application button to register an application, as shown in figure 6.4.
Figure 6.4. Page to create a new application

Working your way through the text boxes on the Register New Application page is straightforward:
- Name— You can give your application any name you’d like; I named mine RequestViewer.
- Tags— These are optional but work much the same way as you saw in chapter 4; they help users find your application in search results.
- Redirect URI— This information is important. Remember, with OAuth 2.0, users can log in using their ArcGIS Online accounts. Once they log in, this Redirect URI redirects the user back to your application with the proper credentials to access the secured services. For development, this is probably localhost, but you can update it at a later time for deployment, so don’t be afraid to use whatever URL you need at the moment.
- Description— You can provide a description for your application so if you share your application via ArcGIS Online, others can understand the purpose of your application.
Once you click Create Application, navigate to the Application Details page. To view the Client ID and Client Secret, click the API Access link at the left. You should see the OAuth Credentials page as shown in figure 6.5 (my details are hidden). The Client Secret is used for server-based applications, but because this is a browser-based web application for the desktop, you need only the Client ID.
Figure 6.5. OAuth credentials of the RequestViewer application
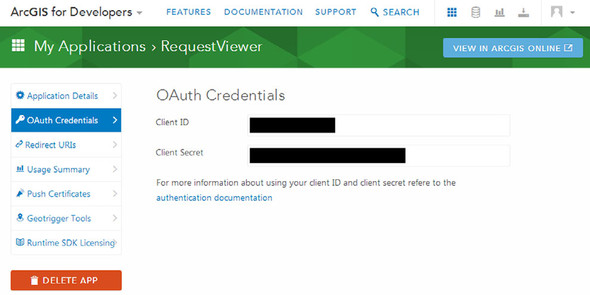
Be sure to keep the Client ID and the Client Secret used for authentication purposes hidden in your application. If a malicious user gains access to these, they can access billable services on your ArcGIS Online account, which could result in unwanted charges on the account. This caveat implies that you should store these credentials in a server environment that accesses the credentials for the application and provides them back to the client.
Tip
Implementing the server-side component is beyond the scope of this book, but it’s something you should be aware of when working with authentication. See the Esri resource-proxy project for a solution (https://github.com/Esri/resource-proxy/) and appendix C for more details.
You now have the credentials you need to use OAuth 2.0 in your application, so let’s modify the code to incorporate OAuth 2.0 in the sign-in process for the application.
6.3.2. Updating main.js
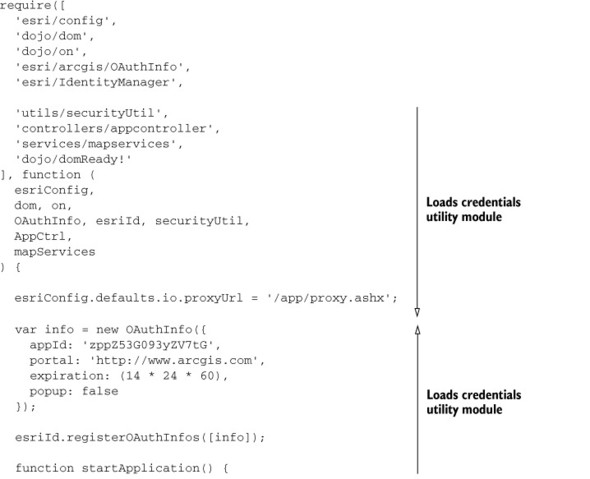
As I mentioned, to set up the credentials and make requests, you’ll use the esri/arcgis/OAuthInfo module in combination with the esri/IdentityManager module that Esri provides. This Identity Manager makes a request to use OAuth 2.0 to get the credentials for the application using the credentials provided in the OAuthInfo module, and then assigns those credentials to the Identity Manager so the application can access secured services. The updated js/main.js file, shown in listing 6.6, now uses the following workflow:
- Check whether user is signed in.
- If signed in, begin application as normal.
- If not signed in, begin the sign-in process.
- Once signed in, begin application as normal.
Note
The code for this section is available in the chapter6/part2 folder of the source code included with the book.
Listing 6.6. js/main.js—use OAuth 2.0


When you run the application, you should now be redirected to an arcgis.com page and asked to sign in with your ArcGIS Online credentials; in this case, enter your ArcGIS developer account information (see figure 6.6).
Figure 6.6. ArcGIS sign-in page for RequestViewer application

Once signed in, you’re redirected back to the application running on your local machine, and the secured services should work as normal. This is similar to using the Identity Manager, as in chapter 5, but you’ve offloaded the sign-in process to ArcGIS Online.
When using OAuth 2.0, you may have noticed that users must log in on each page refresh. It would be a neat feature to allow users to stay logged in until they sign out. Let’s implement this functionality next.
6.3.3. Saving credentials
If I were a user of an application that required me to log in every time I reloaded the page, I would get annoyed after a while. There could be security reasons for keeping this behavior, but let’s look at how to persist a user login on page reloads.
Note
The code for this section is available in the chapter6/part3 folder of the source code included with the book.
Adding a navigation bar
To allow users to log in and also log out, let’s update the index.html file to add a navigation bar with a Sign In link. Take a look at the following listing to see the updated file.
Listing 6.7. index.html—add Sign In link

Note that you’re taking advantage of Bootstrap styling because the style sheet is already referenced in your index.html file (see chapter 4). This makes the Sign In link easy to create. So that the navigation bar doesn’t interfere with the map, adjust the CSS to reposition the map 50 pixels from the top of the page in the css/main.css file:
#map-div {
  position: absolute;
  top: 50px;
  right: 0;
  left: 0;
  bottom: 0;
}
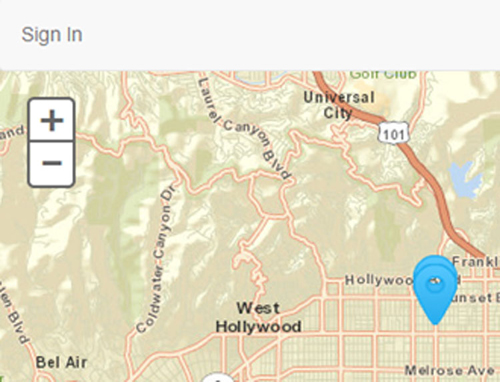
If you refresh the browser and log in, a navigation bar now appears at the top of the page with a Sign In link, as shown in figure 6.7. You’ll add the Sign Out link later in the chapter.
Figure 6.7. The application now displays a navigation bar with one link.
You’re using the Identity-Manager and OAuthInfo modules to log in to your application using OAuth 2.0. This utility does a good job of helping users to sign in, but once signed in, you need another utility module to save users’credentials.
Creating the credentials utility module
This utility module is inspired by a sample from the documentation for the ArcGIS API for JavaScript. It performs the same function as the original sample but uses the Identity Manager directly.
Note
To review the documentation sample, see https://developers.arcgis.com/javascript/jssamples/widget_identitymanager_client_side.html.
The code for the module is shown in the following listing. Key steps are labeled in the code and explained in detail after the listing.
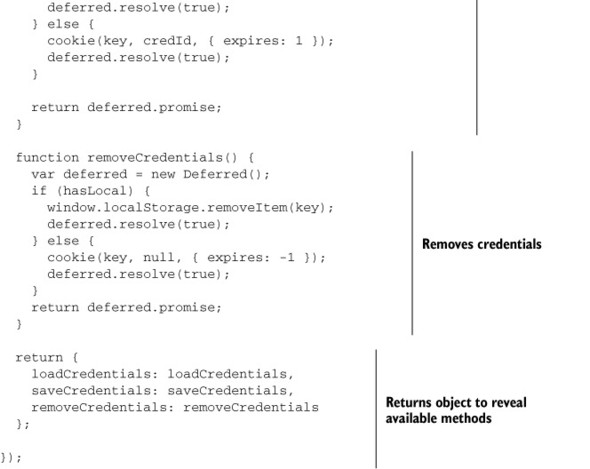
Listing 6.8. js/utils/securityUtil.js—module to handle credentials

The module accomplishes quite a bit, so let’s step through it for clarity:
1. Define a key to store the credentials for your application.
2. Check if localStorage is available.
The module attempts to use localStorage if available as a default storage mechanism, but if localStorage isn’t available, it uses a browser cookie to store the credentials. A cookie can hold tiny pieces of information related to your browsing history, including any credentials to secure websites. I’m showing this method of using a cookie to store credentials because ArcGIS Online tokens are only valid for about two weeks, but cookie storage is not the most secure method of storing such credentials. Use this method with caution.
The loadCredentials function attempts to load any credentials from localStorage or a cookie. If no credentials are available, it returns a Dojo promise and resolves that promise with a value of false. It does this by checking the esri/kernel module for credentials information.
4. Save current credentials.
The saveCredentials function saves the current credentials for one day by converting the credentials to JSON and storing them appropriately.
5. Delete credentials, if needed.
Because you can save the credentials, the module also allows you to remove them. Using the dojo/cookie module, you can remove a cookie by passing an object with an expires value of -1.
6. Expose functions outside the module.
Finally, the module returns a plain JavaScript object that exposes these functions to the outside world.
As you can see, this module makes extensive use of the dojo/Deferred module to return promises for each function. You’ll see how that works next when you update the js/main.js file.
Combining the credentials utility with OAuth 2.0
You’re still using Oauth 2.0 to sign in to the application, but you’re also now saving the associated credentials when the browser reloads. You can see what the updated js/main.js file looks like, with key steps labeled, in the following listing.
Listing 6.9. js/main.js—save credentials locally
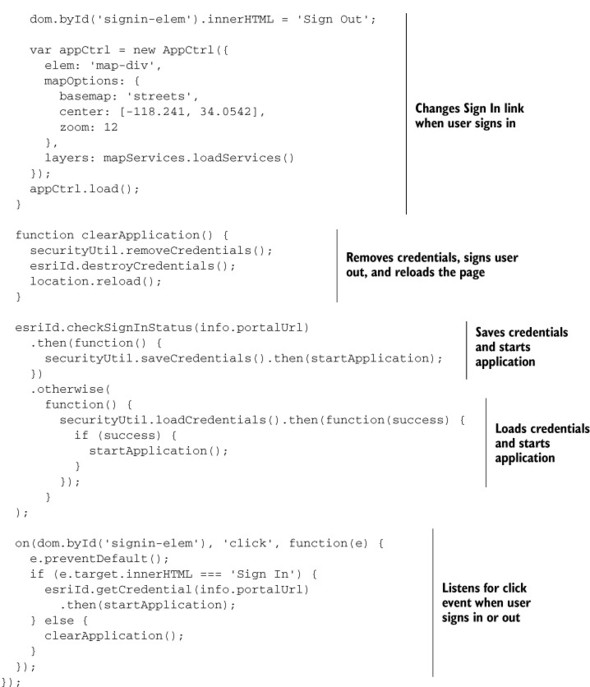
A few new security-related features are implemented in this file. The steps are detailed here:
1. Load the securityUtil module that will save OAuth 2.0 credentials.
2. To allow the user to also sign out, change the text of the link from Sign In to Sign Out when the user signs in and the application starts.
3. The clearApplication() function removes the credentials from the browser and signs the user out, which reloads the page.
4. IdentityManager checks whether the user has returned from the ArcGIS Online sign-in page. If so, it saves the credentials locally and starts the application.
5. If the browser isn’t redirecting from the ArcGIS Online sign-in page, it checks the local credentials and loads them. If loading the credentials is successful, it then starts the application.
6. Use dojo/on to listen for when the Sign In link is clicked and check whether the value of the link is Sign In.
If so, when clicked, the application uses IdentityManager to sign in the user and start the application. If the user is already logged in, you assume that the user wants to log out, so you remove the local credentials and reload the page using the clearApplication() function.
Now when you refresh the page, you’re presented with the navigation bar and the Sign In link with no map. When you click Sign In, you’re directed to the ArcGIS Online page, as before, where you sign in and then get redirected back to the application. The application should behave as before, but when you refresh the page, you’re no longer prompted to sign in; the application, along with the secured services, loads as expected. When you’re done, click the Sign Out link, and the page returns to its original state with the Sign In link and no map.
This handy module you built now manages user credentials for your application, which should make the user happier. With the base of your application built and a way to access secured services in place, let’s move on and add more functionality.
6.4. Building the user interface
With authentication complete, you can begin to add capabilities to your application. To show the power you get out of the box from the API, let’s add two standard ArcGIS API for JavaScript widgets:
- Measurement widget
- BasemapToggle widget
6.4.1. Working with the Measurement widget
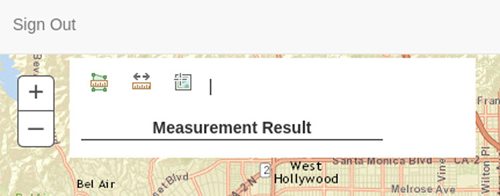
One of the widgets that I use on a regular basis is the Measurement widget. It does exactly what you think it does: it measures length and area and can even be used to determine a coordinate on the screen. I wouldn’t necessarily use this widget in a mobile-focused web application because I don’t think it’s the best fit for the screen real-estate it uses up, but for a desktop browser application, it works great. When added to your application, the Measurement widget looks similar to figure 6.8.
Figure 6.8. Adding the Measurement widget to the application provides tools to measure area, length, and coordinates of a location.
To get the Measurement widget into your application, modify the following files:
- index.html
- main.css
- appcontroller.js
Adding and displaying the measurement widget
First, add a div element to the index.html file to hold the widget. You can add this element after the element for the map:
<div id="map-div"></div>
<div id="measurement-div"></div>
Next, add the following CSS to the style sheet (css/main.css):
#measurement-div {
  position: absolute;
  background-color: #fff;
  z-index: 1;
  left: 65px;
  top: 55px;
  width: 300px;
  height: 200px;
  padding: 10px 80px 10px 10px;
}
This CSS makes the background color for the element white and positions the element on the page in a convenient location.
Note
The code for this application is available in the chapter6/part4 folder of the source code included with the book.
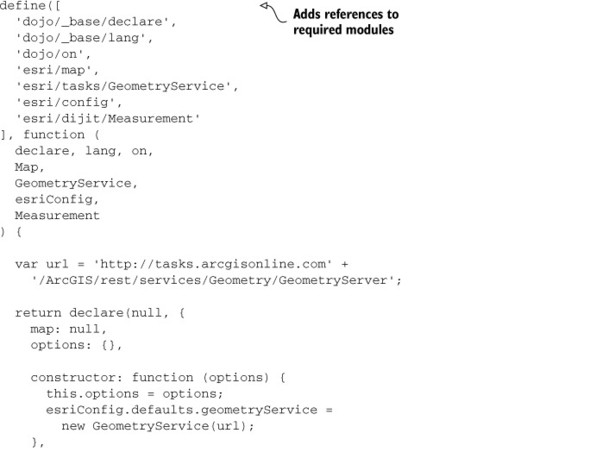
With the visual elements in place to hold the Measurement widget and display it, you only need to modify the js/controllers/appcontroller module to add the widget to the application, as shown in the following listing.
Listing 6.10. js/controllers/appcontroller.js—add Measurement widget

The key steps are detailed here:
1. Add references to newly required modules for the Measurement widget.
Add the dojo/on module to listen for the map to finish loading. The esri/tasks/GeometryService module is required by the Measurement widget so it can perform the calculations needed to display results on the map. To set the URL for the new GeometryService, use the esri/config module.
2. When the application starts, add a listener using the dojo/on module, which listens for the map to load.
3. When the map loads, create the Measurement widget by giving the widget a reference to the loaded map and the ID of the div element to use for the widget container.
Because the widget references an HTML element, use the startup() method of the widget so the widget can render in the browser.
Refresh the page to see what was shown previously in figure 6.8.
Using the measurement widget
If you begin clicking the icons of the Measurement widget, you’ll see that you can measure areas on the page and measure distances. When checking for coordinates, the widget even displays the latitude and longitude of the mouse cursor. Examples of what the Measurement widget can do are shown in figure 6.9.
Figure 6.9. Example usage of the Measurement widget

As you can see, the Measurement widget is a useful tool. Users tell me that one of their most common tasks for this widget is getting the coordinate of a location such as a street intersection. In the case of this application, a user may want to determine roughly how far away a request is from the street. It has numerous possible use cases.
You positioned the Measurement widget in a location on the page that’s convenient with respect to other elements such as the map and header. During use, the widget grows in width to accommodate the drop-down menu of measurement units, and it also grows in height, downward, to accommodate displaying the results. Realistically, the upper-left corner of the page is the only area that provides the widget with the room it needs during use. But you may not want the widget to be visible at all times. Wouldn’t it be neat if you could hide or show the widget with a button click? That’s exactly what you’ll do next.
Toggling visibility of the measurement widget
First, update the index.html file with a new anchor tag in a list item in the navigation bar HTML element (see listing 6.7). Add the link below the Sign In link:
<li>
  <a id="signin-elem" href="#">Sign In</a>
</li>
<li>
  <a id="measurement-toggle" href="#">Measure</a>
</li>
Next, add code to the controllers/appcontroller module to handle what happens when the Measure link is clicked. The updated module is shown in the following listing.
Listing 6.11. js/controllers/appcontroller.js—toggle Measurement widget


The key steps are detailed here:
1. Add new modules to the controller:
The first is the dojo/dom module, which enables HTML document object model (DOM) functionality, such as finding an element by the element ID.
The second is the esri/domUtils module. You typically don’t see this module in many samples, as this module is largely used internally in the ArcGIS API for JavaScript, but it comes in handy when toggling the visibility of HTML elements.
2. Use the dojo/dom module to find the measurement-toggle anchor element and bind the click event to the toggleMeasurement method on the controller.
3. When the anchor is clicked, use the esri/domUtils module to easily toggle the visibility of the Measurement widget by referencing the domNode of the widget. The domNode is a reference to the HTML element that contains the widget.
When you click the Measure link, it now toggles the visibility of the Measurement widget as shown in figure 6.10.
Figure 6.10. Clicking Measure in the navigation bar toggles visibility of the Measurement widget.
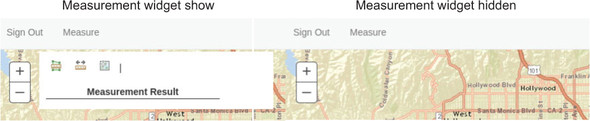
If required, you could hide the Measurement widget when the application starts up as well. Add one line of code to the end of the onMapLoad () method of the controllers/appcontroller module:
domUtils.hide(dom.byId('measurement-div'));
With that single line of code, the Measurement widget is now hidden when the application starts.
Adding out-of-the-box widgets of the ArcGIS JavaScript API is straightforward. Next, you’ll add a widget that allows you to toggle between two basemaps of the application.
6.4.2. Working with the BasemapToggle widget
Sometimes users want the application to display a different basemap—maybe a street view to get a general idea of an area, and then an aerial imagery view to see more detail, such as how many buildings are in a location, or how much open space there is. That’s where a tool like the BasemapToggle widget comes in handy.
The steps to add the BasemapToggle widget to the application are similar to adding the Measurement widget. Note that because you’ve already added a widget, the base is already there, so for this widget, you only need to add the reference, pass it options, and add a DOM element to bind it to.
Note
The code for this application is available in the chapter6/part5 folder of the source code included with the book.
Defining the widget
Modify the controllers/appcontroller module to add the widget as shown in the next listing.
Listing 6.12. js/controllers/appcontroller.js—add BasemapToggle widget
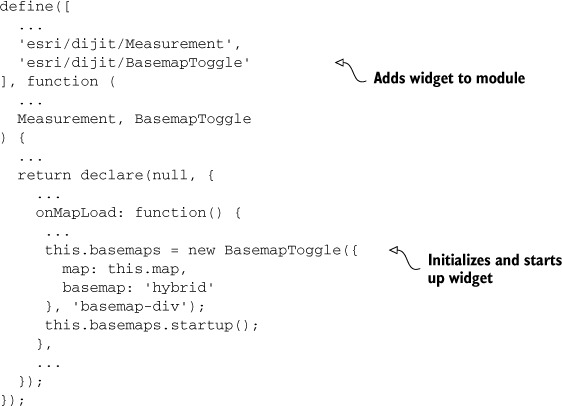
Add a reference to the BasemapToggle module in the controllers/appcontroller module, and then, almost identically to how you initialized the Measurement widget, pass it a reference to the map, and this time provide it a basemap type you want to toggle. As before, call the startup method to render it on the page.
Adding the HTML
You also need to add an HTML element to index.html to display the BasemapToggle widget:
<div id="map-div"></div>
  <div id="measurement-div"></div>
  <div id="basemap-div"></div>
Styling and positioning the widget
Then add some CSS to css/main.css to position the widget correctly on the page:
#basemap-div {
  position: absolute;
  top: 55px;
  right: 5px;
  z-index: 1;
}
With everything in place, if you refresh the browser, you should see the BasemapToggle widget. To change the basemap of the map on the application, click the widget (see figure 6.11).
Figure 6.11. To toggle between the Hybrid and Streets basemaps, click the BasemapToggle widget.

That was simple to accomplish. In fact, adding out-of-the box widgets to an application follows the same standard steps:
1. Add an HTML element to hold the widget.
2. Style and position the widget.
3. Pass one or more options.
4. Run the startup method to render the widget on the page.
Note
You’ll explore a possible way to take advantage of this pattern in chapter 7 when you work with dynamically loading widgets.
Next, let’s enhance the application with an editing feature that allows users to move the location of a request. You’ll also learn how to use a nonspatial web service to update the GIS data.
6.5. Editing requests
Imagine a user is looking at the application and finds that the location of a request needs to be changed. Maybe the user meant to add the request at a different cross street or the description specifically states a location other than the location where the request was added. This is a common scenario, and the ArcGIS API for JavaScript makes this task painless. This section covers the following:
- Setting up and configuring the Edit toolbar
- Setting up the AttributeInspector widget
- Linking GIS data to nonspatial services
6.5.1. Editing a request’s location
You previously worked with the Edit toolbar in chapter 5 to add features to the map (and you used a series of buttons rather than a visual toolbar). This time, you’ll use it to edit the location of a request.
Generally, to implement edit functionality, you add the Edit toolbar, listen for when the layer is double-clicked, and activate/deactivate the Edit toolbar. This functionality lets users double-click the layer to activate the Edit toolbar, right-click the selected request to drag and drop it to a different location, and double-click the layer a second time to save the edits and deactivate the Edit toolbar.
Before we add the Edit toolbar, let’s set up the application to handle the edit functionality.
Note
The code for this application is available in the chapter6/part6 folder of the source code included with the book.
Creating an edit-mode request symbol
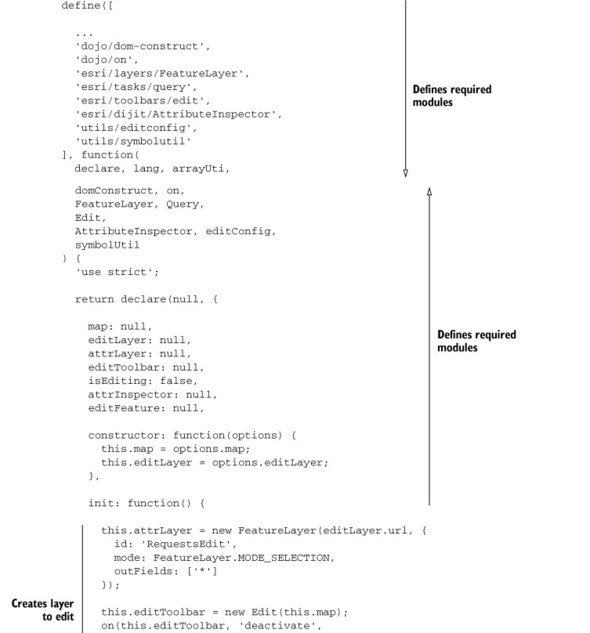
When users edit a feature on a map, you want to provide an indication that an action is taking place. A good solution is to change a request’s symbol while it’s being edited. To do that, let’s add a new method to the utils/symbolutil module you created in chapter 3. The updated module is shown in the following listing.
Listing 6.13. js/utils/symbolutil.js—add method to supply new symbol
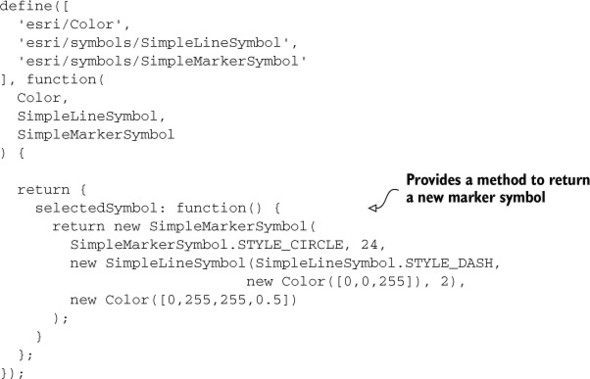
This module is similar to what you wrote in chapter 3, but this time, it returns a point symbol that looks like a circle with a dashed outline.
Next, let’s create a new Editor widget to perform the edit operations.
Creating a custom Editor widget
The code for the Editor widget is shown in the next listing. Key steps are labeled in the code and explained in detail after the listing.
Listing 6.14. js/widgets/editwidget.js—custom Editor widget
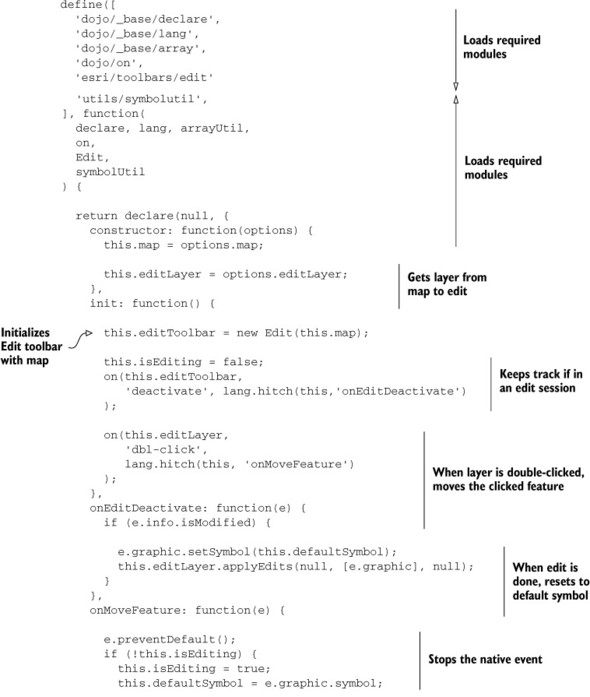

In this code you load a couple of modules. Here are the steps:
1. Load the esri/toolbars/edit and utils/symbolutil modules.
2. Retrieve the layer from the map that you want to edit. This is simple since the layer was passed in as part of the options.
3. Initialize the Edit toolbar by passing it the map. This will bind some internal functions to the map.
4. Use a variable to keep track of whether or not you’re editing. This will make tracking what’s happening in your application much easier.
5. Listen for the layer to be double-clicked to start editing.
6. When the Edit toolbar is deactivated, apply the updates to the service if the feature has been modified and set the symbol back to the default symbol.
7. Stop the default event behavior of zooming in the map.
8. If user is not already editing, turn on editing for the Graphic that was clicked, save the default symbol, and change the symbol to indicate that an action is taking place.
9. If user is already editing, turn off the Edit toolbar.
Adding the widget to the application
To use this Editor widget in the application, add it to the controllers/appcontroller module as shown in the following snippet from the js/controllers/appcontroller.js file:
define([
  ...
  'widgets/editwidget'
], function (
  ...
  EditWidget
) {
  ...
  return declare(null, {
    ...
    onMapLoad: function() {
      ...
      this.editWidget = new EditWidget({
        map: this.map,
        editLayer: this.map.getLayer('Requests')
      });
      this.editWidget.init();
    },
    ...
  });
});
You pass the custom Editor widget a reference to the map and the correct layer to be edited.
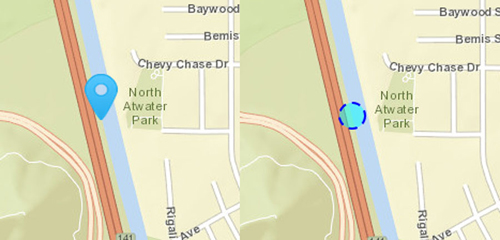
If you run the application, it doesn’t look any different than before. But if you double-click a request on the map, the symbol changes to a blue dot with a dashed outline (see figure 6.12). You can then right-click the request, hold down the right-click mouse button, and drag the request to a new location. Double-click the request again; the symbol returns to normal and the changes are saved to the service. Refresh the map to verify that the new location was saved.
Figure 6.12. The request’s symbol changes to indicate that its location is being edited.
Editing the location of a request is only half of the editing process. The other half is editing the data itself, which we’ll look at next.
6.5.2. Editing a request’s attributes
Like the requirement to a move a request when needed, there may also be situations where the user wants to edit the data associated with that request. In chapter 5, you built custom edit tools to collect the data. To edit the data in this application, you’ll use another out-of-the-box widget provided by the ArcGIS API for JavaScript: the AttributeInspector. The AttributeInspector allows a user to click a feature and then edit the data accordingly, but this widget does require a bit of setup.
Note
The code for this application is available in the chapter6/part7 folder of the source code included with the book.
Creating an AttributeInspector helper
You need to let the AttributeInspector know which fields to display and of those, which ones can be edited. To make the application more maintainable, let’s create a new file in the utils folder called editconfig.js. The purpose of this module is to provide the configurations to the AttributeInspector. The code is shown in the following listing.
Listing 6.15. js/utils/editconfig.js—configuration for AttributeInspector widget
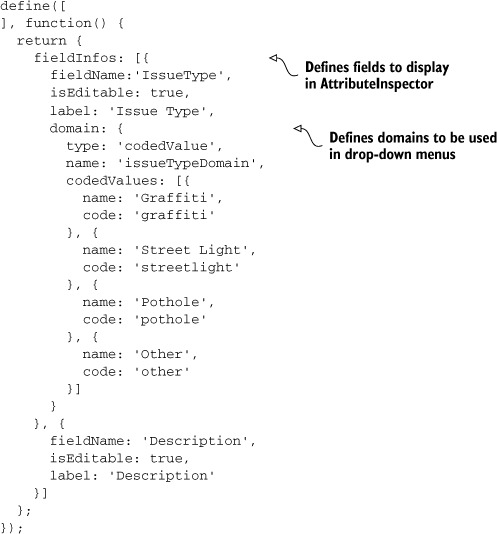
This utility returns an object that contains the fieldInfos that define what fields to display in the AttributeInspector as well as which ones are editable. The new domain property of the IssueType field helps populate a drop-down list in the AttributeInspector from which users can choose a value. Don’t get too excited about this feature yet, as it requires more sweat to get it working correctly.
Adding the AttributeInspector widget
Adding this widget requires updating the widgets/editwidget module (see listing 6.14). Like the custom Editor widget, this is an in-depth example, so first look at the updated module code in the following listing, and then we’ll discuss the details of what’s happening in the code.
Listing 6.16. js/widgets/editwidget.js—add AttributeInspector

1. To use the AttributeInspector, add a few more modules, including the FeatureLayer and editConfig.
2. Create a new FeatureLayer for use with the AttributeInspector. This layer isn’t displayed in the map; it’s strictly for editing the attributes. Make sure you specify FeatureLayer.MODE_SELECTION as the mode for the FeatureLayer, as that’s how you determine what features to edit.
3. The layer isn’t immediately loaded, so wait for its load event.
4. When the layer loads, use arrayUtil to iterate over the fields property of the layer and find which fields are defined in the editConfig module as having domains; then you can assign those domains to the source layer.
5. Create what’s called a layerInfos array, which tells the AttributeInspector which FeatureLayer to edit, if it’s editable, and provides the fieldInfos defined in the editConfig module.
You could also set it so the Delete button is shown, which isn’t used in this application, but would make a good exercise.
6. Initialize the AttributeInspector and create a new div element to contain it. Set this div element as the source for the map’s InfoWindow, which is a pop-up window provided with the map that you can use for the AttributeInspector.
7. When the map is clicked, check to make sure the user isn’t already trying to move a feature and that the user indeed clicked a Graphic. Then grab the OBJECTID of the Graphic.
8. Select features from the source layer, and once the results are returned, display the InfoWindow that allows the user to edit the data. If no features are returned, make sure the InfoWindow stays hidden.
9. Listen for when the data in the AttributeInspector changes and automatically send the updates to the server so the user doesn’t have to click a button to save the data. Because this is a browser-based application for the desktop, this shouldn’t strain browser resources.
10. When the InfoWindow is closed, be sure to clear the selections made on the map.
11. Finally, you have a method that iterates over the fields in the layer and the fields from the editConfig module to populate the domains.
That’s the basic process of using the AttributeInspector to edit the layer’s current data. Figure 6.13 shows the AttibuteInspector after you click a request on the map.
Figure 6.13. AttributeInspector allows users to edit the data.
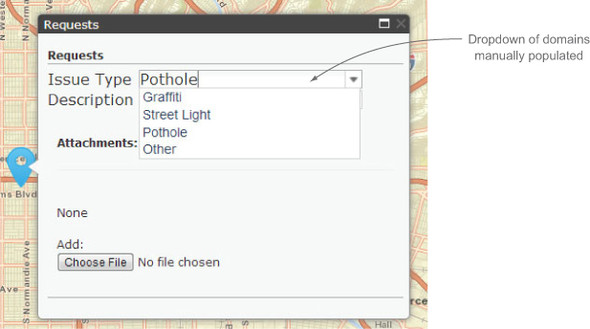
You may notice the Choose File button at the bottom of the AttributeInspector. Go ahead and click it. This button allows you to add attachments to your data, such as images or documents, or anything that you want to associate with this request. That comes for free with the AttributeInspector. You don’t have to write any extra code for that functionality, which I always thought was neat.
Next, you’ll learn how to populate a drop-down list in the AttributeInspector with data from a nonspatial web service. This can come in handy when various systems need to be linked together.
6.5.3. Incorporating a nonspatial service
You may want to incorporate existing data that has no spatial component with your spatial data—for example, displaying a list of assets, financial information, or employees. The last of those tasks, supplying a list of employees, is what you’ll implement to allow users to assign a specific employee to a service request.
Creating mock data
You may not have anything to do with the back-end web services that help power your web mapping application. A web service could be written in any number of programming languages, ranging from Java and C# to PHP and JavaScript (using Node), so to save you the time and brainpower of trying to piece together a web service, let’s create a mock web service for use in the RequestViewer app.
Note
The code for this application is available in the chapter6/part8 folder of the source code included with the book.
Create a new file called data/data.json in your project. Notice the .json file extension; this is a JSON file, not a JavaScript file. This file is also available with the source code for the book. The following listing shows the mock JSON data.
Listing 6.17. data/data.json—mock data for application
{
  "employees": [{
    "name": "Simon Williams",
    "id": 101
  }, {
    "name": "Sam Axe",
    "id": 102
  }, {
    "name": "Clint Barton",
    "idt": 103
  }, {
    "name": "Kevin Key",
    "id": 104
  }, {
    "name": "Mitchell Hundred",
    "id": 105
  }, {
    "name": "Matt Murdock",
    "id": 106
  }, {
    "name": "Jack Knight",
    "id": 107
  }, {
    "name": "Selina Kyle",
    "id": 108
  }]
}
With the data in place, you can move on to the mock web service.
Creating a mock web service
This mock web service is simple. If you’re lucky, the various web services you work with return data in an easy-to-use format, and you don’t have to spend too much time transforming the data to meet your needs. Because your mock data represents a clean result, the mock web service, shown in the following listing, is clean as well.
Listing 6.18. js/services/employeeservice.js—mock web service

When working with web services using the ArcGIS API for JavaScript, you should stick with using the esri/request module provided by the API. This module handles errors cleanly and also takes advantage of the proxy when needed. As shown in the code, you send a request with the following parameters:
- The URL of the web service; in this case, the JSON file you mocked up (data.json).
- How you want to handle the data; in this case, as JSON.
- A name for the odd property called callbackParamName; in this case, it’s callback.
When trying to retrieve data from a server other than the one your application is hosted on, you may need to use the option callbackParamName. The value for this option is always callback. The purpose of the callback is to take advantage of JSONP, which is JSON with Padding, when needed to make cross-origin requests from the browser. JSONP works by placing a script tag in the browser with a URL as the source. The method given to that URL is the callback name.
Updating the Editor widget
The final step is to update the Editor widget to use your web service and provide the employee information to the layer and the AttributeInspector. This last step can get tricky because you have to map the list of employees to a field in the FeatureLayer. Look at the updated code in the following listing, and then we’ll discuss the details of what’s happening.
Listing 6.19. js/widgets/editwidget.js—add web service data

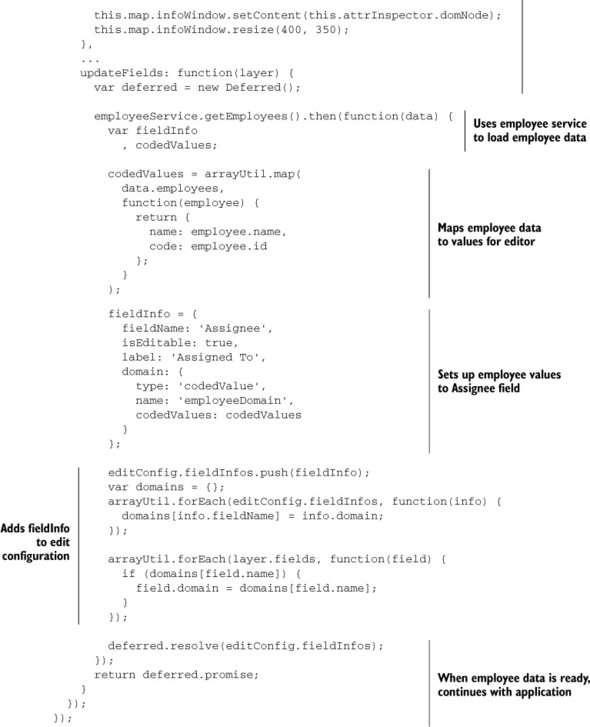
The steps are detailed here:
1. Load the Deferred module, which you used extensively in chapters 4 and 5, as well as in the empoyeeservice module.
2. Update the updateFields method to return a promise, and, when that promise is complete, launch a new method called onFieldsReady to replace the method onLayerLoaded from listing 6.17.
3. The onFieldsReady method behaves identically to the previous onLayerLoaded method, except the fieldInfos for the AttributeInspector are provided by the fieldInfos returned by the updateFields method.
4. The updateFields method is where most of the code changes have taken place. Call the employeeService.getEmployees method to return the mock JSON data.
5. The arrayUtil.map method creates a new array of coded values to be used in the application from the JSON results.
6. Create a new fieldInfo object that matches the Assignee field of the layer you want to associate with the JSON results.
7. Add this new fieldInfo object to the array of fieldInfos in the editConfig.
8. Once the layer has been supplied with all the appropriate domains, resolve deferred with the fieldInfos, and the application functions as normal.
If you refresh the application and click a request to edit it, a new drop-down list of employees appears that can be assigned to the Assignee field of the request (see figure 6.14).
Figure 6.14. AttributeInspector enhanced with web service data

This is a useful method of linking nonspatial data from a web service with your web mapping application. It’s seamless to the user; the employee information isn’t part of your spatial data. This is by no means the only way to enhance your application with other web services; sometimes this process can be as simple as opening another web application via a hyperlink and using the id of a spatial feature as part of the URL, or as complicated as syncing large amounts of purchasing data with spatial features on the map. Integration needs vary widely, but this exercise should give you a good idea of what’s possible.
The edit tools covered in this chapter and the AttributeInspector are key to performing edit functions with the ArcGIS API for JavaScript. Once you understand the concepts and uses of these widgets, you can use them in most configurations or customize them to meet your needs. This is a valuable skill set to have when working with the ArcGIS API for JavaScript. In the next chapter, you’ll advance the offline editing capabilities of the edit tools for use in your application.
6.6. Summary
- This chapter covered a boatload of material. You now have a good idea of how to generate tokens for your secured application, whether you’re using ArcGIS Server or ArcGIS Online.
- You saw how to use OAuth 2.0 to handle authentication for your application and even learned a couple of neat methods to save those credentials in the browser.
- You looked at standard widgets, the Measurement and BasemapToggle, with the ArcGIS API for JavaScript that simplify many tasks.
- You should have a strong grasp of how to use the Edit module and Attribute-Inspector to edit data in an application, and you even took things a step further by adding custom domain values to the AttributeInspector to use a nonspatial web service.
This chapter marks the end of the training-wheels chapters designed to familiarize you with various aspects of the ArcGIS API for JavaScript. I may have let go of the bike on occasion, but I didn’t push you down any hills. In the next and final chapter, I’ll push you down a hill. Chapter 7 covers advanced methods for loading widgets and map services, all from a single configuration file. Once you write the base project, you can reuse it over and over again. Brace yourself; it’s going to get bumpy.