
Chapter 12. Monitoring and troubleshooting
In the previous chapters, you learned how to make your applications highly available and route customers from around the world to globally distributed instances of your application. One goal was to minimize the amount of interaction with your application infrastructure and let the Azure platform automatically manage health and performance for you. Sometimes, you still need to roll up your sleeves and review diagnostics or performance metrics. In this chapter, you learn how to review boot diagnostics for a VM, monitor performance metrics, and troubleshoot connectivity issues with Network Watcher.
12.1. VM boot diagnostics
With web apps, you deploy your code and let the Azure platform handle the rest. In chapter 3, we looked at the basics of how to troubleshoot and diagnose problems with web app deployments. You learned how to see real-time application events to monitor performance. When you work with VMs in the cloud, it’s often hard to troubleshoot a problem when you can’t physically see the computer screen the way you can get web app diagnostics.
One of the most common issues with VMs is lack of connectivity. If you can’t SSH or RDP to a VM, how can you troubleshoot what’s wrong? One of the first things you may want to check is whether the VM is running correctly. To help with this, Azure provides VM boot diagnostics that includes boot logs and a screenshot of the console.
For specific troubleshooting scenarios, you can also access a live serial console for VMs in Azure. This serial console allows for interactive logons and troubleshooting in the event of boot problems. You can reconfigure your VM to correct for failed boot scenarios or misconfigurations of services and applications that prevent your VM from booting correctly.
This chapter doesn’t go into specific scenarios for serial console use, but it’s a great resource that lets you virtually sit in front of the screen of a VM as it starts up. You also need boot diagnostics enabled, so these exercises are prerequisites for the serial console.
To create a VM and enable boot diagnostics, complete the following steps.
1. In the Azure portal, select Create a Resource in the upper-left corner. Select Windows Server 2016 VM.
2. Enter a Name, such as molvm, a User Name, such as azuremol, and a Password. The password must be a minimum of 12 characters long and contain three of the following: a lowercase character, an uppercase character, a number, and a special character.
3. Choose Create New Resource Group. Enter a name, such as azuremolchapter12. Select the most appropriate Azure region closest to you.
4. Select a VM size, such as D2S_v3.
5. On the Settings page, review the default resources created for the virtual network, public IP address, and network security group (NSG). These should be familiar resources from the previous VMs you’ve created. Leave the defaults—there’s nothing you need to change.
One thing you may have skipped over previously was the Monitoring section. As shown in figure 12.1, the Boot Diagnostics option is enabled by default, and a storage account is created. For now, leave the Guest OS Diagnostics option disabled.
Figure 12.1. By default, boot diagnostics are enabled when you create a VM in the Azure portal. A storage account is created, which is where the boot diagnostics are stored. In a later exercise, you review and enable guest OS diagnostics, so don’t enable them right now. For production use, I recommend that you enable both boot diagnostics and guest OS diagnostics for each VM you create.

6. To create your VM, select OK in the Settings window and then Create in the Summary window.
7. It takes a few minutes to create and configure the VM, so let’s continue to explore the boot diagnostics.
If you don’t have boot diagnostics enabled but run into a problem, you likely can’t boot the VM to successfully enable diagnostics. It’s a fun chicken-and-egg scenario, right? As a result, boot diagnostics are automatically enabled for VMs created in the Azure portal. For Azure PowerShell, Azure CLI, and the language-specific SDKs, you need to enable boot diagnostics. I recommend that you enable boot diagnostics on your VMs when you create them.
You do need to create a storage account for the boot logs and console screenshots, but the cost is likely less than $0.01 per month to store this data. The first time you run into a VM problem and need access to the boot diagnostics, that penny per month will be worth it! This storage account can also be used to hold additional VM-level performance metrics and logs, which we examine in the next section. Again, the storage costs are minimal. Even as your VM environment grows, it’s worth the additional minor cost to be able to quickly troubleshoot an issue when things go wrong.
To view the boot diagnostics for your VM, complete the following steps.
1. In the Azure portal, select Virtual Machines from the menu on the left. Choose the VM you created in the previous exercise.
2. Under the Support Troubleshooting section of the VM menu, choose Boot Diagnostics. The boot diagnostics and VM status are displayed, as shown in figure 12.2. The health report would indicate if there were boot problems with the VM and allow you to hopefully diagnose the root cause of the issue.
Figure 12.2. The boot diagnostics for a VM report on the health and boot status. If errors are displayed, you should be able to troubleshoot and diagnose the root cause. You can also download the logs from the portal for analysis on your local computer.

12.2. Performance metrics and alerts
One of the first steps to troubleshoot an issue starts with a review of performance. How much memory is available, how much CPU is consumed, and how much disk activity is there?
As you build and test your applications in Azure, I recommend that you record performance baselines at various points. These baselines give you an idea as to how your application should perform under different amounts of load. Why is this important? In three months, how can you determine if you encounter performance problems without some data to compare the current performance against?
When you learned how to autoscale applications in chapter 9, you used basic performance metrics, such as CPU usage, to tell the Azure platform when to increase or decrease the number of instances of your application. These basic metrics only give you a small insight as to how the VM performs. For more detailed metrics, you need to look at the performance of the VM. To do this, you need to install the Azure diagnostics extension.
12.2.1. Viewing performance metrics with the VM diagnostics extension
To add functionality to your VMs, Azure has dozens of extensions that you can seamlessly install. These extensions install a small agent or application runtime into the VM that often then reports information back to the Azure platform or third-party solutions. VM extensions can automatically configure and install components, or run scripts on your VMs.
The VM diagnostics extension is a common extension that’s used to stream performance metrics from inside the VM to a storage account. These performance metrics can then be analyzed in the Azure portal, or downloaded and used in an existing monitoring solution. You can use the diagnostics extension to gain a deeper understanding of the performance of CPU and memory consumption from within the VM, which can typically provide a more detailed and accurate picture than the host.
In chapter 18, we discuss Azure Automation to perform tasks on your VMs in an automated, scheduled manner. One powerful feature of Azure Automation is acting as a PowerShell Desired State Configuration (DSC) pull server. PowerShell DSC is used to define a given state of how a system should be configured, what packages should be installed, files and permissions, and so on. You create definitions for the desired configuration and apply them to VMs or physical servers. You can then report on and enforce compliance with those policies. The Azure PowerShell DSC extension is used to apply DSC configurations, such as from an Azure Automation pull server.
Other extensions that can apply configurations and run scripts on VMs include the Azure Custom Script Extension. With the Custom Script Extension, you either define a simple set of commands or point to one or more external scripts, such as those hosted in Azure Storage or GitHub. These scripts can run complex configuration and installation tasks, and ensure that all deployed VMs are configured consistently.
Both the Azure PowerShell DSC extension and Custom Script Extension are commonly used with virtual machine scale sets. You apply one of these extensions to the scale set, and then as VM instances are created within the scale set, they’re automatically configured to run your application. The goal of these extensions is to minimize the required manually configuration of VMs, which is an error-prone process and requires human interaction.
Other ways to automate VM configurations include Puppet and Chef, both of which have Azure VM extensions available. If you already have a configuration-management tool in use, check with the vendor for its supported approach for use in Azure. There’s a good chance a VM extension is available to make your life easier.
To enable the VM diagnostics extension, complete the following steps.
1. In the Azure portal, select Virtual Machines from the menu on the left. Choose the VM you created in a previous exercise.
2. Under the Monitoring section of the VM menu, choose Diagnostic Settings.
It takes a couple of minutes to enable guest-level monitoring. Behind the scenes, here’s what Azure does:
- Installs the VM diagnostics extension
- Configures the extension to stream guest-level metrics for the following areas:
- Logical disk
- Memory
- Network interface
- Process
- Processor
- System
- Enables application, security, and system logs to be streamed to Azure Storage
Once the diagnostics extension is installed, you can limit what data is collected by selecting only certain performance counters to report. For example, you may wish to only collect memory usage, or enable the collection of Microsoft SQL Server metrics. By default, metrics are collected every 60 seconds. You can adjust this sample rate as desired for your applications and infrastructure.
The VM diagnostics extension can also stream log files from your VM. This allows you to centralize the application, security, and system logs for analysis or alerts, as shown in figure 12.3. By default, application and system logs that generate Critical, Error, or Warning are logged, along with security events for Audit Failure. You can change the log levels to record, as well as enable log collection from IIS, application logs, and Event Tracing for Windows (ETW) events. As part of your application planning and deployment, determine what logs you want to collect.
Figure 12.3. You can configure events and log levels for various components within the VM. This ability lets you centralize your VM logs for analysis and to generate alerts. Without the need to install complex, and often costly, monitoring systems, you can review and receive notifications when issues arise on your Azure VMs.

There’s nothing unique to Windows VMs here. You can use the diagnostics extension on Linux VMs in the same way, to obtain performance metrics and stream various logs.
If your VM encounters a problem, often the only way to analyze what happened is to review the crash dumps. Support channels often request these dumps if you want to get to the root cause for a problem. As with the boot diagnostics, there’s no way to retroactively enable crash dumps to see why something failed, so determine whether you need to monitor certain processes and be proactive about configuring crash dumps. For example, you could monitor the IIS process and record a full crash dump to Azure Storage if the process fails.
Here are a couple of other areas that you can configure for guest metrics:
- Sinks allow you to configure the VM diagnostics extension to send certain events to Azure Application Insights. With Application Insights, you can gain visibility directly into how your code performs.
- Agent lets you specify a storage quota for all your metrics (the default is 5 GB). You can also enable the collection of logs for the agent itself, or uninstall the agent.
To view guest-level metrics, complete the following steps.
1. In the Azure portal, select Virtual Machines from the menu on the left. Choose the VM you created in a previous exercise.
2. Under the Monitoring section of the VM menu, choose Metrics.
3. Many more metrics are now available, compared to the host-based metrics from chapter 9. In the Filter Metrics text box at the top of the list of available metrics, enter memory. From the filtered list, select [Guest] Memory\% Committed Bytes in Use, as shown in figure 12.4.
Figure 12.4. With the VM diagnostics extension installed, additional [Guest] metrics are available for review. You can search for and select the metrics to view, or change the time range as desired.

12.2.2. Creating alerts for performance conditions
With your VM configured to expose guest-level performance metrics, how do you know when there’s a problem? Hopefully, you don’t want to sit and watch the performance graphics in real time and wait until a problem occurs! I’m not your boss, if that’s your thing. But there’s a much better way: metric alerts.
Metric alerts let you select a resource, metric, and threshold, and then define who and how you want to notify when that threshold is met. Alerts work on more than just VMs. For example, you can define alerts on public IP addresses that watch for inbound distributed denial of service (DDoS) packets and warn you when a certain threshold is met that could constitute an attack.
When alerts are generated, you can choose to send an email notification to owners, contributors, and readers. These users and email addresses are obtained based on the RBAC policies applied. In larger organizations, this could send email notifications to a large group of people, so use with care! Another option is to specify email addresses, which could be the application owners or specific infrastructure engineers, or a distribution list or group targeted to the directly involved parties.
A couple of other options exist for actions to take when an alert is triggered:
- Execute a runbook—In chapter 18, we examine Azure Automation. The Automation service allows you to create and use runbooks that execute scripts. These scripts could perform a basic remedial action on the VM, such as to restart a process or even reboot the VM. They could also run Azure PowerShell cmdlets to enable Azure Network Watcher features like capture packets, which we explore in the rest of this chapter.
- Run a logic app—Azure logic apps allow you to build workflows that run serverless code. You could write information to a support ticket system or initiate an automated phone call to an on-call engineer. In chapter 21, we explore the wonderful world of serverless computing with Azure logic apps and Azure functions.
In the end-of-chapter lab, you configure some alerts for your VM. Azure can do more than help to troubleshoot and monitor your VMs, though. Let’s discuss another common cause for things to go wrong: the network.
12.3. Azure Network Watcher
VM performance metrics and boot diagnostics are great ways to monitor your Azure IaaS applications. Web app application logs and App Insights provide awareness of the performance of your PaaS applications. Network traffic is often less glamorous, but it’s more likely to be the cause of application connectivity issues that you or your customers encounter.
Back in chapter 5, I joked that the network team always gets the blame for problems that the operations team can’t explain. Here’s where we can try to make friends again, or at least get some solid proof of the network being to blame! Azure Network Watcher is one of those features that helps bring teams together for a nice group hug. With Network Watcher, you can monitor and troubleshoot using features such as these:
- Capturing network packets
- Validating IP flow for NSGs
- Generating network topology
What’s great about these features is that they put different teams in the driver’s seat for how to troubleshoot problems. If you create some VMs and then can’t connect to them, you can verify that there’s network connectivity. For developers, if your application can’t connect to a backend database tier, you can examine the NSG rules to see if there’s a problem. And network engineers can capture packets to examine the complete communication stream between hosts for more in-depth analysis.
Network Watcher works in tandem with the diagnostic logs and metrics discussed earlier in the chapter. Network resources such as load balancers and application gateways can also generate diagnostic logs. These logs work the same as application and system logs from a VM or web app. Logs are collated in the Azure portal for you to determine if there are errors in the configuration or communications between hosts and applications.
DNS and Traffic Manager also have a Troubleshoot area in the Azure portal. The portal guides you through some common errors that you may encounter, offers configuration advice, and provides links to additional documentation. If all else fails, you can open a support request with Azure Support.
Although it may often be easier to build large application deployments with Azure Resource Manager templates or with Azure CLI or PowerShell scripts, the Azure portal has a lot of great tools and features when things go wrong. Especially with complicated network configurations and security policies, a few seconds of your time to review the output from Network Watcher tools can identify an issue and let you resolve it quickly. All these tools help to improve the overall health and experience of your applications for your customers.
What are some scenarios where you may want to use Network Watcher and the troubleshooting features it offers? Let’s look a few common issues and see how Network Watcher could help.
12.3.1. Verifying IP flows
Here’s a common problem: customers can’t connect to your application. The application works fine when you connect from the office, but customers can’t access the application over the public internet. Why?
Azure virtual private networks (VPNs) provide secure communications between on-premises offices and Azure datacenters. Azure ExpressRoute provides high-speed, dedicated private connections from on-premises offices to the Azure datacenters and is often used in large organizations.
Both connections are a little more complicated to set up than we can cover in a single lunch break, and they’re also often things that you set up and configure only once. The network team is usually responsible for configuring these, and you may not even realize that you access Azure over a private connection.
All the testing of your application works great. You can access the application through a web browser, place orders, and receive email notifications. When your customers then go to place an order, the application doesn’t load.
How can Network Watcher help? By verifying IP flows. Network Watcher simulates traffic flow to your destination and reports back as to whether the traffic can successfully reach your VM.
To enable Network Watcher and verify IP flows, complete the following steps.
1. In the Azure portal, select All Services from the top of the Services navigation menu at left.
2. Filter and select Network Watcher from the list of available services. You enable Network Watcher in the region(s) that you wish to monitor. When you enable Network Watcher in a region, Azure uses role-based access controls (RBACs) for the various resources and network traffic.
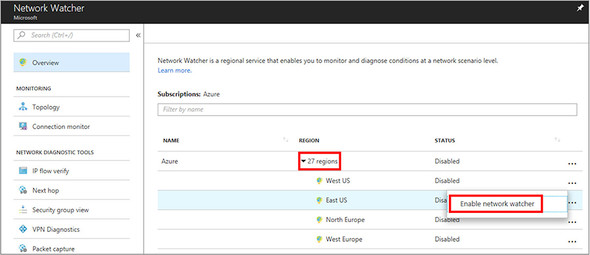
3. Expand the list of regions for your account, and then choose Enable Network Watcher for the same region as the VM you created in a previous exercise, as shown in figure 12.5.
Figure 12.5. From the list of Azure subscriptions (you probably have only one), expand the list of regions. From a security perspective, you should only enable Network Watcher in Azure regions that you need to monitor for a given problem. Network Watcher can be used to capture packets for other applications and services across your subscription if you enable the feature in many regions.
4. It takes a minute or two for Network Watcher to be enabled in your region. Once it’s enabled, select IP Flow Verify under Network Diagnostic Tools at left in the Network Watcher window.
5. Select your resource group, such as azuremolchapter12, and VM, such as molvm. By default, Protocol is set to TCP and Direction is Inbound. The Local IP Address of the virtual NIC is also populated.
6. For Local Port, enter port 80. If you accepted the defaults when you created the VM in the previous exercise, you didn’t open port 80, so this is a good test of what happens when traffic is denied.
7. Under Remote IP Address, enter 8.8.8.8. This address may seem familiar—it’s an open DNS server provided by Google. You aren’t doing anything with this server; you just need to give Network Watcher an external IP address to simulate traffic flow. You could also go to https://whatsmyip.com and enter your real public IP address. Set Remote Port to port 80, and then select Check, as shown in figure 12.6.
Figure 12.6. Select your VM, and provide a local port on the VM to test. In this example, you want to test connectivity to port 80 to simulate a common web application on the VM. The remote IP address can be any external address for Network Watcher to simulate traffic. What really happens is that Network Watcher examines the effective security group rules to validate if traffic could flow to the VM based on the source and destination IP addresses and ports.

The result of your IP flow check should be “Access denied.” Helpfully, Network Watcher then tells you which rule caused the traffic flow to fail: the DefaultInboundDenyAll rule. You know there’s a network security rule that blocks traffic, but where is this rule applied? At the subnet, virtual NIC, or application security group? There’s another Network Watcher feature that can tell you!
12.3.2. Viewing effective NSG rules
NSG rules can be applied to a single virtual NIC, at the subnet level, or against a group of VMs in an application security group. Rules are combined, which allows you to specify a common set of rules across an entire subnet and then get more granular for application security groups (such as “allow TCP port 80 on all webservers”) or an individual VM.
Here are some common examples of how NSG rules may be applied:
- Subnet level—Allow TCP port 5986 for secure remote management from management subnet 10.1.10.20/24.
- Application security group level—Allow TCP port 80 for HTTP traffic to web applications, and apply the application security group to all web application VMs.
- Virtual NIC level—Allow TCP port 3389 for remote desktop access from management subnet 10.1.10.20/24.
These are basic rules, and they explicitly allow certain traffic. If no allow rules match a network packet, the default DenyAll rules are applied to drop the traffic.
During the testing of the application discussed in the example, you may have configured that HTTP rule to only traffic from one of your on-premises subnets. Now, customers over the public internet can’t connect.
To determine where an NSG rule is applied, complete the following steps.
1. In Network Watcher, select Security Group View at left.
2. Select your resource group, such as azuremolchapter12, and your VM, such as molvm. It takes a few seconds for the effective rules to be displayed, as shown in figure 12.7.
Figure 12.7. When you select a VM, Network Watcher examines how all the NSG rules are applied and the order of precedence, and shows what effective rules are currently applied. You can then quickly drill down to the subnet, virtual NIC, and default rules to find and edit where a given rule is applied.

The default rules from the VM you created earlier aren’t exciting, but you can move through subnet, network interface, and default rules to get a feel for the way that effective rules are combined and how you could identify where rules are applied if you need to make changes.
12.3.3. Capturing network packets
Let’s assume that you updated your network security rules to allow access to your application for public internet customers, but one customer reports they experience odd behavior. The web application sometimes doesn’t load, or displays broken images. Their connection often appears to time out.
Intermittent problems are often the hardest to troubleshoot, especially if you have limited, or no, access to the computer that encounters a problem. One common troubleshooting approach is to capture the network packets and review them for signs of any problems such as network transmission errors, malformed packets, or protocol and communication issues.
With network packet captures, you get the raw stream of data between two or more hosts. There’s an art to analyzing network captures, and it’s not for the faint hearted! Special third-party tools such as Riverbed’s Wireshark, Telerik’s Fiddler, and Microsoft’s Message Analyzer provide a graphical way for you to view and filter the network packets, typically grouping them by related communications or protocols. Figure 12.8 shows an example of what a network packet capture looks like.
Figure 12.8. A network capture when viewed in Microsoft’s Message Analyzer. Each individual packet is available for inspection. You can group and filter by communication protocol or client-host. This depth of network data allows you to examine the actual packets that flow between nodes to troubleshoot where an error occurs. A former colleague once told me, “The packets never lie.” The puzzle is to figure out what the packets tell you.

To enable Network Watcher to capture packets to and from your VMs, first install the Network Watcher VM extension. As you saw in the previous section, VM extensions provide a way for the Azure platform to reach inside a VM to perform various management tasks. In the case of the Network Watcher extension, it examines network traffic to and from the VM.
To install the Network Watcher VM extension and capture network packets, complete the following steps.
1. In the Azure portal, select Virtual Machines in the menu on the left, and then select your VM, such as molvm.
2. Under the Settings category at left in the VM window, select Extensions. Choose Add an Extension.
3. In the list of available extensions, choose Network Watcher Agent for Windows, and then select Create. To confirm the extension install, select OK.
4. It may take a few minutes for Network Watcher Agent to be installed on your VM. To go back to the Network Watcher menu in the Azure portal, select All Services at the top of the Services navigation menu at left in the portal, and then choose Network Watcher.
5. Under Network Diagnostic Tools at left in the Network Watcher window, select Packet Capture, and then choose Add a New Capture.
6. Select your resource group, such as azuremolchapter12, and VM, such as molvm. Enter a name for your packet capture, such as molcapture.
By default, packet captures are saved to Azure Storage. You can also choose Save to File and specify a local directory on the source VM. The Network Watcher Agent extension then writes the packet capture file to disk in the VM.
7. If it isn’t already selected, choose the storage account name that starts with the name of your resource group, such as azuremolchapter12diag739. This is the storage account created and used by the VM diagnostics extension that you enabled earlier.
8. You can specify a maximum file size for the packet capture (default is 1 GB) and maximum duration for the packet capture (default is 30 minutes). To only capture traffic from specific sources or ports, you can also add a filter to narrow the scope of your packet captures.
9. Set Duration to 60 seconds. To start the packet capture, select OK, as shown in figure 12.9.
Figure 12.9. When you start a packet capture, you can save the data to Azure Storage or a local file on the VM. You can also specify a maximum size or duration of the packet captures. To limit captures to particular addresses or ports, you can add filters and define your specific needs.

It takes a minute or two to start the capture. When the capture is in progress, the data is streamed to the Azure Storage account or local file on the VM. The list of captures is shown in the Network Watcher portal page. If you stream the logs to Azure Storage, you can have the capture go straight to the Storage account and download the .cap capture file. You can then open the packet capture in an analysis program as discussed earlier. In fact, the example network capture shown earlier in figure 12.8 was from an Azure Network Watcher packet capture!
12.4. Lab: Creating performance alerts
The VM diagnostics, metrics, and Network Watcher features have hopefully given you some insight into what’s available in Azure to help you troubleshoot application problems. Some things, like boot diagnostics and the VM diagnostics extension, make the most sense when you enable and configure them as you deploy VMs. In this lab, you configure some metric alerts to see what you can be notified about and what the alerts look like when you receive them:
1. In the Azure portal, browse to the VM you created in the previous exercises. Under the Monitoring section for the VM, select Alerts.
2. Choose Add Metric Alert, and then create an alert when the Metric of Memory\% Committed Bytes in Use is Greater Than a Threshold of 10 Percent Over the Last 5 minutes. A chart should show you what the latest metrics are, so adjust the threshold if 10% wouldn’t trigger an alert.
3. Check the box to Email Owners, Contributors, and Readers.
4. Wait a few minutes for the alert notification to come through. Anyone with RBAC permissions to the VM would receive this notification.
5. To scope the alert notifications, edit the alert rule to instead notify via Additional Administrator Email(s), and specify a different email account than the one associated with your Azure subscription. This approach simulates how you can send notifications to a specific support address or a distribution list of application owners, for example.
6. Depending on your role and involvement in the VM and application management, you can explore how to generate alerts based on Azure log entries. Select your VM, and then Alert rules again. This time, choose Add Activity Log Alert. Look at the available options for what Azure services and actions can be used to generate alerts. Try to create an alert when your VM is restarted, as shown in figure 12.10.
Figure 12.10. Create an alert when a security event for your VM records a Restart Virtual Machine operation.
