
When your code runs in CIL, you can only debug it using the Visual Studio debugger. Of course, you should have Visual Studio 2010 installed, along with the Visual Studio tools that come with the Microsoft Dynamics AX 2012 installer.
To start Visual Studio with the intention of debugging the CIL code, perform the following steps:
- Open the Microsoft Dynamics AX Configuration Utility.
- In the Configuration Target combobox, select Local client.
- In the Configuration combobox, select the configuration that points to the AOS you want to debug. Then click on OK to close the utility.
- Right-click on the Visual Studio 2010 icon and click on Run as administrator.
Visual Studio will launch, and you should see Visual Studio along with the Application Explorer window as shown in the following screenshot:
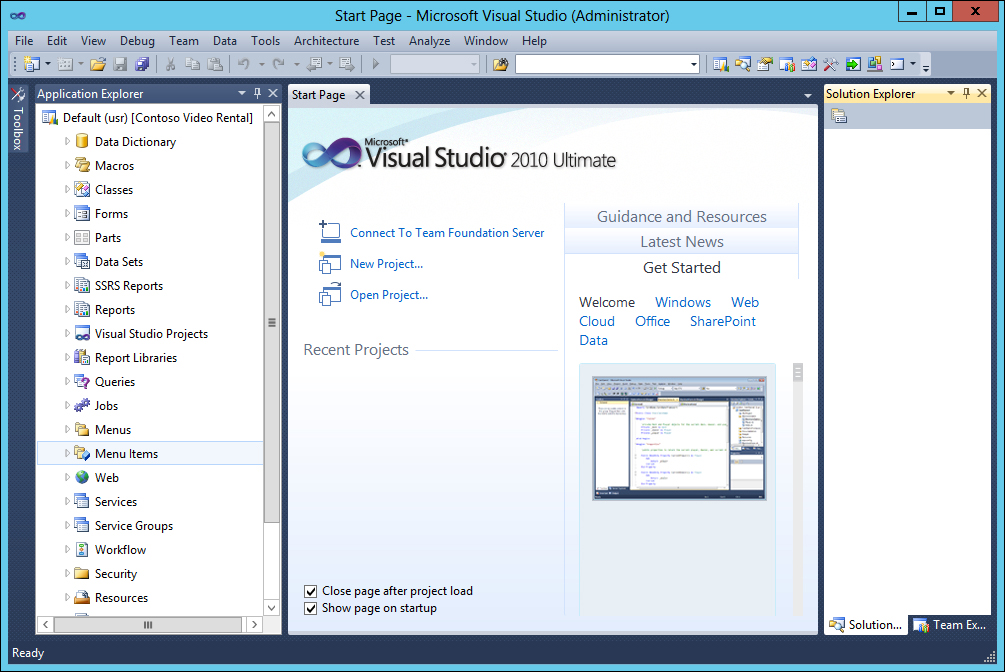
If you can't see the Application Explorer window, activate it by going to View | Application Explorer or using the shortcut Ctrl + D + Enter.
The Application Explorer window shows you the AOT. At the top of the window, you can see the layer and model that the user is working in. The word Default indicates that the active client configuration was used by Visual Studio to determine which AOS to connect to.
It is also possible to connect to other AOSes by performing the following steps:
- Create a new shortcut to Visual Studio 2010, for example, on your desktop.
- Right-click on the shortcut, then click on Properties.
- Edit the Target property as follows by adding either a reference to an AXC file or the name of the configuration you want to use:
- When you want to use an AXC file, add the
/AxConfig "C:<location><yourconfiguration>.axc"reference. - When you want to point to the configuration named
AX60Debug, add the/AxConfig AX60Debugreference.
- When you want to use an AXC file, add the
When you start Visual Studio 2010 using the shortcut you just created, you should see the name of the configuration instead of Default in the Application Explorer window.
Starting Visual Studio with the Application Explorer window connected to the right AOS isn't enough to start debugging. You must also point Visual Studio to the process you want to debug. In our case, this is Ax32Serv.exe, which is the process of the AOS.
You can do this in Visual Studio by going to Debug | Attach to Process.... The following screenshot will appear:
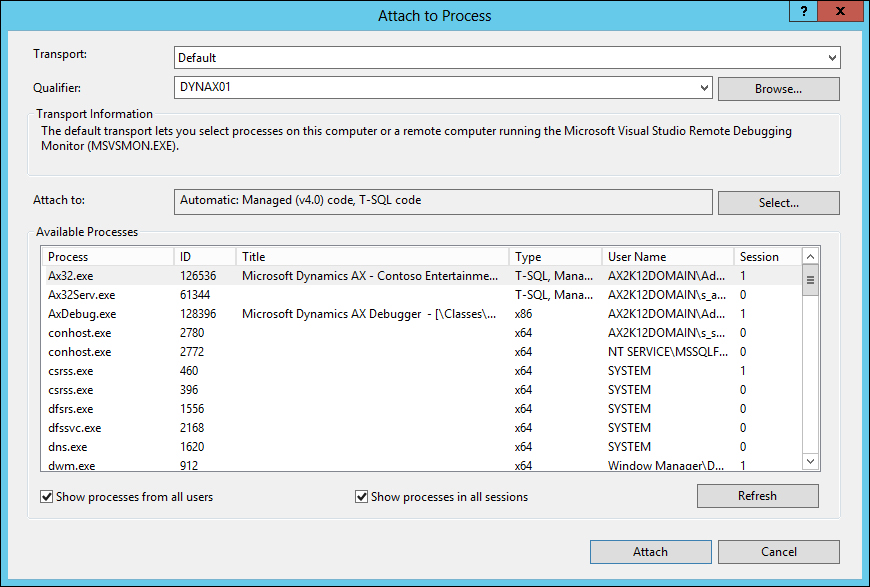
As you can see, it lists processes that are running, including Ax32Serv.exe. If you do not see the process, enable the
Show processes from all
users and Show processes in all sessions checkboxes.
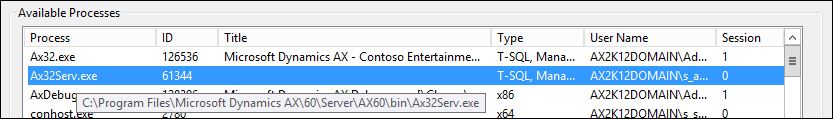
When you have more than one AOS server running, you can identify the process by hovering your mouse cursor over the process. It will show the path of the process as seen in the following screenshot:
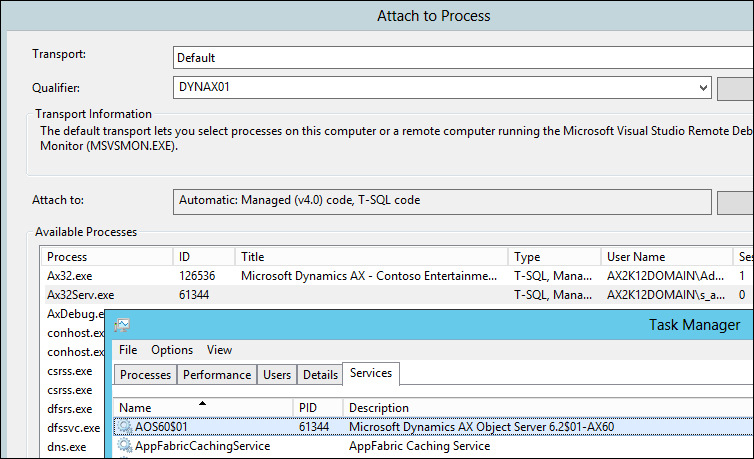
Alternatively, you can also look up the process ID on the Services tab of the Windows Task Manager. As you can see in the following screenshot, the ID of the process in the Attach to Process window is the same as the PID in the task manager, allowing you to identify the process:
Once you have determined the correct process, click on the Attach button. This will display the following Attach Security Warning screen:
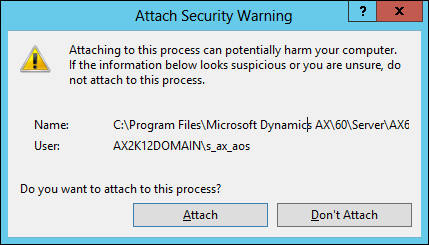
Clicking on the Attach button will attach the Visual Studio debugger to the AOS process, so we are now ready to set some breakpoints, which is what we will do next.
Setting breakpoints in the Application Explorer is as easy as setting breakpoints in the AOT. As an example, we will debug the Title service that we created in Chapter 4, Custom Services. Perform the following steps to set a breakpoint for this service:
- In the Application Explorer window, expand the Classes node.
- Navigate to the CVRTitleService class and expand that node.
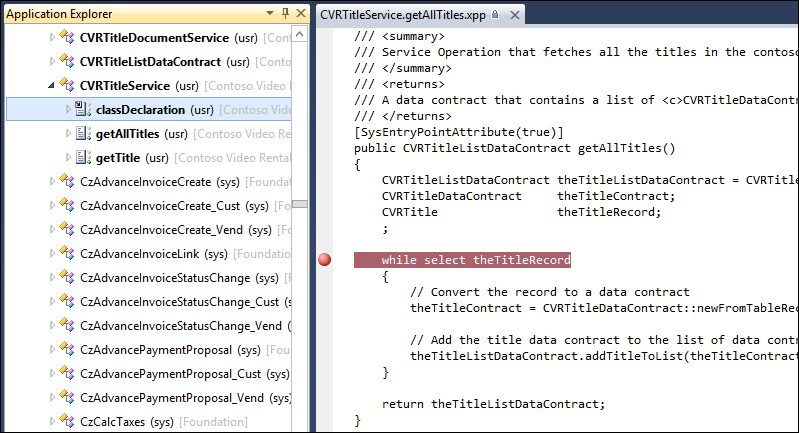
- Double-click on the getAllTitles method; this will show you the source code of that method.
- To set a breakpoint for this method, position your cursor on the line where you wish to set a breakpoint and press F9. Alternatively, click on the margin to the left of the code to enable or disable breakpoints.
The result should look as follows:
With the debugger attached and a breakpoint set, we are ready to run our service. To run the Title service, perform the following steps:
- Open a new instance of Visual Studio 2010.
- Go to File | Open | Project/Solution.
- Select the solution
VisualStudioChapter4DynamicsAxServices.CustomDynamicsAxServices.Custom.sln. This solution is part of the code that can be downloaded for this book. - In the Solution Explorer, right-click on the DynamicsAxServices.Custom.Titles project and then click on Set as StartUp Project.
- Press F5 to run the project.
The instance of Visual Studio where we had set a breakpoint will pop up because the breakpoint was hit. The next line of code that will be executed is indicated with a yellow arrow, just as is the case in the Dynamics AX debugger, as seen in the following screenshot:
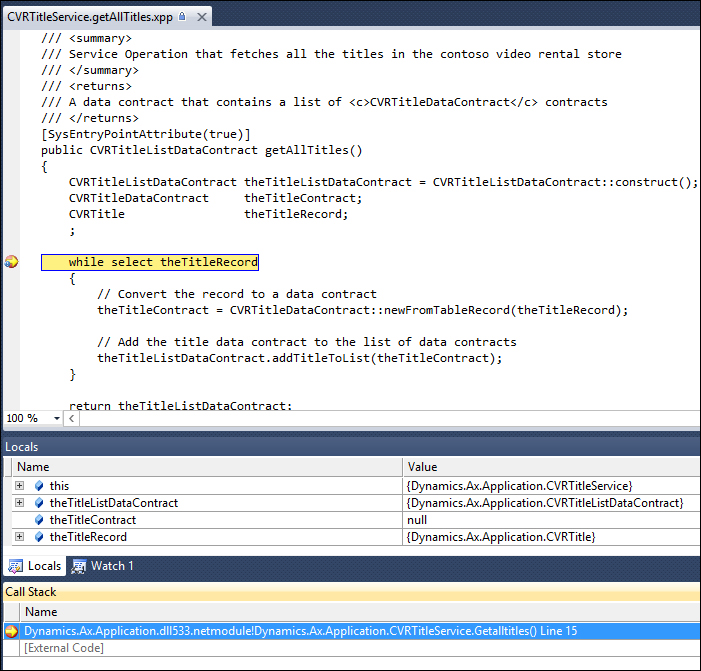
As you can see, it shows the X++ source code, the call stack, and all the variables with their values. The shortcuts used for debugging, such as F10 and F11, are the same in Visual Studio as in the Dynamics AX debugger, so the experience for any Microsoft Dynamics AX developer from here on is going to be very straightforward.
Note that during the debugging of the CIL code, the AOS server will be unresponsive. This will cause other clients that are connected to the instance on which you are debugging to also hang. Because of this, you should only debug CIL on a developer machine. This is also one of the reasons why Microsoft recommends a development topology where every developer has his own development environment.
Tip
Remote debugging
If you don't want to install Visual Studio on every AOS server that you want to debug, you can use remote debugging with Visual Studio. After a simple setup, the process of debugging will be the same as on a local AOS. For information on how to set this up, visit the How to: Set Up Remote Debugging page on MSDN at http://msdn.microsoft.com/en-us/library/bt727f1t(v=vs.100).aspx.