
Although performance is quite important, it is often not given much thought until there are performance problems. Sometimes, efforts to improve performance are deliberately postponed until later in the project in order to free resources for other tasks. On the other hand, many developers may feel that performance should be given more attention but are unsure how.
This brings us to the Tracing cockpit and the Microsoft Dynamics AX Trace Parser. These are perhaps the most underused and underrated tools available to Microsoft Dynamics AX developers, but they are tools that developers should be using on a daily basis. Before you submit your code for testing, consider using the Tracing cockpit so you can detect and fix obvious performance problems before they cause any real problems.
The Tracing cockpit is a tool used to measure the overall performance of your code. When it is running, it collects information such as the time spent on each method, the number of round trips made to the database, and the time it took to execute those calls. This information is stored in an ETL (Event Trace Log) file, which can be interpreted by the Microsoft Dynamics AX Trace Parser. Although it is not purposely built for tracing services, it is useful to improve the performance of your services. That's why we will take a look at it next.
We will use the Title service as an example, so open the DynamicsAxServices.Custom.sln solution in Visual Studio. This is the same solution we used to test the Visual Studio debugger. It is important that you set up everything to right before the point when you want to start your trace. As you can imagine, tracing every X++ method and SQL statement that is executed could lead to a large amount of data. This would take up a lot of hard disk space and would be too time consuming for you to analyze.
With the Visual Studio project ready to run, open the developer workspace in the Microsoft Dynamics AX client and go to Tools | Tracing cockpit. You should see a screen similar to the following:
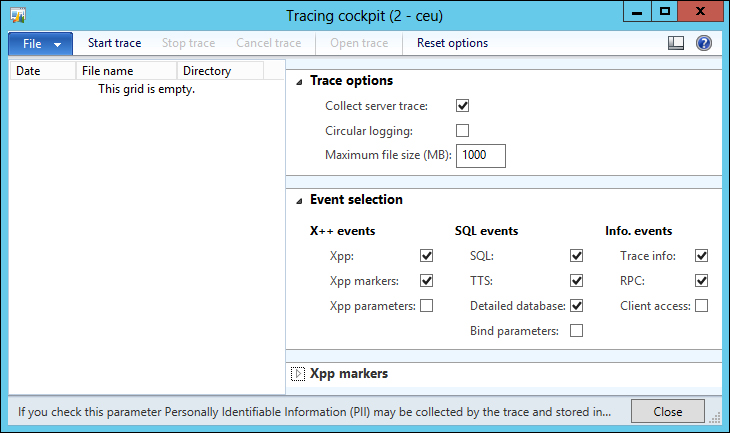
On the right-hand side are the different options you can configure. We won't go over them all because the default options suffice most of the time. One option that is very interesting is the Bind parameters option. With this parameter disabled, the SQL statements that are traced will have the values in the where clauses replaced by a question mark. This ensures that no sensitive data ends up in the trace file. When you want to see the real values that were used, enable this option. This then allows you to copy the statement from the trace and run it using a query on Microsoft SQL Server, at which point you can examine it further using the tracing options that Microsoft SQL Server has.
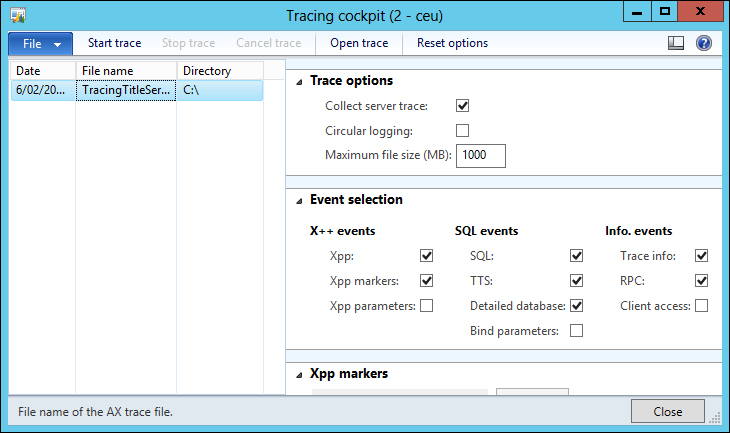
When you are done configuring the options, click on the Start trace button. Specify a filename and click on Save. Next, go to Visual Studio and press F5 to run the project. When it has finished running, return to the Tracing cockpit and click on Stop trace. A new record will be created as shown in the following screenshot:
To view the trace, click on the Open trace button. If this is the first time you are opening a trace file using the Microsoft Dynamics AX Trace Parser, you will see the following screen:
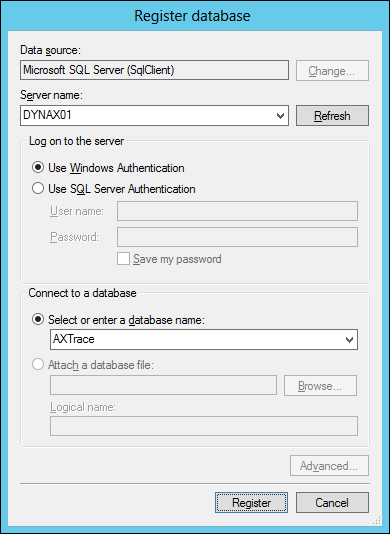
What happens is that the Microsoft Dynamics AX Trace Parser tries to import the trace file into a database for analysis. Because this is the first time you are importing a trace, no database exists yet; so, create a database by specifying the server you want to create a database on in the Server name field. In the Select or enter a database name field, enter the name of the database you want to use. If you specified a nonexisting database, a new database will be created with that name, which is AXTrace in our case. Click on the Register button to register the database. Confirm the creation of the database when prompted.
After a short time, depending on how large the trace file is, you will be presented with the following screen:
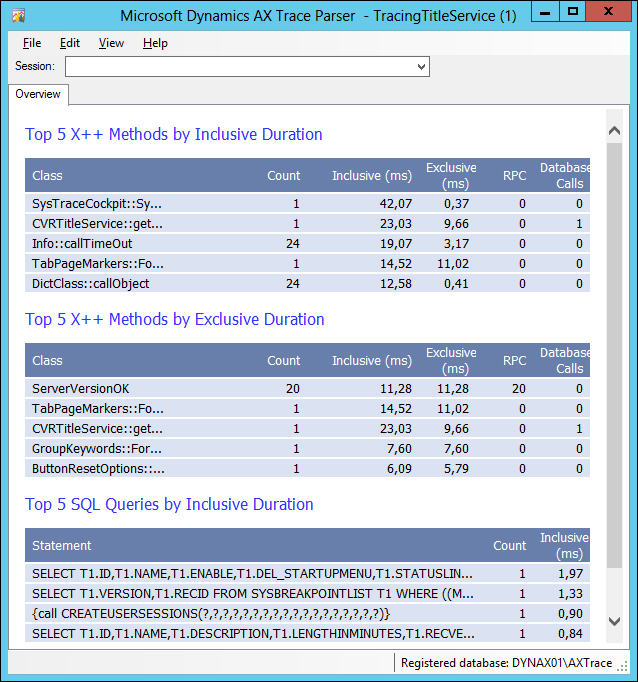
As you can see, a summary of the most costly X++ methods and SQL queries has been presented. From this, we can already observe the following:
- The service operation took 23.03 milliseconds to complete and retrieved all the titles using one database call
- The database call to retrieve the titles took 0.84 milliseconds
If you want to see the details of the trace, select the appropriate session from the Session drop-down box. This will allow you to view many more tracing details.
Note
This demo should be enough to get you started with the Tracing cockpit. An excellent overview of the major features of the Tracing cockpit can be found on Dynamics Ax Performance Team Blog on the Walk through major features of Microsoft Dynamics AX 2012 Trace Parser (Part 2) page at http://blogs.msdn.com/b/axperf/archive/2011/09/06/walk-through-the-major-features-in-microsoft-dynamics-ax-2012-trace-parser-part-2.aspx.