
With respect to the database design, we don't need to use Visio. On one hand, part of the functionality linked to reverse engineering databases in Visio was deprecated as of version 2013 of the product. On the other hand, Microsoft moved a big part of this functionality to Visual Studio itself, as we mentioned in Chapter 6, SQL Database Programming, when reviewing the data access capabilities of the IDE.
Actually, we can even use SQL Server Management Studio (SSMS) to generate a graphic schema of the data required for our purposes using the Database Diagrams feature of the tool.
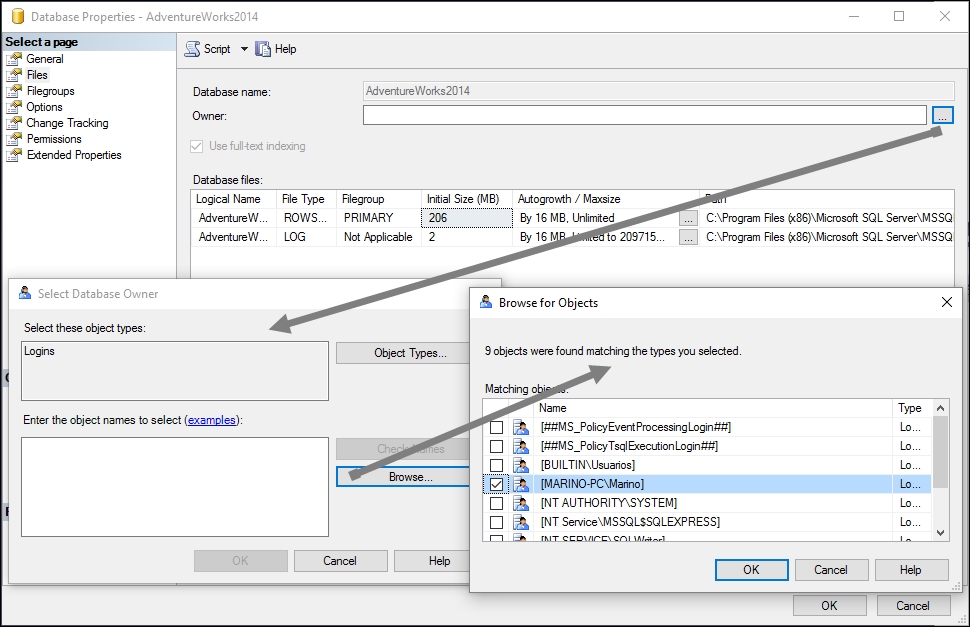
We should make sure that the database has a valid proprietary linked to a valid login. If you didn't assign one to the database to be used, you can assign it in the Properties dialog box of every database listed in the Object Explorer. Inside the Files page, you should select a valid owner. The next graphic shows the process:
SSMS could still ask you about installing the required objects to manage diagram creation, and once they're accepted, you'll be able to generate a new schema.
By default, we'll have a blank schema in the editor, where we can select the tables implied in the process. I'm selecting just a couple of tables (SalesPerson and SalesTerritory) to show the relation between them in the schema along with some other capabilities.
The resulting schema should look similar to what is shown in the following screenshot. Note that the edition surface offers several options in the contextual menu, where you can add comments, other tables (not yet selected), view the details of the relationships between tables, and so on:

Observe that the editor automatically recognizes all tables' relations (in this demo, the foreign key relation named FK_SalesPerson_SalesTerritory_TerritoryId and the configuration details of any selected object are presented in the Properties window, as usual).
You might need to refresh the Object Explorer, so SSMS recognizes the new diagram after you save it. If you make any modifications to the diagram that imply a change in the structure of the database, the new configuration will be checked before saving, using the values that appear in the Properties window. Should any change be incompatible with the current restrictions, the diagram won't be saved.
Later on, we create a new ASP.NET MVC application in order to use these two tables and access their data from web pages. At creation time, when we add a new ORM model using Entity Framework in the way we saw in Chapter 6, SQL Database Programming, we'll get a similar diagram (not exactly the same but basically containing the same information). We don't show it here since it has nothing meaningful with respect to the previous output.
However, in this new diagram from inside Visual Studio, you will have access to other information related to the code the IDE generates in order to facilitate programmers with access to the database and use the Entity Framework libraries.
Such information, visible from the IDE's Properties window, might show you interesting and specific data in relation to the objects we have selected for our diagram. This includes the template used in code generation, the code generation strategy, the name of the Entity Container, and several Boolean values (most of them changeable), indicating all aspects of such code. Refer to the following screenshot:

Since our goal here is not the code itself but the process of creation and the deliverables you might generate when following the MSF, I'm going to instruct Visual Studio to generate all the scaffolding for a complete CRUD set of operations with these two tables. The generated code will then be used to reverse-engineer the resulting site from Visio and create other useful schemas.
So, I'll proceed as explained in Chapter 6, SQL Database Programming, and ask the IDE to generate all this functionality from the Add Controller option for each of the tables selected here. It's a good practice to check the resulting files and test the basic functionality.
The only real change in the code I'll make at this point will be to add two new links in the main page (remember the _Layout.cshtml file), so these new options can be accessed directly from the landing page.
I also made some changes to the default information presented by the template, just to reflect the basic information offered by this demo instead of the template's information. However, the only operational changes will consist of adding a couple of links so that CRUD operations can be reached from the main page.
Thus, I'll use two ListItems with ActionLink helpers to generate the new entries in the main menu and check whether they work properly, linking to the Index action method for each generated controller.
As usual, these lists show the complete list of records for every table, and other links are generated automatically (Edit, Details, and Delete for each individual record, plus an option at the top to create a new record). The code is pretty simple in this case:
<li>@Html.ActionLink("Sales Person Info", "Index", "SalesPersons")</li>
<li>@Html.ActionLink("Sales Territory Info", "Index", "SalesTerritories")</li>
After checking the preceding functionality, we'll terminate the project at this time (refer to the following screenshot):

There's more in the design phase, that can be solved using Visio resources and tools. Now, we have a working website to test some of the capabilities of Visio in order to reverse-engineer a website.
Visio offers two different types of web templates: Conceptual Web Site and Web Site Map, as you'll find out when searching for the available templates.
The first one is the type of schema that some developers like to create before any other code action. That is, it lets you define the distinct components of the website and helps you with the configuration of each one, defining its shapes and fields:

The website map, however, can be created from scratch, or it can be reverse-engineered, instructing Visio to read the file information from an already existing website. Actually, if you create a new diagram starting from this template, you'll be offered the possibility of reading the information from an existing website.
Since there are many factors involved in such task, a Settings… button at the bottom lets you tune the way Visio should try to read the information. For this demo, since we have not published our site to any real hosting service, we can use the localhost:port configuration to configure Visio as to where to look for information.
Another important trick is that you should reduce the number of levels to two (in general). Finally, we can add the extensions for the Razor engine so that these files are recognized and analyzed properly.
As you'll see, many other aspects are available: the selection of communication protocols, the types of resources that appear in the list, the kind of layout to build the graphic tree, and so on:

After a few seconds, you will be presented with a new diagram containing all the selected resources present on the website.
This final schema will be organized in just the same manner as the website, that is, hierarchical, starting from the initial URL and going top-down through all the levels, as indicated in the previous configuration (be careful with this value in some scenarios, or it could take a while to finish checking all possible links generated by the schema).
Another useful configuration refers (take a look at the figure) to the number of links to be analyzed. 300 is more than enough for this demo, but depending on the site, you might miss some of them (especially those located at the deepest levels).
Besides, once the tree is created, you can tune up different views of that tree and do further research with the help of a couple of tools that Visio enables by default: FILTER WINDOW and LIST WINDOW. Both appear collapsed next to the editing surface resulting from the process.
Another aspect to watch is the size of the diagram. You can make it as big as you please, but by default, the schema fits in the available space (no matter how big the site is), so you might find the resulting graphic quite reduced (of course, the zooming tool will let you see it the way you prefer).
Overall, the result should look similar to what is shown in the next capture (although I've changed the size and retouched some entries to make them more visible):

When you dig into the image, all details show up, and some aspects should be noted. In the areas pertaining to the SalesPersons and SalesTerritories controllers, you'll find as many links as registers are present when the Index action method returns, for example.
This means that for a very long listing, the number of graphics could be unmanageable. That's why limiting the number of links to 300 happens by default.
With such a complex schema, the location of individual elements can be challenging if you do it directly from the shape. This is where LIST WINDOW comes in handy:

You just have to locate any item in the list and double-click on it; the graphic will locate and move to that element, showing its details.
Once the item is expanded, there's a bunch of available options that you can use. You'll find another collapsible window (Shape Data), which shows all the fields associated with the element of choice (the element, usually docks to the upper-right corner of the editing surface).
You can also expand the corresponding link to see which elements will be active when the view is being presented.
Even better, you have a contextual menu, which includes the Interactive Hyperlink Selection option. If you click on the link, a new window will open up, presenting the real page at runtime that you would see if that link is selected. Refer to the screenshot corresponding to the SalesTerritories/Edit/9 URL:

The most useful aspect of this feature is that the window is not a read, view-only snapshot, but it lets you really change the information and will operate just the same as the real page in execution.
For example, if you try to change some data and there's some incompatible information in the fields, the form will not be sent, and the error messages will show up, indicating the problem, as you can see in the following capture, in which a string is introduced where the field expects a number:

Besides, we also have the choices offered by FILTER WINDOW, which permits the activation/deactivation of links and scripts in order to reduce the number of elements shown in the diagram:

Overall, we count on a wide number of possibilities, which only start when the initial diagram is drawn.
With all these possibilities, we can gather a good number of deliverables to accompany our project's documentation, but Visio offers some extra functionalities in order to enhance our documentation.
One option is the possibility of generating reports in several formats (Excel, MS Access, Visio Graphics, among others), starting with the current shapes we're editing.
Since these reports can also be linked, you can refresh the information as changes take place in the project. To create a new report, we just have to move to the Web Site Map tab in Visio's main menu and select Create Report.
We can select an entire report, which includes all the elements selected in the map (what Visio calls Inventory), or we can create partial reports in order to take care of distinct aspects, such as generating only a Links Report or even a broken links report in the Web Site Map tab with the Links with Errors option.
In any case, we'll be offered a final format to save the information, which can be an Excel Sheet, a Visio Shape, an HTML page, or an XML file. If we choose HTML files, they can easily be published to a corporate Office 365, a project's dedicated SharePoint site, or just to any website convenient for our team.
The next screenshot shows a web page generated in this way, including all the links discovered on our site. A basic table is presented, although you can tune all aspects of the generator, including the type of errors you want to exclude, and so on:

If you are not used to working with Visio, you'll have noticed a large number of other possibilities in order to visually express the distinct aspects of a project life cycle. Many are present since previous versions, but the company has enhanced and extended the number of options and functionalities in a meaningful way.
For example, since the first versions, Visio has the ability to create and update Calendar and Time diagrams in order to manage schedules and timetables, such as PERT and Gantt diagrams.
Gantt diagrams, for example, let you control project management, task management, agendas, schedules, timetables, goal settings and, in general, a project's lifecycle. Different templates are available: subtasks with the calendar, a simple task waterfall, and so on. The following screenshot shows the starting aspect of one of these templates:

Of course, you also have configurable calendars in which you can insert all types of data for every date in order to extend control in a much more detailed manner.
In relation to business processes, we find several solutions (Flow Charts, Organizational Charts, and so on), but it's worth noting that Visio now offers support for business standards as well.
The standard BPMN 2.0 is fully supported, and it offers several templates to represent the participants in the process:
- BPMN Diagrams (start from scratch)
- BPMN Process with Gateway (for processes that include a gateway with two outcomes)
- BPMN Process with Multiple Roles (for cases where there is more that one major participant)
- BPMN Address Change Process, which the tool recommends when a process participant includes more that one role or function
Note
The main statement of the standard defines BPMN, stating a standard Business Process Model and Notation (BPMN) will provide businesses with the capability of understanding their internal business procedures in a graphical notation and will give organizations the ability to communicate these procedures in a standard manner.
It's interesting to note that these graphical proposals complement other classical schemes, especially certain UML diagrams (such as Activity diagrams or Sequence diagrams), helping clarify some business flows in more detail.
The default BPMN Address Change Process template is a perfect example of this (refer to the following screenshot):

Let's take a look at what this process means: a customer changes her address and notifies a bank about it. There are three roles implied because Help Desk passes this new information to Processing Center, which, in turn, sends a confirmation to Help Desk, which sends changed confirmation to the client (the bank's task ending right there). This can be expressed using a UML Sequence Diagram as well (and even a Use Case Diagram, since it implies three actors).
So, a basic UML Diagram can express the initial scenario, and we can use a more detailed BPMN diagram to be more precise about the specifics of the task steps and completion.
If you prefer to follow the diagrams proposed by OMG Universal Modelling Language (OMG UML) (now in version 2.5), you'll also find excellent support for all types of diagrams defined by the specification (both in Visio and Visual Studio as well).
Note
If you're interested in the current state of the UML Standard, the complete specification is available at http://www.omg.org/spec/UML/Current.
That is, we can design diagrams for Use Cases, Classes, Activities, Sequences, and UML State Machines since all the required artifacts are present in the related templates and extra shapes.
Just take a look at the More Shapes/Software and Database/Software menu to find all these templates and the shapes the standard defines for them.