
Visio is not the only tool to help the architect in designing and organizing a software project. All versions of Visual Studio include extra tools (depending on the version) in order to aid these tasks in different ways.
If you have the Visual Studio Enterprise Edition that I'm using now, you'll find three main menu options in relation to this:
- Architecture: Options for Code Map generation and UML diagramming (with support for all types of diagrams we just mentioned)
- Testing: A set of tools for testing, including specific, focused dialog boxes and artifacts
- Analysis: This covers Node.js profiling, code metrics, and code analysis, among other features.
In order to maintain good coding velocity and prevent technical debt, improvements in your application's architecture are crucial. Moreover, understanding the impact of a potential change in the code is fundamental at the time of deciding whether a change should be done, and if so, what the consequences will be.
A first step is to generate a code map for the current solution. You can do it in two ways: generate it from scratch or use the Generate Code Map for Solution option. If you opt for the latter, a new DGML editor window will show up and a complex map will show the roots of the two main nodes: the DLL itself where our code is compiled (WebApplication1.dll), and another node called Externals, where you'll find the relation of the DLLs used in the project.
You'll have to expand both nodes to understand the entire picture and their relationships. Refer to the following screenshot:

This type of diagrams are extremely useful in order to quickly view the main elements your application is made of. But it gets even better when we expand the nodes and identify our controllers or other configuration elements of the application.
Since every node can be expanded, we can go deeper until we reach any class' member and its dependencies. If you double-click on any node, a new window will open with the matching source code and the caret located exactly where that member is defined.
This ability gives us a distinct look at the code and its relationships, where it's possible to quickly identify which member is being used by which and which libraries a class depends on, among other useful information.
The following screenshot illustrates this, marking two factors of interest: our controllers and the application's configuration classes:

If you inspect the node's details, you'll see that you can keep on going deep down until you get all the details of the element checked.
Also, in the Layout submenu of the DGML editor, you can find extra analyzers to check for circular references, finding hubs or identifying unreferenced nodes.
Besides, the Filters window, which shows up next to the Solution Explorer, presents a list of the element types included in the diagram, all marked by default. To get a better understanding of what you have, you can unselect elements and the diagram will update automatically to show a new diagram, giving you the ability to change or save any view separately for a later study.
There's much more functionality available, as you'll see when you go through the distinct options of the editor.
The other main feature of this menu is UML diagrams. It allows you to create a separate project, modeling project, based on the UML diagram of your choice or add the new diagrams to an existing project (refer to the screenshot):

One of the most interesting features of Visual Studio Enterprise (and, also in some other versions) is the capability to create class diagrams from the existing code. It was originally linked to UML Class diagrams, but now it belongs directly to the class diagramming features as a separate template.
For example, we can create a new class diagram for our project from the New/Class Diagram option in the Add menu. This will take you to a new editing surface, where you can drag and drop classes (just our classes and not the files they're stored in).
The editor will reverse-engineer our classes, so we can easily have our controllers' diagrams in three simple actions and come up with a figure like this:

Overall, we have a complete infrastructure to express the details of our solutions and comply with the life cycle frameworks: either we use MSF or any other option.
Testing is about checking the quality of a product. Numerous techniques allow a programmer to test software, although the first actions should define exactly what is to be tested.
There are many approaches to testing: unit tests, regression tests, behavioral tests, integration tests, cyclomatic complexity tests, and many others, although unit tests are probably the most used among programmers.
Unit tests verify the correctness of a function under certain assertions that the tester establishes using sentences expressed in the same language as the rest of the solution but specifically intended to launch a test engine.
In the Agile Development Model (and in Extreme Model), part of the development phase adheres to the Test-Driven Design paradigm. In that model, you test units of implementation (functions, classes, or modules), expecting a correct execution of the unit in a way that drives the code that follows.
In the alternative model named Behavior-Driven Design (or BDD), we understand by behavior how a use case is resolved and completed, giving the process a collaboration context that extends the results to nonprogrammers (for instance, it can be shared with the user experience part of the Team Model).
Visual Studio offers wide support for testing, that's focused on unit tests and the most popular testing techniques. Let's review the way it works using a new ASP.NET MVC application.
The recommended procedure to test our application in Visual Studio would be to create our application and indicate—at creation time—that we're going to use a test project as well.
To simplify this explanation and, at the same time, make it easier for you to check this feature, I'll create another MVC project, but this time, I'll make sure that a test project is selected from the beginning in parallel to the main one (refer to the following screenshot):

Tip
It's not absolutely necessary, but strongly recommendable, that you create a separate project for testing. This will also help other members of the team if you consider that testing integrates extremely well with Team Foundation Server, and you can program the cadence and types of test to perform, assign responsibilities for the results, and so on.
Inside the test project, a new class is created by default in order to test the Home controller named HomeControllerTest. It contains three methods, with the same names as the action methods included in the controller.
Observe, however, that both class and methods are marked with attributes [TestClass] and [TestMethod], respectively. This indicates the test engine, which members are part of the testing goals, and which ones should be only considered helper elements that collaborate in the testing process.
Now, it's time to compile the solution (both projects) and open the Test Explorer window that you'll find in the Test/Windows menu. After a few seconds, the test engine will detect all the tests available in the solution and show them in the upcoming list.
Note that you will be offered a menu that lets you run all the tests or just the one selected or even create a playlist in which you indicate exactly which test you want to prove (all at once).
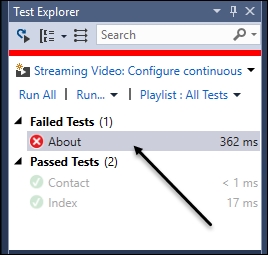
If you select only one test and run it, when the test succeeds, it will be marked Passed, and a new list will show the list of passed tests and the pending ones. For instance, after executing the test for the About method, you should see something like this:

After using the Run All option, the three tests should pass and be listed as correct. However, what if something goes wrong? To check what happens, change the string inside the About test method for any other string, and save the code.
After recompiling, you will learn how the test will not appear as passed; if you run the test, it will fail, and the second window of Test Explorer will present a list of references indicating what went wrong in order to give you a clue about how to fix the problem.
Keep in mind that tests can be debugged, as with any other code. This will surely give you more clues about what's wrong with the test and with your code.
Another aspect to keep in mind is that your testing project will have to add references to the project to be tested as well as namespaces, such as using Microsoft.VisualStudio.TestTools.UnitTesting. In this demo project, Visual Studio does that by default, but if you add a new testing project, those references will depend on you:
Finally, let's mention that there are several different assertions that you can use (check the Intellisense after the Assert class) and also that you can opt for a different testing environment. A search for test in the Extensions and Updates menu will show you a number of other testing frameworks that Visual Studio admits, such as NUnit Test, Jasmine, Karma, and so on.
Some of them (NUnit, for instance) are valid for C# as well, and others are focused on other languages, such as Jasmine and Karma, which are very popular when testing JavaScript solutions.
The Analyze menu lets you calculate code metrics (such as the Cyclomatic Complexity, Depth of Inheritance, Class Coupling, and others), which offer other aspects or views of your code's quality.
You can also check the code in search for inaccuracies using the Code Analysis configuration in the project's properties window (a feature we've already commented on in Chapter 4, Comparing Approaches for Programming).