
Now that we have a shiny installation of Graphite and Grafana to look at, we need to put some data into it to be able to generate some graphs. collectd is a well respected metric collection tool, which can output metrics to Graphite. The core collectd application is very minimal, and it relies on a series of plugins to collect metrics and forwards them onto applications such as Graphite for storage.
Before we start collecting metrics from our Ceph nodes, let's install collectd on the same VM as where we installed Graphite and Grafana. We will do this to gain a better understanding of collectd and the process required to configure it. We will then use Ansible to install and configure collectd on all of our Ceph nodes, which would be the recommended approach if this was being rolled out in a production environment. We have the following code:
sudo apt-get install collectd-core
The preceding command will give the following output:

This will install collectd and a basic set of plugins for querying standard operating system resources. There is a sample configuration stored in the following location:
/usr/share/doc/collectd-core/examples/collectd.conf
It lists all of the core plugins and sample configuration options. It is worth reviewing this file to learn about the various plugins and their configuration options. For this example, however, we will start with an empty configuration file and configure a few basic resources:
- Create a new collectd configuration file using the following command:
sudo nano /etc/collectd/collectd.conf
- Add the following in it:
       Hostname "ansible"

       LoadPlugin cpu
       LoadPlugin df
       LoadPlugin load
       LoadPlugin memory
       LoadPlugin write_graphite

       <Plugin write_graphite>
          <Node "graphing">
              Host "localhost"
              Port "2003"
              Protocol "tcp"
              LogSendErrors true
              Prefix "collectd."
              StoreRates true
              AlwaysAppendDS false
              EscapeCharacter "_"
          </Node>
       </Plugin>

       <Plugin "df">
         FSType "ext4"
       </Plugin>
- Restart the collectd service using the following command:
sudo service collectd restart
- Now navigate back to Grafana and browse the dashboards menu item. Click on the button in the middle of the screen to create a new dashboard:

- Select Graph to add a new graph to the dashboard. An example graph will now appear, which we will want to edit to replace with our own graphs. To do this, click on the graph title and a floating menu will appear:

- Click on Edit to go to the graph widget editing screen. From here, we can delete the fake graph data by selecting the dustbin icon, as shown in the following three-button menu box:

- Now from the drop-down menu, change the panel data source to the graphite source we have just added and click on the Add query button.

- A query box will appear at the top of the editing panel, it will also have the three-button menu box like before. From here, we can toggle the edit mode of the query editor by clicking on the button with the three horizontal lines:
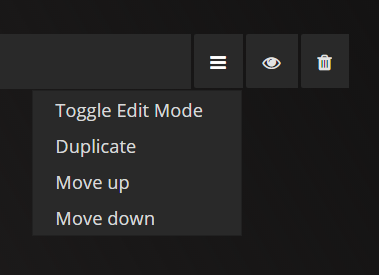
The Toggle Edit Mode option switches the query editor between click and select mode, where you can explore the available metrics and build up basic queries and the text editor mode. The click and select mode is useful if you do not know the names of the metrics and only want to create basic queries. For more advanced queries, the text editor is required.
We will first make a query for our graph using the basic editor mode and then switch to the text mode for the rest of this chapter to make it easier to copy the queries from this book.
Let's first graph the system load of VM where we have installed collectd:

It will now produce a graph given earlier, showing the system load.
By further clicking on the + symbol, you can expand the query by applying different functions against the data. These could be used to add multiple data sources together or to find the average. We will cover this further in the chapter as we begin to craft some queries to analyze Ceph performance. Before we continue, let's now switch the query editor mode to the text mode to see what the query looks like:

You can see that each leaf of the tree of metrics is separated by a dot. This is how the Graphite query language works.