
Tableau 10 allows geographic regions to be selected and grouped, hence creating custom territories.
In this recipe, we will explore this option:

To follow this recipe, open B05527_05 – STARTER.twbx. Use the worksheet called Custom Territories, and connect to the Worlds Busiest Airports data source:

The following are the steps to create the custom territories in this recipe:
- Double-click on the Country field under Dimensions in the side bar. The double-click action places this field in the Details property and creates a map with dots that represent the country of the respective airports, as well as the built-in Latitude and Longitude fields to Rows and Columns respectively.
- Press Ctrl + drag the Latitude (generated) pill in the Rows shelf to the Rows shelf, to the right of the existing pill, to make a second copy. This will generate a second map in the view:

- Click on the first Latitude (generated) field to activate its Marks card, and change the mark type to Filled Map.
- For the top map, use the lasso tool from the view toolbar to select all the filled areas in the Americas:
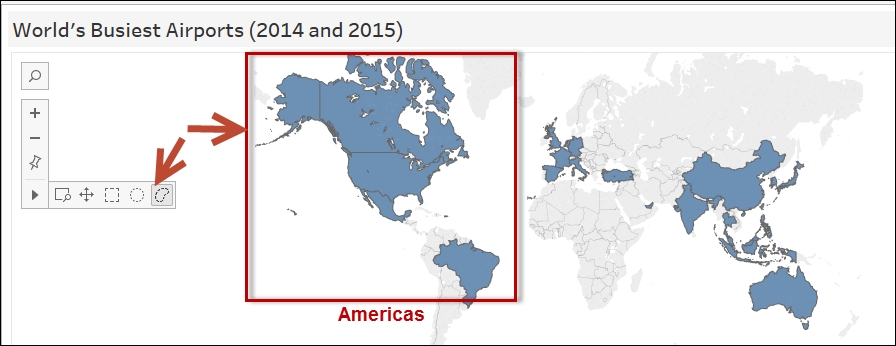
- While these countries are selected, the command buttons will appear. Click on the paperclip to group these countries as a single territory:

- Using the previous step as reference, create territories for three more groups of countries, as shown in the following screenshot:

- In the Dimensions section in the side bar, rename the Country (group) field to Custom Territories. You can do this by right-clicking on the field, and selecting Rename:

- Right-click on the values that appear in the color legend, and select Edit Alias. Change the aliases to the corresponding territories:

- Change the title of the color legend to Custom Territories. You can do this by clicking on the drop-down arrow in the top right corner of the color legend and selecting Edit Title.
- Activate the second Marks card by clicking the second Latitude (generated) pill in the Rows shelf.
- While the second Latitude (generated) Marks card is active, change the mark to Circle.
- From Measures, drag Passengers to Color in the second Marks card.
- Right-click on the SUM(Passengers) pill, and in the Measure option, select Average instead of Sum.
- Edit the color of the passenger color legend. Change it to Stepped Color, with four steps:

- Click on the drop-down arrow on the second Latitude (generated) pill in the Rows shelf and check Dual Axis:
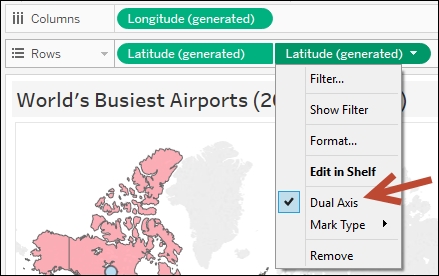
Tableau 10 has a new feature that allows us to create custom territories. To create custom territories, we simply need to select all the marks in the map we want to include in the territory, and then using the paper clip icon to create the territory:

You may recall that the paperclip icon normally groups items together. The custom territory tool uses the same concept.
Instead of using the paperclip icon, you can also choose to right-click on the geolocation field on the side bar and use the menu items to group the locations:

Once you create the group, you will notice a new field in the side bar represented by a globe with paperclip icon:

To make modifications, you can right-click on this new field and select Edit. In the Edit window, you can rename the groups or rearrange the members of the group as needed:

We can add a lot of insights to maps by creating dual axis graphs – two marks on top of a map. To do this, we can simply duplicate either (or both) the latitude or longitude pill on either the Rows or Columns shelf and change the mark of one of the pills.
In the following example, we have a filled map with circle marks. To achieve this, we duplicated the latitude pill by using the Ctrl + drag shortcut from the pill to the Rows shelf. This produces two pills on Rows and two maps on the view, one on top of the other. This also introduces three Marks cards—one for the first pill, one for the second pill, and another one called All, which will affect both maps:

Because we have multiple Marks cards, we can now vary the marks we want to show. To overlay one map on top of the other, we can simply right-click on the second Latitude (generated) pill and select Dual Axis:

Pies on map? Shapes on map? Circles on map? All of these can be done using this technique!
- Please refer to the Creating a combo chart (dual axis chart) recipe in Chapter 2, Advanced Charts
- Please refer to the Using path to display movement in map recipe in this chapter