
I am sure that everyone who reads this book has to deal with a situation where a stored procedure or query suddenly started to perform poorly. In other words, performance was good in the past and it was working regularly up to some point in time, but the same procedure or query does not perform well anymore: either you got a timeout when you executed it, or the execution time has been significantly increased. Usually you need to fix this as soon as possible, especially when it happens in an important application module and/or during non-working or peak hours.
How do you proceed with this? What is the first step you take when you start such troubleshooting? By gathering information such as system information, query stats and plans, execution parameters, and so on, right? When a query or stored procedure is slow, you want to see its execution plan. Therefore, the first thing is to check the execution plan in the server cache. You can use this query to return the execution plan for a given stored procedure:
SELECT c.usecounts, c.cacheobjtype, c.objtype, q.text AS query_text, p.query_plan
FROM
sys.dm_exec_cached_plans c
CROSS APPLY sys.dm_exec_sql_text(c.plan_handle) q
CROSS APPLY sys.dm_exec_query_plan(c.plan_handle) p
WHERE
c.objtype = 'Proc' AND q.text LIKE '%<SlowProcedureName>%';
By observing the execution plan of a poorly performed query you can find the reason why the execution is slow: you can see Scan, Hash Join, and Sort operators, and at least make some assumptions about the slow execution. You can also find out when the plan was generated. In addition to the plan info, you can also use execution statistics. The following query returns info about the execution time and logical reads for the execution of a given stored procedure:
SELECT p.name, s.execution_count,
ISNULL(s.execution_count*60/(DATEDIFF(second, s.cached_time, GETDATE())), 0) AS calls_per_minute,
(s.total_elapsed_time/(1000*s.execution_count)) AS avg_elapsed_time_ms,
s.total_logical_reads/s.execution_count AS avg_logical_reads,
s.last_execution_time,
s.last_elapsed_time/1000 AS last_elapsed_time_ms,
s.last_logical_reads
FROM sys.procedures p
INNER JOIN sys.dm_exec_procedure_stats AS s ON p.object_id = s.object_id AND s.database_id = DB_ID()
WHERE p.name LIKE '%<SlowProcedureName>%';
By using the results of this query, you can compare current and average execution parameters, and also discover if only occasional executions are slow or if each execution under the current circumstances runs longer. These two queries can help you to find out how the execution looks now and to see how it differs from the execution in the past (from the response time and used resources point of view). You can also include a third query that returns current waiting tasks on the server within your database, to see if bad performance is caused by blocking issues.
However, there are some limitations to the set of information in the server cache. First, dynamic management views reflect particular or aggregated information from the last server restart only. When a server crashes, is restarted, or fails over, all cache information disappears. This could be a huge limitation in the query troubleshooting process. In the server cache, only the actual execution plan for a query is available and even this is not guaranteed. Sometimes, the plan is not in the cache due to memory pressure or infrequent usage. For queries with OPTION (RECOMPILE), for instance, only the latest version of the execution plan is in the cache, although the plan is generated by every execution. Since only the latest execution plan for a query is available, you don't know if and how the execution plan changed over time.
Every upgrade to a new SQL Server version, and every failover, patch, and installation of a new version of an application or service could lead to new execution plans. In most cases, these plans look the same after the aforementioned action; sometimes they are even better (new versions and installing cumulative updates and service packs usually improve overall performance), but in some cases newly-generated plans could be significantly slower than before the change. However, in the server cache, the old, good plan cannot be found.
What do we do in such cases? For the most critical stored procedures, I collect execution plans and statistics from dynamic management views mentioned at the beginning of this chapter and save them regularly into a database table by using a SQL job. The job runs every five minutes; data is persistent, belongs to the database, and is not lost when the server is restarted. On the top of the tables, I create a few PowerPivot reports and notifications. I check them immediately after a failover, patch, or the installation of a new application version and use them to confirm that the action was successful or to quickly identify performance degradations. A typical report is shown in the following screenshot:
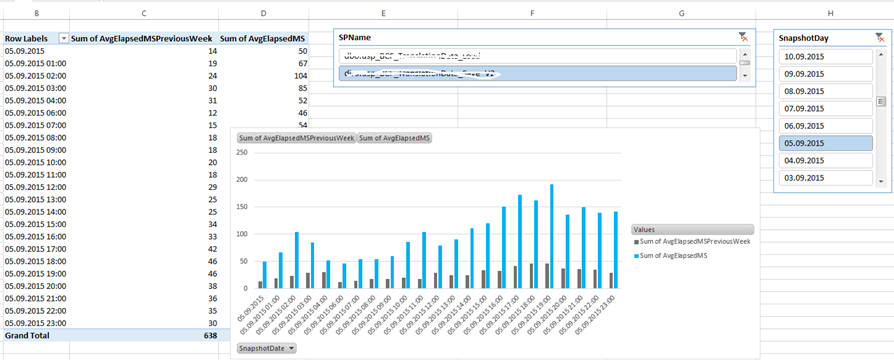
It clearly shows one regressed stored procedure after an application release.
This approach works very well and I had a good experience with it. It helped me many times not only to identify performance issues, but also to confirm that an update action was successful and learn more about my workload and how it behaves over time. However, I had to write, maintain, and deploy this custom solution to every database, and ensure that the aforementioned SQL job will run on all servers for all databases, regardless of failover or restart. It also requires consideration for, and even negotiations with, database administrators to ensure that server performance will not be significantly affected by the SQL job that collects my statistics. I would prefer an out-of-box solution for this, but such a solution did not exist, until SQL Server 2016.