
Following on from the plan comparison feature, we have one of the more powerful features for a developer. Live Query Statistics (LQS) does exactly what the name says—it provides us with a live view of a query execution so that we can see exactly how data is flowing through the query plan. In previous versions of SQL Server and SSMS we have been able to request a static graphical representation of a query execution plan. There have been multiple books, blogposts, videos, and training seminars designed and delivered to thousands of developers and DBAs around the world in an attempt to improve people's abilities to understand these static execution plans. The ability of a developer to read and interpret the contents of these plans rests largely on these resources. With LQS we have an additional tool at our disposal to be able to more easily identify how SQL Server is consuming and processing the T-SQL query that we have submitted to it.
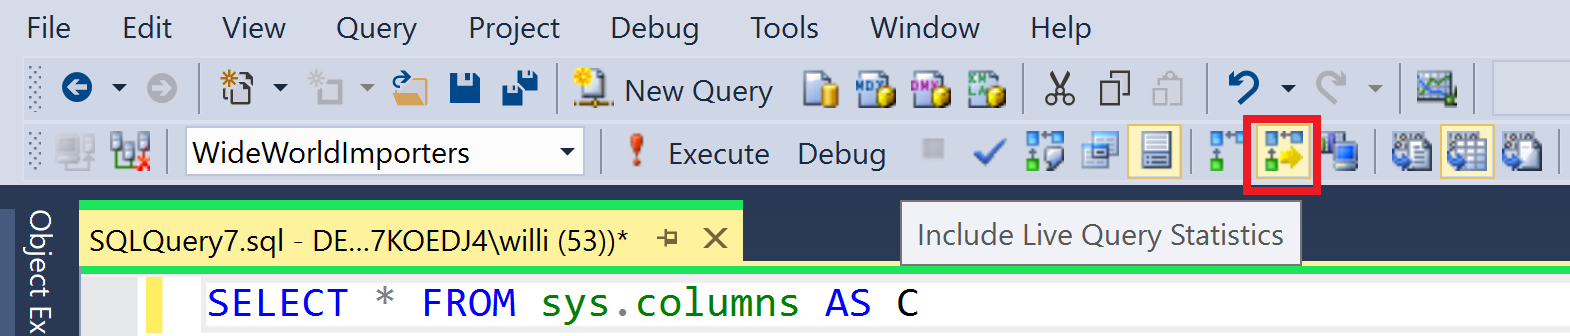
The special sauce in LQS is that we don't get a static graphical representation, but rather an animation of the execution. The execution plan is displayed in SSMS and the arrows between the plan nodes move to show the data flowing between the nodes. In the following screenshot we see how to activate LQS inside SSMS for a particular Query tab:
As LQS shows a moving image, we are at a distinct disadvantage in a book! However, when we run a query with LQS activated, it is still possible to see an example of how LQS looks while running, as we can see in the following screenshot:

In the preceding screenshot, we can see that the execution plan image that we are used to has been extended slightly. We now see a few extra details. Starting in the top left of this image, we see the Estimated query progress in percent. As with anything to do with query execution and statistics, SQL Server is always working with estimations. Estimations that are based on table and index statistics, which is a topic worthy of an entire book! We also see an execution time displayed beneath each node that is still actively processing data. Also, beneath each node is a display of how many rows are still left to be processed (these are also based on estimations through statistics). Finally, we see the arrows connecting each node; solid lines are where execution has completed, dotted lines (which also move during execution) show where data is still flowing and being processed.
You can try out the same query shown in the preceding screenshot and see how LQS looks. This is a long-running query against sys.objects to produce a large enough result set that LQS has time to capture execution information. The following code shows a sample query function:
SELECT * FROM
SYS.OBJECTS AS o1
CROSS JOIN sys.objects AS o2
CROSS JOIN sys.objects AS o3
This sample query should run long enough to allow LQS to display an animated query plan long enough to understand how LQS makes a query plan easier to understand. It should also be clear that LQS can only display a useful animation for queries that run longer than a few seconds, as the animation only runs for the duration of the query.
This moving display of data flow allows us as developers to understand how SQL Server is processing our query. We are able to get a better insight into where execution is spending the most time and resources and also where we may need to consider rewriting a query or applying different indexing to achieve better results. LQS, coupled with query plan comparisons, will allow us as developers to design better database solutions and better understand how SQL Server processes our queries. In particular, how SQL Server must wait for certain nodes in an execution plan to complete before continuing onto the next node.
However, we must not forget that running LQS is similar to running a trace, and it requires a certain set of permissions and also consumes resources on the server. We should be approaching our queries with LQS at a development stage and attempting to write optimal code before we deploy into production. LQS should therefore be used primarily in your development work on a test environment and not on your production environment.