
So far, we have looked at many different types of security features and services, and the essential and secure controls and management they can bring to your solutions. However, when running your solutions at scale, you will want to ensure that you implement as much automation as possible when it comes to quickly identifying, recording, and remediating security threats as and when they occur. Automation provides an accurate and immediate response to an event that has taken place within your infrastructure, far quicker than a manual process involving a human could ever respond. Automated responses work on real-time data and are far more reliable than a manual process. As a result of this accuracy, reliability, and speed, using automation in a security context is always recommended.
This chapter will look at Amazon CloudWatch, Amazon GuardDuty, and AWS Security Hub, which are used to detect and automatically resolve and block potential security incidents.
The following topics will be covered in this chapter:
- Using CloudWatch events with Lambda and SNS
- Using Amazon GuardDuty
- Using AWS Security Hub
Technical requirements
To carry out the demonstrations in this chapter, you need to have access to an AWS account with permissions to administer Amazon CloudWatch, Amazon GuardDuty, and AWS Security Hub.
For details regarding permissions and access to these services, please refer to Chapter 4, Working with Access Policies.
Using CloudWatch events with AWS Lambda and SNS
In Chapter 13, Auditing and Governance, we looked at how AWS CloudTrail and AWS Config can be used to record and track changes to your infrastructure as soon as they happen, and how these events can be written to logs and processed by other services, such as Amazon CloudWatch. Using this data, you can configure controls to look for specific events for further investigation. These could be events that might signify a security breach or threat.
This is a simple method of implementing an automated level of remediation by monitoring and identifying events from different services to look for potential security breaches and implementing an automated response using AWS Lambda to rectify the problem. In addition to using CloudWatch log groups, we can use Amazon CloudWatch events.
For anyone who is unfamiliar with AWS Lambda, let me introduce the service quickly. AWS Lambda is a serverless compute service that automatically provisions compute power, allowing you to run code for your applications either on demand or in response to events without having to actually provision any compute instances yourself. Using this serverless technology removes a level of administrative responsibility of maintaining a compute instance; instead, that is all managed by AWS. This allows you to focus purely on the application logic and code.
Removing the need to provision and run an Elastic Compute Cloud (EC2) instance can provide significant cost savings, as when using AWS Lambda, it only charges you for compute power per hundred milliseconds of use, only when your code is running, in addition to the number of times your code runs.
CloudWatch events can be used to search for specific events within your infrastructure, which can trigger an automated response. We will learn how to do this using an example in the upcoming subsections.
For our example, let's assume that I have a Virtual Private Cloud (VPC) that contains no EC2 instances, and I want to ensure that this VPC never has any EC2 instances running on it as I want it to be purely used for other services and management. Any sign of an EC2 instance running could be a security breach. You could configure Amazon CloudWatch events to build an event pattern to detect when an EC2 instance is running and carry out an automated response in relation to that event. Let's see how to do this.
Detecting events with CloudWatch
Using Amazon CloudWatch, we will first create a rule that detects when an EC2 instance state changes to a running state. Follow these steps:
- From the Amazon CloudWatch dashboard, select Rules under Events from the left menu:

- Next, select Create Rule, and the following screen will be displayed:

- Using the drop-down list, select EC2 for Service Name.
- For Event Type, you can select EC2 Instance State-change Notification:

- Select running under the Specific state(s) drop-down list.
- Select Any instance.
Your event pattern is now configured to record any events where an EC2 instance is listed as running, and this can be seen under Event Pattern Preview:

Now that you have identified which event(s) you want to capture, you need to configure the response to those events.
Configuring a response to an event
The detection of an event is only the first part of the automated process. Next, we need to configure a response to define what action will be called upon when the event has been detected. A response can be called from a number of different AWS services, allowing you to utilize a variety of services to carry out a specific operation:
- On the right-hand side of the console, you need to click on Add target*:

- Your targets are your event-response mechanisms, and the available targets include a number of different services, such as SNS topics, CloudWatch log groups, Kinesis streams, an SQS queue, an SSM run command, Lambda functions, code pipelines, and many more:

In this demonstration, I have selected two different targets, as you can see in the preceding screenshot:
-
- The first target I have selected is SNS topic, and I defined a topic that I want to be selected called SecurityChecks. This is a topic that I have created that a security team could be subscribed to so that they are notified when an EC2 instance is running.
- The second target is Lambda function, and I have selected an existing function called TerminateEC2Instances, which is designed to terminate the instance that is found running.
- Once you have configured your targets, select Next. You will then be asked to give your CloudWatch event a name and a description:

- Ensure that the checkbox is ticked to enable the rule, and then select Create Rule.
Amazon CloudWatch is a great service that provides a range of monitoring and logging tools that are bundled into this area range of automation features. This method focused on how to automate a response to an event.
Configuring cross-account events using Amazon CloudWatch
If you have a multi-account environment, you can send events from one account to another account using the AWS CloudWatch Event Bus feature. This is a great way to consolidate the collation of events using a single account.
At a high level, the following steps need to be carried out.
- On the receiver account, add permissions to the default event bus, allowing access from another account or from your AWS organization.
- On the sender account, add a rule that points to the receiver account default event bus as the target of the rule.
- Associate a role that has permissions to send events to the receiver's event bus.
- Configure a rule in the receiver's account to match the events pattern of the rule generated in the sender account.
Let's take a look at how to configure this. For this demonstration, you need to have access to two AWS accounts within the same AWS organization. For more information on configuring AWS organizations, refer to https://docs.aws.amazon.com/organizations/latest/userguide/orgs_tutorials_basic.html.
One account will act as your receiver account and the other will act as the sender account.
From the receiver account, do the following:
- Log in to the AWS Management Console and select Amazon CloudWatch.
- Select Event Buses from the Events menu on the left:

- Select the blue Add permission button:

- Select Organization under Type and select My organization, then click Add:
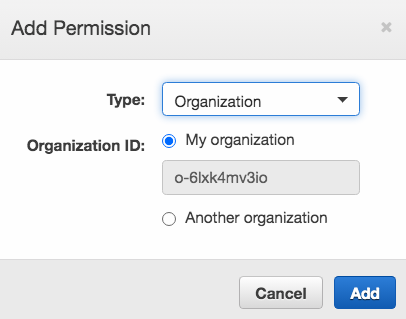
The receiver's event bus now has the ability to be accessed by accounts in the AWS organization.
Now, from the sender account do the following:
- Carry out the same steps explained in the Detecting events with CloudWatch section at the start of this chapter, up until you configure a response to the event, where it should be defined as follows:
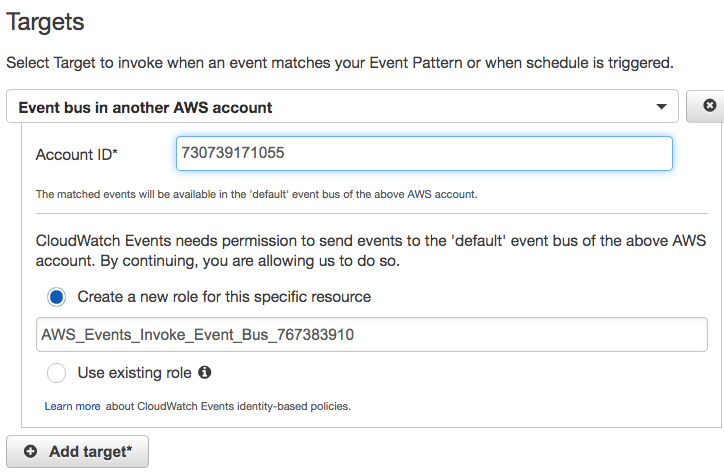
- Enter the account number of the receiver account.
The sender account now has access via the role to send events as per the rule to the event bus of the receiver account.
From the receiver account, you now need to configure a new rule to match the event pattern of the rule you are receiving from the sender account, in addition to an added parameter:
- Currently, the event pattern generated from the rule in the sender account looks as follows:

- You now need to create a new rule. Add the following parameter to the rule:
"account": [
    "356993128355”
  ],
Here, the account number is the account number of the sender's account. The event pattern should look as follows when added to the rule:

- You can then configure the Target response for this rule as per the previous examples.
- Adding the account parameter ensures that the rule configured in the receiver's account is not triggered when a matched event is received from a different account, especially if you are receiving events from more than one account.
In this section, we looked at how you can send all events from CloudWatch to a centralized AWS account, which can then respond with its own configured targets, such as a Lambda function or an SNS notification. This helps to implement a level of management and central control over how events are processed across a multi-account environment.
Next, I now want to discuss another AWS security service that we haven’t touched on yet—Amazon GuardDuty, which can be used for both automation detection and the remediation of security incidents.
Using Amazon GuardDuty
For those of you who are unfamiliar with GuardDuty, it is a fully managed, intelligent threat-detection service, powered by machine learning, which continually provides insights into unusual and/or unexpected behavioral patterns that could be considered malicious within your account. Amazon GuardDuty can process and analyze millions of events that are captured through your AWS CloudTrail logs, DNS logs, and VPC flow logs from multiple accounts. These events are then referenced against numerous threat detection feeds, many of which contain known sources of malicious activity, including specific URLs and IP addresses.
Amazon GuardDuty is continually learning, based on the day-to-day activity of operations within your account, to understand and differentiate between normal behavior and what could be considered abnormal behavior, thereby indicating a threat within your infrastructure. This behavioral-based analysis allows GuardDuty to detect potential vulnerabilities and exploits, such as an API call that has been called unexpectedly or interactions and connectivity with unknown or unusual sources.
Being an always-on service, it provides a very effective method of identifying security issues automatically and without any performance impact, as the service runs entirely on the AWS infrastructure without the need of any local agents. Any findings by Amazon GuardDuty are presented to you in a list of priorities based on the findings.
With no initial upfront costs to enable GuardDuty, coupled with an ability to intelligently detect security threats without hindering the performance of your infrastructure, regardless of size, and providing centralized management by aggregating data from multiple AWS accounts, GuardDuty is a very effective tool in your effort to protect your AWS resources and any stored data.
Enabling Amazon GuardDuty
Amazon GuardDuty is a regional service, and so you must first select the region in which you want to enable the service. It is very easy and simple to enable:
- From the AWS Management Console, select Amazon GuardDuty | Get started:

- Select Enable GuardDuty:

GuardDuty is now enabled. It will begin monitoring feeds from your DNS logs, CloudTrail logs, and VPC flow logs. Any findings that are found will be displayed within the dashboard—for example, the finding shown here:
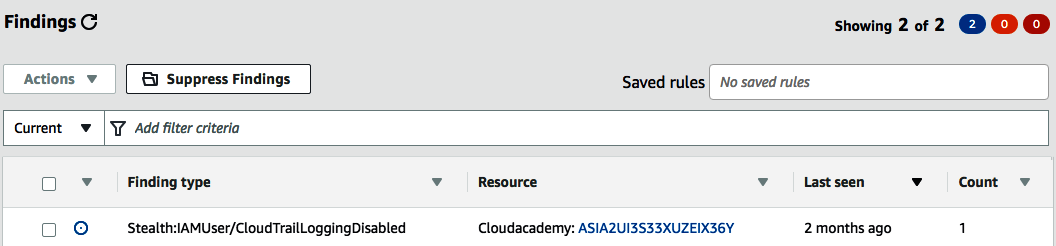
This shows that a finding highlighted unusual activity where a trail within AWS CloudTrail was stopped. By selecting the finding, we can gather additional information:

As you can see, it provides the reason behind the finding, plus the severity, and here, we can see that the severity is LOW. It also provides additional information, such as the account, the region, and timestamps.
In addition to this high-level summary data, GuardDuty provides a whole host of other information that is very useful and important, as you can see here:

So, we now understand how to enable Amazon GuardDuty, and we have also seen how it detects unusual activity, which can be of great help. But finding a risk in not enough; it also needs to be remediated. So, let's learn how Amazon GuardDuty can be used to perform automatic remediation.
Performing automatic remediation
Amazon GuardDuty also has the ability to perform remediation on findings through automation, and again, this uses Amazon CloudWatch events to do so. From within Amazon CloudWatch, you can create a new rule, as in the previous demonstration, but instead of selecting EC2 for Service Name as we did earlier, you could select GuardDuty, and select GuardDuty Finding for Event Type, as shown here:

Again, you can configure your event target to then automatically implement a response, perhaps a Lambda function.
As you can see, using more than one service together can effectively help you actively monitor and detect security threats and vulnerabilities, as Amazon GuardDuty allows, and then implement mechanisms to automatically review and remediate a security issue—in this case, with a customized Lambda function.
Next, let's move on to another security service that helps us in automating our response to security incidents—AWS Security Hub.
https://aws.amazon.com/blogs/compute/automating-security-group-updates-with-aws-lambda/
Using AWS Security Hub
Another security service, AWS Security Hub, can also be used to help detect and remediate security incidents. It is designed to help you centralize many of your security findings, alerts, and compliance reports from numerous different AWS security services, including the following:
- AWS Identity and Access Management (IAM)
- Amazon Macie
- Amazon GuardDuty
- Amazon Inspector
- AWS Firewall Manager
In addition to these native AWS services, it can also be incorporated into any third-party partner solutions, such as Sumo Logic, Splunk, and many more, that you might already be using within your organization. A full list of these partners can be found at https://aws.amazon.com/security-hub/partners/.
By acting as a security hub, the service acts as a single-pane-of-glass approach to the security notifications used across your accounts. This allows the service to categorize and prioritize all events from multiple sources, allowing you to gain a deep understanding of any threats or vulnerabilities, in addition to being aware of what the highest priority from all of your feeds is. Let's see how.
Enabling AWS Security Hub
AWS Security Hub can be enabled from the AWS Management Console. Follow these steps:
- When you first go to AWS Security Hub from the AWS Management Console, you will be presented with the following screen:

- You first need to select the security standards that you would like to activate—either CIS AWS Foundations Benchmark (https://www.cisecurity.org/benchmark/amazon_web_services/) or PCI DSS. These standards allow Security Hub to run configuration and security checks continuously at an account-level based on the industry standards that you select.
You can also see the AWS service integrations that AWS Security Hub operates on.
- Once you have selected your security standards, select Enable Security Hub.
As you can see, you will then be presented with a series of interactive charts, graphs, and statistics displaying findings insights, and security standard compliance failures:

Let's go over these in the following subsections.
Insights
AWS Security Hub offers a number of predefined and managed insights, and these are used to highlight and identify any security-related weaknesses. The following screenshot shows an example of some of these:

It is also possible to create your own insights using a serious of statements, identifiers, and filters to hone in on what you are trying to locate and isolate.
Findings
A finding is a security issue or a failed security check that has been detected by the integrated AWS service and third-party solutions. These interactions with other AWS services can be enabled or disabled:

As you can see in the preceding screenshot, AWS Firewall Manager and AWS IAM Access Analyzer are third-party services that are sending their findings to Security Hub. These can be disabled by clicking on the Stop accepting findings button.
Security standards
As mentioned previously, these security checks assess your accounts continuously against the security standards enabled—for example, CIS AWS Foundations Benchmark. For each check, a severity is given, as well as remediation instructions should you experience a failure on these checks. The following screenshot shows an example of the checks that are undertaken, in addition to the defined severity of each check:

As you can see, if someone was actively using the root account, this would be considered a CRITICAL severity level, and would be highlighted as a security risk. Also, you have the option to disable the checks that you do not want to include, should you need or ever want to do so.
So far, we've seen how Security Hub can help us identify security incidents through insights, findings, and security standards. But you'd be right in thinking that mere identification is not enough and remediation is important.
Performing automatic remediation
Again, as with Amazon GuardDuty, AWS Security Hub also integrates with Amazon CloudWatch events to help you automate the remediation process of any findings found. This is configured from within the Amazon CloudWatch events dashboard by selecting Security Hub for Service Name and then the appropriate Event Type option:

Again, you can select from the available targets to carry out automatic remediation steps by your Security Information and Event Management (SIEM) tools.
It also integrates with Amazon Detective, which was a new service released at the AWS re:Invent conference in 2019. Amazon Detective helps to simplify the effort required to analyze and investigate the root cause of security incidents and suspicious activity through machine learning and log data received by multiple AWS services. More information on Amazon Detective can be found at https://aws.amazon.com/detective/.
Summary
In this chapter, we learned about the importance of automating responses to security incidents and looked at a few AWS services that help us achieve this automation—CloudWatch, GuardDuty, and Security Hub. As your environment scales and grows (and it will, especially when you begin to integrate multiple accounts, which Amazon GuardDuty and AWS Security Hub both support), it will become essential to implement a level of automatic detection and remediation to help you identify and resolve security incidents as and when they occur.
With the help of this chapter, you are now able to adopt a range of different AWS security services, such as Amazon GuardDuty, AWS Security, Amazon CloudWatch, AWS Lambda, and AWS CloudTrail, and use them as an asset to your security strategy. Not only can you now automatically put blocks in place as and when suspicious activity is automatically detected, but you can also notify your security teams, allowing them to investigate how it happened and apply the relevant measures to prevent it from happening again in the future.
In the next chapter, we will dive into a few security best practices that are tried and tested by many organizations to secure their cloud infrastructure. You will learn how to enable AWS Trusted Advisor and use the instrumentation to secure even-based remediation.
Questions
As we conclude, here is a list of questions for you to test your knowledge of this chapter's material. You will find the answers in the Assessments section of the Appendix.
- True or false: CloudWatch events can be used to search for specific events within your infrastructure, which can trigger an automated response.
- Amazon GuardDuty is able to process and analyze millions of events that are captured through your AWS CloudTrail logs, DNS logs, and which other logging mechanism?
- Which AWS service acts as a single-pane-of-glass approach to your security notifications across your accounts?
- True or false: AWS Security Hub integrates with AWS Trusted Advisor to help you automate the remediation process of any findings found.