
With so many services available to use within AWS, there is a vast amount of information being sent and received, both internally and externally, from your account. With so much traffic and data, it's essential that you are able to track and record what is happening with your resources to allow you to monitor your environment for potential weaknesses or signs of attack that indicate a security threat.
Having the ability to configure and enforce logging across your services helps significantly in identifying potential issues, not just from a security perspective but also from a performance and availability perspective too. In this chapter, I want to look at some of the different logging options available to you within AWS that you should be aware of.
We will be covering the following topics in this chapter:
- S3 server access logs
- Flow logs and traffic mirroring
- AWS CloudTrail logs
- The CloudWatch logging agent
Technical requirements
To follow the demonstrations in this chapter, you need elevated privileges for the services discussed. For information on granting permissions, please refer to Chapter 4, Working with Access Policies.
Implementing logging
For many organizations, implementing effective logging and monitoring at the start of a project can sometimes be an afterthought, what with the never-ending pressure to launch new applications, architecture, and solutions. However, treating it as an afterthought inevitably ends up being a regrettable approach due to the value that logging brings to your environment, especially during a security compromise or a degradation in service and performance.
Many AWS services generate logs that provide a vast amount of information that you otherwise wouldn't necessarily have access to that can be written to persistent storage. They contain details that enable you to optimize and identify potential issues, or highlight improvements, and so they become a valuable asset within your solutions. Logs are typically in text form, allowing you to easily process, analyze, and extract the data that you need and are looking for.
It can be very easy to implement logging solutions with vast amounts of data that holds valuable information; however, it's challenging to interpret that information and respond to it appropriately.
There are many benefits to logging, which fit many different business requirements. Log data can be very effective in resolving and identifying incidents across your environments, helping to reduce the blast radius of a problem quickly and sometimes automatically. Many organizations must also implement logging capabilities to fulfill audit and governance compliance controls, which are an important requirement that can't be overlooked. More on auditing and governance is covered in Chapter 13, Auditing and Governance.
With this basic understanding of logging and the advantages it provides, let's now look at some of the different AWS services and the logs they produce.
Amazon S3 logging
I want to look at the S3 service first, which is the most widely used storage service that AWS provides. S3 provides you with almost limitless amounts of object storage, which can be used for many different use cases. As a result, its logging features are worth taking a look at.
There are two types of logging that can be found within S3:
- S3 server access logs
- S3 object-level logging
We'll go over them one by one.
Enabling S3 server access logging
Server access logs contain details about when a particular bucket is accessed. This information can be used to ascertain the frequency at which a bucket is accessed and by whom it is accessed. Before I continue, an Amazon S3 bucket is a container in which you store the objects that you upload to Amazon S3. It can be considered similar to a folder that you would get in a normal filesystem.
The data gathered by these access logs contains useful information that can be used to help you identify the source of a security incident. Here are just a few of the log details that are captured:
- The identity of the requester accessing the bucket
- The name of the bucket being accessed
- A timestamp identifying when the action was carried out against the bucket
- The action that was carried out against the bucket
- The HTML response status
- Any error codes that are applicable
It is very simple to enable this logging at the bucket level; the process simply involves using an additional bucket to direct logs to, known as a target bucket. Ideally, this target bucket should be dedicated to logging for ease of management. A key point to remember when configuring S3 server access logs is that the source and target buckets must be in the same region and be owned by the same AWS account.
Let's take a look at how to implement this configuration via the AWS Management Console:
- Log in to your AWS account via the AWS Management Console.
- Select the S3 service.
- Under Buckets, select the source bucket that you want to create logs for.
- Select the Properties tab:

- Select Server access logging. You will notice that it is currently disabled, which is the default option for any bucket that is created. If it was enabled, it would indicate so, much in the same way that the Object-level logging option is in the preceding screenshot:

- Select Enable logging:

- From the drop-down list, select the target bucket to be used. This target bucket will contain the logs gathered from the source bucket. If required, you can optionally set a Target prefix value; this will allow you to differentiate between your logs if you have multiple source buckets using the same target bucket. For example, you might want to add a target prefix of audit/, and then each log will have audit/ as a prefix.
- Once you have configured your target bucket and optionally a prefix, select Save. Server access logging is now enabled:

When a bucket is used as a target for S3 access logging from within the AWS Management Console, the Access Control List (ACL) permissions on the bucket are updated to allow the delivery of these log files by the log delivery group. This log delivery group is predefined by AWS and is used to deliver the logs to the target bucket from the source buckets.
The following screenshots show these permissions on the target bucket.
The first screenshot shows you that the Log Delivery group has write access to objects in the bucket and read access to read the bucket permissions. These permissions allow the log delivery group to send the log data to the target bucket:

If you were to configure S3 access logging for use in the CLI, then you would need to manually add these ACL permissions to the target bucket for the logs to be delivered. For more information on how to configure this, please visit the following AWS documentation at: https://docs.aws.amazon.com/AmazonS3/latest/dev/enable-logging-programming.html.
The name of each S3 server access log file is constructed in the following format:
TargetPrefixYYYY-mm-DD-HH-MM-SS-UniqueString
TargetPrefix is the optional prefix that you can add as explained previously. YYYY-mm-DD-HH-MM-SS defines the year, month, day, hour, minute, and seconds, in UTC time, of the time at which the log was created. UniqueString provides no real value or meaning; it is simply used to prevent the file from being overwritten by another file with the same name.
The following screenshot shows some examples of S3 server access logs with a target bucket:

In addition to logging at the bucket level of Amazon S3, we also have logging at the object level, so let's now take a look at that.
S3 object-level logging
S3 object-level logging integrates with AWS CloudTrail data events. AWS CloudTrail is a service that records and tracks all AWS API requests that are made. These can be programmatic requests made using an SDK or the AWS CLI, from within the AWS Management Console, or from other AWS services.
When S3 object-level logging is enabled, you must associate it with a CloudTrail trail. This trail will then record both write and read API activity (depending on its configuration) for objects within the configured bucket. Although we are discussing Amazon S3 here, S3 object-level logging relies heavily on CloudTrail, and so I shall discuss CloudTrail data events later in this chapter when I dive deeper into AWS CloudTrail and its logging capabilities.
Now that we have looked at an example of how logging can be achieved for S3, I now want to look at how logging can be used at the network level, using VPC Flow logs.
Implementing Flow Logs
Within your AWS account, it's likely that you have a number of different subnets, both private and public, allowing external connectivity. You may even have multiple VPCs connected via VPC peering connections or via AWS Transit Gateway. Either way, you will have a lot of network traffic traversing your AWS infrastructure from multiple different sources, both internally and externally, across thousands of interfaces. Using Flow Logs gives you the ability to capture this IP traffic across the network interfaces that are attached to your resources, which could number in the tens of thousands in a corporate environment!
Flow Logs can be configured for the following resources:
- Your VPC
- A subnet within your VPC
- A network interface from your EC2 instances, or interfaces created by Elastic Load Balancing, Amazon RDS, Amazon ElastiCache, Amazon Redshift, Amazon WorkSpaces, NAT gateways, and Transit Gateway
As Flow Logs can capture information at these levels, it's a great way to help you identify security threats, such as network traffic that is reaching a resource or subnet that it shouldn't be. This might be down to overly permissive security groups or network ACLs, or other controls. Either way, it identifies weaknesses, allowing you to build a greater defense and remediate any potential vulnerabilities in your resources.
The logs themselves can either be sent and stored within Amazon S3 or sent to Amazon CloudWatch Logs. The logs need to be stored in a persistent data store to allow you to review them when required. Amazon S3 is a great way to store your logs, which can then be accessed by many different services for further analysis. Amazon CloudWatch can also be used as a central store for all of your logs that can be queried and sorted based upon different filters and visualized in dashboards.
Let's try implementing our own flow log. This will help us better understand the advantages that it brings us.
Configuring a VPC flow log for a particular VPC subnet
Creating a flow log is simple and can be done from the AWS Management Console. We'll create this and then decide whether to store it in Amazon S3 or CloudWatch, as well as understanding its format. So, let's begin:
- From within the VPC dashboard of the AWS Management Console, select Subnets:

- Select the subnet that you would like a flow log created for. At the bottom of the screen in the information pane, select the Flow Logs tab:

- Select the blue Create flow log button (seen in the preceding screenshot):

- From here, you can configure the traffic that you want your flow log to capture. Using the Filter drop-down list, you can select either Accept, Reject, or All. This determines which traffic is to be recorded within the log.
- Under the Destination option, you can choose to have the flow log data sent to either Amazon S3 or CloudWatch Logs. If you were to select CloudWatch Logs, you would then need to provide Destination log group and IAM role information to be used to deliver those logs. If you select S3 as the destination, your options change to the following:

- For this demonstration, I will select S3 as the destination, which means I need to add the Amazon Resource Name (ARN) of the destination bucket.
- Log record format allows you to accept the default log file format:
${version} ${account-id} ${interface-id} ${srcaddr} ${dstaddr} ${srcport} ${dstport} ${protocol} ${packets} ${bytes} ${start} ${end} ${action} ${log-status}
Alternatively, you can create your own customized log file format, selecting a set of predefined options by using the Custom Format option. This will then present you with a drop-down list containing all available fields, which you can then select in any order. For this demonstration, I will select the default log file format.
- When you are happy with your options, select the blue Create button. You will then be taken back to the dashboard, where you can see your newly created flow log, which is given a flow log ID:

Once you have created your flow log, the only action you can then perform against it is deletion of the flow log.
If your flow log creation fails, then it is likely a permissions issue. When flow logs are created, permissions are added to the bucket policy of the selected S3 bucket, which allows the delivery of logs. These permissions are automatically applied as the user who is creating the flow log is also the owner of the bucket. If the user is not the owner of the bucket, then the following policy needs to be added manually, replacing the bold italics with your own details:
{
  "Version": "2012-10-17",
  "Statement": [
    {
      "Sid": "AWSLogDeliveryWrite",
      "Effect": "Allow",
      "Principal": {"Service": "delivery.logs.amazonaws.com"},
      "Action": "s3:PutObject",
      "Resource":
"arn:aws:s3:::bucket_name/optional_folder/AWSLogs/account_id/*",
      "Condition": {"StringEquals": {"s3:x-amz-acl": "bucket-owner-full
control"}}
    },
    {
      "Sid": "AWSLogDeliveryAclCheck",
      "Effect": "Allow",
      "Principal": {"Service": "delivery.logs.amazonaws.com"},
      "Action": "s3:GetBucketAcl",
      "Resource": "arn:aws:s3:::bucket_name"
    }
  ]
}
In this section, we looked at how to create a VPC flow log for a subnet, and we then directed that log data to an S3 bucket. In the next section, I want to explain how the log files themselves are defined.
Understanding the log file format
I briefly highlighted the log file format during the demonstration, but I just want to quickly highlight what each of those parameters is defined as. So, to clarify, the default log file format is as follows:
${version} ${account-id} ${interface-id} ${srcaddr} ${dstaddr} ${srcport} ${dstport} ${protocol} ${packets} ${bytes} ${start} ${end} ${action} ${log-status}
These parameters define the following:
- version: The version of the flow log itself
- account-id: Your AWS account ID
- interface-id: The interface ID that the log stream data applies to
- srcaddr: The IP source address
- dstaddr: The IP destination address
- srcport: The source port being used for the traffic
- dstport: The destination port being used for the traffic
- protocol: The protocol number being used for the traffic
- packets: The total number of packets sent during the capture
- bytes: The total number of bytes sent during the capture
- start: The timestamp of when the capture window started
- end: The timestamp of when the capture window finished
- action: Whether the traffic was accepted or rejected by security groups and Network Access Control Lists (NACLs)
- log-status: The status of the logging, shown as one of three different codes:
- OK: Data is being received.
- NoData: There was no traffic to capture during the capture window.
- SkipData: Some data within the log was captured due to an error.
In this section, we looked at the different parameters of VPC Flow logs to get an understanding of the data that they capture. But along with all the advantages they come with, do they also have limitations? Read on to find out.
Understanding log file limitations
Before you go ahead and think about creating flow logs across your infrastructure, do be aware that there are a number of limitations to using them. Some of the key points to be aware of are available at: https://docs.aws.amazon.com/vpc/latest/userguide/flow-logs.html#flow-logs-limitations.
That concludes this section covering VPC Flow logs and how they can be used at the network level to capture network data that's crucial in helping you to identify potential security attacks and threats. Attacks come from layers, and having the ability to create logs at each of these layers puts you in a good position to identify a threat quickly and eliminate it.
In the next section, I want to look at another network layer logging capability, but one that offers very different data to that of VPC Flow logs.
VPC Traffic Mirroring
VPC Traffic Mirroring, as the name implies, allows you to duplicate network traffic from elastic network interfaces attached to instances, so that the duplicated traffic can then be sent to third-party tools and services for traffic analysis and inspection.
When configured, the duplicated traffic is sent to a target; this could be a network load balancer, using UDP as a listener, which sits in front of a fleet of appliances dedicated to network analysis. Alternatively, you could simply use another EC2 instance as a target, pointing it to the Elastic Network Interface (ENI) of the instance. If required, these targets could also be in a different VPC for additional management.
Traffic Mirroring is a great addition to Flow Logs, as it provides a deeper investigative insight into network traffic. This helps you dissect packets more effectively, leading to a quicker root-cause analysis for both performance issues and security incidents. Reverse-engineering how a security threat progressed through your network allows you to better defend against it in future.
Each packet contains a lot of data and your own network team or security team might only be interested in certain elements. Using mirror filters, you can specify which element of a packet you need to capture. For example, you might only want to capture traffic running a certain port or protocol, or from a specific CIDR block.
More information on VPC Traffic Mirroring can be found at: https://docs.aws.amazon.com/vpc/latest/mirroring/what-is-traffic-mirroring.html.
Using AWS CloudTrail logs
As I mentioned previously when discussing S3 object-level logging, AWS CloudTrail is a service that records and tracks all AWS API requests made. These can be programmatic requests made using an SDK or the AWS CLI, from within the AWS Management Console, or from other AWS services. This makes it a fantastic service to comply with the specific governance and compliance requirements that you may have. Having a continuous log of all API activity within your account allows you to create a full audit history of operational activity, showing who or what has made specific changes to your specific resources and at what time.
To understand how CloudTrail logging works and the information that it captures, let me explain a few components of the service first:
- Trails: These are the fundamental building blocks of CloudTrail itself. They contain the configurable options that you want to monitor and track. For example, you can create a trail that monitors a single region, or multiple regions.
- Events: Each time an API call is made, AWS CloudTrail intercepts and captures that API request and stores it as an event. These events record key data relating to the API request, which is then stored within a log file. A new event is created for each and every API request made.
- Log Files: Log files are created approximately every 5 minutes and are delivered to and stored within a target S3 bucket as defined within the associated trail.
- CloudWatch Logs: In addition to storing your log files on S3, CloudTrail can also push your logs out to CloudWatch Logs for analysis and monitoring.
- API Activity Filters: These provide a search and filter functionality when looking at your API activity history from within the AWS Management Console.
If you are new to CloudTrail, let me show you how to create a new trail, which will also show how and where you can configure the options of the log files.
Creating a new trail
We will create a new trail using the AWS Management Console in this example. Follow these steps:
- Log in to your AWS Management Console.
- Select CloudTrail from the list of services.
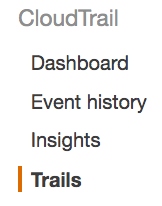
- Select Trails from the menu on the left:
- Select the blue Create trail button. You will now be presented with a screen to configure your trail. Here, you will need to enter details relating to the name of the trail, whether you want the trail to apply to all regions, whether you want the trail applied to a specific region, and whether you want the trail to be applied to your AWS organization:

- You will then need to enter details for the management events. Management events are records of actions that are performed on or within resources in your AWS account. Your options are to record all read/write actions, just read actions, just write actions, or none. You can also choose whether you would like to use the trail to log Key Management Service (KMS) events as well:

- Next, you can opt in to logging insight events. Insight events are records that capture an unusual call volume of write management APIs in your AWS account. Do be aware that additional charges could apply for this feature:

- Following insight events, you can then configure data events (plane operations), which can either be related to S3 or Lambda. Data events are records of resource operations performed on or within a resource. So, if you choose the S3 option displayed in the following screenshot, you can record all read calls, all write calls, or both read and write calls for S3 object-level API calls against specific buckets. Alternatively, you can record data events for all buckets within your account:

If you select the Lambda tab, you are presented with the following options, where you can record any Lambda Invoke API operations for the specific functions listed in the table. Again, much like S3 options, you can configure this to log all current and future Lambda functions:

- Next, you need to configure the storage location for the log files generated by the trail. You can either create a new S3 bucket or select an existing bucket. Under the advanced options, you can add additional details, such as a file prefix that should be used by the trail when storing log files within your selected bucket. Adding a prefix can help you quickly and easily distinguish between different log files:

If your trail data is considered sensitive or confidential, then you can add a layer of encryption by choosing to encrypt the log files with Server-Side Encryption using the Key Management Service (SSE-KMS). If this option is selected, you will be prompted to create a new Customer-Managed Key (CMK) or select an existing one. I will be covering KMS in detail in Chapter 16, Managing Key Infrastructure.
As an additional layer of security for your log files, you can enable log file validation. This essentially performs a check against your log file to see whether it has been tampered with after the log file has been delivered to your S3 bucket.
Finally, you can configure notifications for the delivery of every log file using Simple Notification Service (SNS).
- The final configurable element before creating your trail is configuring any tags to be used against the trail:

- When you have finished your configuration, select the blue Create button to create your trail. You will then see your newly created trail on the dashboard.
Earlier, I mentioned that in addition to storing your log files on S3, CloudTrail can also push your logs out to CloudWatch Logs for analysis and monitoring; however, this configuration is not possible until the trail is created.
Configuring CloudWatch integration with your trail
Now that your trail is created, you have the option of integrating your trail with CloudWatch Logs. Let's run through the configuration process to do this:
- Select your trail from within the CloudTrail dashboard.
- Scroll down through the configuration of your trail until you get to the CloudWatch Logs section:

Here, either you can select an existing CloudWatch Logs group, if you have one configured, or alternatively you can have CloudTrail create a new one for you, which is what is shown in the preceding screenshot. Once you have selected your CloudWatch Logs group, select the blue Continue button.
- To enable CloudTrail to deliver these logs to CloudWatch, permissions are required, and this is enabled in the form of a role that the CloudWatch service principal assumes to deliver the logs:

As you can see from the informational text in this image, access is required by CloudTrail to call the CreateLogStream and PutLogEvents APIs.
- You must select the IAM role and the policy to enable this access. CloudTrail will create a default role for you, which is preselected, along with the ability for CloudTrail to create the policy as well (as shown in the preceding screenshot). The policy used is as follows:
{
 "Version": "2012-10-17",
 "Statement": [
  {
   "Sid": "AWSCloudTrailCreateLogStream20141101",
   "Effect": "Allow",
   "Action": [
    "logs:CreateLogStream"
   ],
   "Resource": [
    "arn:aws:logs:eu-west-1:730739171055:log-group:CloudTrail/DefaultLogGroup:log-stream:730739171055_CloudTrail_eu-west-1*"
   ]
  },
  {
   "Sid": "AWSCloudTrailPutLogEvents20141101",
   "Effect": "Allow",
   "Action": [
    "logs:PutLogEvents"
   ],
   "Resource": [
    "arn:aws:logs:eu-west-1:730739171055:log-group:CloudTrail/DefaultLogGroup:log-stream:730739171055_CloudTrail_eu-west-1*"
   ]
  }
 ]
}
- When you have selected your options, select the blue Allow button for the configuration of permissions to take place. Your trail is now configured to send logs both to S3 and to CloudWatch Logs as well:

In this section, we covered how to create a new CloudTrail and then how to associate that trail with a CloudWatch Logs log group. Next, I want to dive deeper into AWS CloudTrail by looking at the contents of the log files generated by the trail.
Understanding CloudTrail Logs
In this section, I want to look at some snippets of the log files that are created by your trails so you can see some of the information that is captured.
As with many other policies within AWS, CloudTrail logs are written in JavaScript Objection Notation (JSON) format, and a new log entry (or event) is made each and every time an API is called.
These events, when written to a log file, may look similar to the snippets shown here:
                  "awsRegion": "eu-west-1",
                  "eventID": "6ce47c89-5908-452d-87cc-a7c251ac4ac0",
                  "eventName": "PutObject",
                  "eventSource": "s3.amazonaws.com",
                  "eventTime": "2019-11-27T23:54:21Z",
                  "eventType": "AwsApiCall",
                  "eventVersion": "1.05",
                  "readOnly": false,
                  "recipientAccountId": "730739171055",
                  "requestID": "95BAC3B3C83CCC5D",
                  "requestParameters": {
                        "bucketName": "cloudtrailpackt",
                        "Host": "cloudtrailpackt.s3.eu-west-1.amazonaws.com",
                        "key": "Packt/AWSLogs/730739171055/CloudTrail/eu-west-1/2019/11/27/730739171055_CloudTrail_eu-west-1_20191127T2321Z_oDOj4tmndoN0pCW3.json.gz",
                        "x-amz-acl": "bucket-owner-full-control",
                        "x-amz-server-side-encryption": "AES256"
                  "sharedEventID": "11d4461b-0604-46c4-b4c9-6a23b3e7f57c",
                  "sourceIPAddress": "cloudtrail.amazonaws.com",
                  "userAgent": "cloudtrail.amazonaws.com",
                  "userIdentity": {
                        "invokedBy": "cloudtrail.amazonaws.com",
                        "type": "AWSService"
Let me explain some of the parameters used within this single event taken from the event log stored on S3 and are useful when isolating issues from a security perspective:
- eventName: Highlights the name of the API being called ("PutObject").
- eventSource: Determines the AWS service in which the API call was made. ("s3.amazonaws.com")
- eventTime: This is the time that the API call was made ("2019-11-27T23:54:21Z"). This is in the format of yyyy-mm-dd T(IME) hh:mm:ss Z(UTC).
- SourceIPAddress: The source IP of the request used to make the API call. This displays the source IP address of the requester who made the API call. If this was the service in which the call was made, it will show the associated AWS service ("cloudtrail.amazonaws.com").
- userAgent: Determines the agent method that initiated the request. This can be a number of different values. In our example event, I have amazonaws.com. It identifies that the request was made from within the AWS Management Console by a user.
- Console.amazonaws.com: Determines that the root user made the request.
- userIdentity: Contains additional information relating to the user agent.
So, what we can see from this log event is that AWS CloudTrail made a PutObject request to Amazon S3 to store its log file (this is shown under the resources parameter):
"arn:aws:s3:::cloudtrailpackt/Packt/AWSLogs/730739171055/CloudTrail/eu-west-1/2019/11/27/730739171055_CloudTrail_eu-west-1_20191127T2355Z_oFOj4tmndoH0pCW3.json.gz"
Having an understanding of what your CloudTrail logs contain can really help you grasp the value of having them. I suggest that you create a trail in your own account and review the contents of the logs to see how useful they can be. When working with more than one AWS account, it can be difficult to review all of your log files, so in the next section, I will explain how to consolidate your log files from multiple accounts into a single bucket.
Consolidating multiple logs from different accounts into a single bucket
In circumstances where you have multiple AWS accounts, you will want to implement a level of management and control. Thankfully, with AWS CloudTrail, you can consolidate logs from multiple accounts into a single S3 bucket, thereby reducing the amount of administrative effort needed to manage them:
- Log in to your AWS Management Console in the account that owns the S3 bucket.
- Navigate to S3 via the AWS Management Console dashboard and select the S3 bucket that you want to act as the central bucket for other AWS accounts. In this example, I have the cloudtrailbucketstu bucket:

- Select the Permissions tab:

- Now select Bucket Policy:

- From here, you need to edit the policy to allow your other AWS accounts to access this bucket. You need to find the Resource section following the “Action”: “s3:PutObject” section. In this example, it is listed as follows:

- From here, you need to add another resource ARN, replacing the AWS account number with the account number of your other account. Ensure that you add a new resource for each account you want to add. It will then look something like the following:

- Here you can see that I have added another resource ARN. Select Save.
- Log in to the AWS Management Console of the account that you just added the ARN for and navigate to AWS CloudTrail.
- Create a new trail, following the steps from earlier in this chapter, until you get to Storage location:

- Select No when asked whether you want to create a new S3 bucket; instead, add the name of the bucket from the primary account.
- Continue to configure your trail as required and select Create. Your logs for this trail will now be delivered to the bucket specified from the primary account.
If I now log back in to my primary account and navigate to the S3 bucket, I will be able to see that a new folder has been created, identifying the account that I just added and showing that all logs are now being delivered to this bucket for each account:

The consolidation of logs into a single bucket can really help to ease the management burden when working with multiple accounts. When using CloudTrail at scale, this can help your teams manage logs more effectively in a single location, allowing you to enforce the correct level of access security on a single bucket, instead of having to do so for multiple buckets in different accounts.
Making your logs available to Amazon Athena
With so much valuable data within your CloudTrail logs, finding effective ways to query the data for specific entries can be made easier when using Amazon Athena.
Amazon Athena is a serverless service that allows you to easily analyze data being stored within Amazon S3, such as your CloudTrail logs, using an interactive query service that uses standard SQL. As a result, it is a very effective service to help you scan huge datasets. The configuration of Amazon Athena is outside of the scope of this book; however, more information on this service can be found at: https://aws.amazon.com/athena/.
Making your logs available to Athena to enable enhanced querying is a simple process:
- From within the AWS Management Console, select AWS CloudTrail.
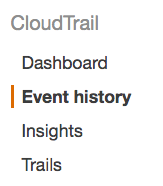
- Select the Event history option from the left menu:
- Select Run advanced queries in Amazon Athena:
![]()
- From the Storage Location drop-down list, select the S3 bucket that contains your CloudTrail logs:

- Select Create table. The table is then automatically created in Amazon Athena.
Using Amazon Athena, you can then create queries using SQL to search for specific content within your CloudTrail logs, enabling you to track and trace specific data that you want to be filtered within your results.
Using the CloudWatch logging agent
As you are probably aware, Amazon CloudWatch is the main monitoring service used in AWS and collects data and metrics from all the supported AWS services. This allows you to gain a better understanding of the performance of your environment. In addition to the built-in CloudWatch metrics, CloudWatch also allows you to collect valuable logging information from many different AWS services, such as EC2 instances, Route53, and CloudTrail.
Using CloudWatch logs as a central repository enables you to view real-time logging information from your services, which can be filtered and queried to search for specific events or error codes that you want to be made aware of, allowing you to respond accordingly.
In this section of the chapter, I want to explain how you can use the CloudWatch logging agent on your EC2 instances to enable you to send log data generated from your EC2 instances or any applications that may be running on your instance. This log data is in addition to the default CloudWatch metric data that is collected by CloudWatch.
There are a number of different ways to configure your instances. In this example, I will explain how to perform the configuration using the AWS Systems Manager (SSM). This will essentially involve three different steps:
- Create the new roles that will be required.
- Download and configure the CloudWatch agent.
- Install the CloudWatch agent.
Creating new roles
You will need to create two new roles: one of these roles will have the permission to read and collect log data and send it to CloudWatch Logs to be written, and the other role is used to communicate with SSM to create and store your agent configuration file, allowing you to use the same agent configuration on your fleet of EC2 instances.
Create the first role, which will be used by your instances to collect log data using the following configuration information. I explained how to create roles in Chapter 3, Access Management, so please refer back to that if you need assistance in role creation. I have avoided going into the details here:
- Select the type of trusted entity, then select AWS service.
- Choose the service that will use this role – select EC2.
- In the policy list, select both CloudWatchAgentServerPolicy and AmazonSSMManagedInstanceCore.
- In Role name, enter CloudWatchAgentServerRole or another meaningful name.
For the second role, which is used with the parameter store, use the following configuration:
- Select the type of trusted entity and select AWS service.
- Choose the service that will use this role – select EC2.
- In the policy list, select both CloudWatchAgentAdminPolicy and AmazonSSMManagedInstanceCore.
- For Role name, enter CloudWatchAgentAdminRole or another meaningful name.
Once your roles are created, you need to download the CloudWatch logging agent and configure it.
Downloading and configuring the agent
Before downloading and installing the CloudWatch agent, you need to ensure that your EC2 instance is running at least version 2.2.93.0 of the SSM agent. If you need to update the SSM agent, please follow the instructions at: https://docs.aws.amazon.com/systems-manager/latest/userguide/sysman-install-ssm-agent.html.
Another prerequisite is that your EC2 instances need to have outbound internet access to enable them to send data to CloudWatch Logs. The endpoints and port information used for both logging capture and SSM can be found at: https://docs.aws.amazon.com/general/latest/gr/rande.html#cwl_region.
Once you have met the prerequisites, you can download the agent using SSM as follows:
- From within the AWS Management Console, navigate to the SSM console found under the Management and Governance category.
- Under Instances and nodes on the left-hand side, select Run Command:

- In the Command document search field, enter AWS-ConfigureAWSPackage to search for that document:
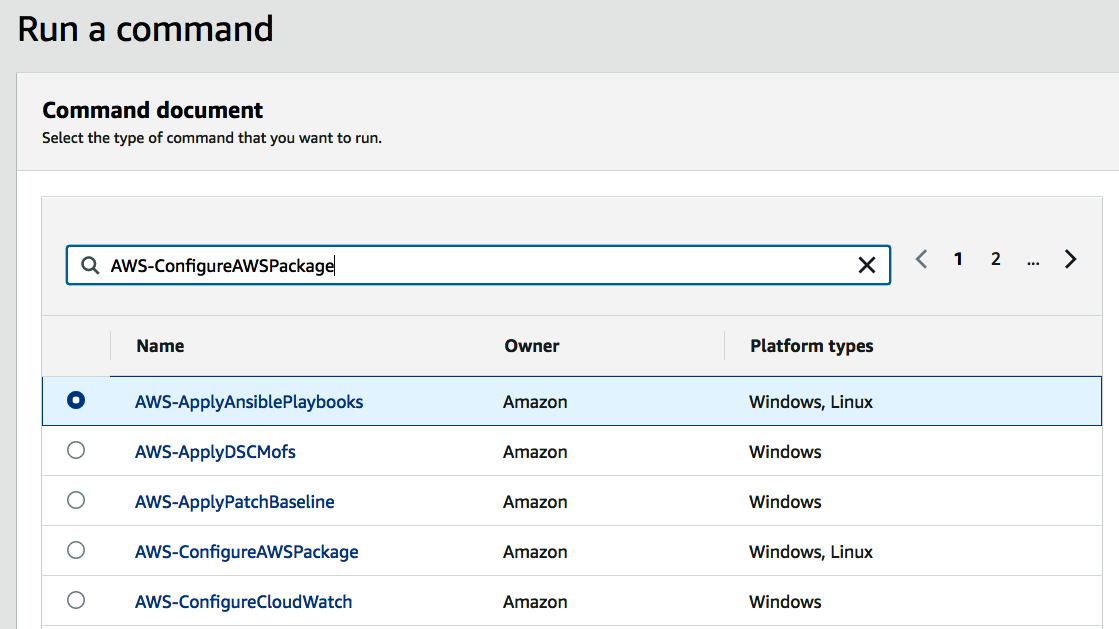
- When the document is found, select it using the radio button:

- Under the Command parameters section, enter the details as shown here:

- In the Target section, select your EC2 instance:

- Under Output options, you can optionally add a destination for the output of the command either in S3 or a CloudWatch Logs log group:

- Select Run. You will then be shown the status of your command being issued:

When the command has completed, you then have to create and modify the downloaded agent configuration file before it's installed on any of your other EC2 instances. This configuration file allows you to customize the agent via a series of questions. One of the easiest ways to create the configuration file for the agent is to use a wizard.
If you are running Linux, then enter the following command from your EC2 instance that you just issued the command on:
sudo /opt/aws/amazon-cloudwatch-agent/bin/amazon-cloudwatch-agent-config-wizard
If you are running Windows, then run the following:
cd "C:Program FilesAmazonAmazonCloudWatchAgent"
amazon-cloudwatch-agent-config-wizard.exe
You must then answer a series of questions, ensuring that you select Yes when prompted on whether to store the file in the SSM parameter store. This enables the configuration file to be copied to SSM, allowing it to be pushed out to your remaining EC2 fleet.
Installing the agent on your remaining EC2 instances
Finally, to install the configured CloudWatch agent for your remaining EC2 instances, you need to ensure that your EC2 instances meet some prerequisites.
Firstly, ensure that the EC2 instance is running the SSM agent version 2.2.93.0 or later. If you need to update a Linux-based instance, visit https://docs.aws.amazon.com/systems-manager/latest/userguide/sysman-install-ssm-agent.html; for Windows-based instances, visit https://docs.aws.amazon.com/systems-manager/latest/userguide/sysman-install-ssm-win.html.
Your instances must have outbound internet access to send CloudWatch logs to CloudWatch. For more information on understanding outbound internet access, please refer to Chapter 7, Configuring Infrastructure Security.
Once you have met the prerequisites, follow these steps to install the agent on your remaining E2C instances:
- Attach the CloudWatchAgentServerRole role you created earlier to any instances that you want to install the CloudWatch agent onto.
- From the SSM console, select Run Command and enter AWS-ConfigureAWSPackage:

- Under Action, select Install:

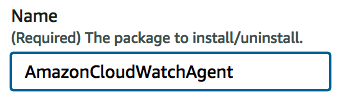
- Under Name, enter the name of the package to install – AmazonCloudWatchAgent:
- In the Targets area, select the EC2 instance targets that you want to install the CloudWatch agent onto.
- Select Run.
In this section, we focused on the CloudWatch logging agent and how it can be installed at scale, using the SSM service. By having the CloudWatch agent downloaded and installed on your EC2 instances, you now have the ability to capture more information on your EC2 instances to help you monitor their status and performance.
Summary
Within this chapter, we focused on Amazon S3, VPC Flow logs, AWS CloudTrail, and Amazon CloudWatch, all of which provided logging capabilities. I looked at how these were configured to capture log data to allow you to analyze them for suspicious activity.
An integral part of building a secure infrastructure is being able to collate and retrieve logs as and when required to help you identify the source of a threat even before it has happened. If you want to become an AWS security specialist, then take the time to investigate and understand which of the AWS services provide logs and how you can manage and monitor them to give you insight into your environment.
In the next chapter, I will be focusing on AWS auditing and governance and some of the services used to implement these measures, such as AWS Artifact, AWS CloudTrail, AWS Config, and Amazon Macie.
Questions
As we conclude, here is a list of questions for you to test your knowledge regarding this chapter's material. You will find the answers in the Assessments section of the appendix:
- True or false: Amazon S3 server access logging is enabled by default.
- Amazon S3 object-level logging closely integrates with which other AWS service?
- Which logging feature allows you the ability to capture IP traffic across the network interfaces attached to your resources?
- True or false: A VPC Flow Log can be configured for a subnet with a VPC.
- Which AWS service can be used to easily query AWS CloudTrail logs, enabling you to search for specific data?
Further reading
- Security at Scale (AWS White Paper): https://d1.awsstatic.com/whitepapers/compliance/AWS_Security_at_Scale_Logging_in_AWS_Whitepaper.pdf?did=wp_card&trk=wp_card