12
Continuous Deployment to Production
As we continue our journey through the Continuous Delivery Pipeline, we have designed features to test a benefit hypothesis during Continuous Exploration. Implementation of these features happened during Continuous Integration where we created stories, developed changes and tests, and put our changes through the build and test process. Ultimately, our change is placed in a staging environment.
With Continuous Deployment, we complete the journey of the change to the production environment. However, the activities don’t end with the deployment to production.
In this chapter, we will take a look at the practices that enable the following actions in Continuous Deployment:
- Deploying a change to production
- Verifying proper operation of changes in the production environment
- Monitoring the production environment
- Responding to and recovering from production failures
It’s important to remember that we separate deployment from release. We viewed the architectural concerns of enabling new changes to be automatically deployed to production environments in Chapter 10, Continuous Exploration and Finding New Features. While we continuously deploy to production, those changes are not visible to the customer until we release them. We talk about allowing only select people to view those changes in production in this chapter. We will talk about releasing on demand in our next chapter, Chapter 13, Releasing on Demand to Realize Value.
Let’s begin our exploration of Continuous Deployment by looking at the first activity: deploying to the production environment.
Deploying to production
The goal of deployment is to get our solution in terms of a new product or enhancements to an existing product into a production environment. With Continuous Deployment, we want to move this solution as frequently as we can while minimizing the risk to our production environment.
The following practices allow us to deploy more frequently and reduce the risk of failures in the production environment:
- Setting up dark launches
- Employing feature flags
- Automating deployment
- Infrastructure as code
- Selective deployment
- Self-service deployment
- Version control
- Blue/green deployment
We have looked at version control in previous chapters, notably Chapter 11, Continuous Integration of Solution Development. We have also discussed blue/green deployment in that same chapter.
Let’s examine the remaining practices and how they can increase deployment frequency while reducing risk.
Increasing deployment frequency
We saw in Chapter 1, Introducing SAFe® and DevOps, the set of practices that allowed Flickr to announce at the Velocity conference that they were able to perform 10 deploys in a day. They accomplished this with the creation of scripts that would deploy upon passage of all tests.
Today’s automation and practices are an evolution of Flickr’s initial successes with automated deployment. To that end, we will examine which practices are in use today and how.
Let’s begin our exploration with a look at today’s deployment automation.
Deployment automation
The scripting that allowed Flickr to automate their deployments reduced the time from code commit to deployment from days to hours. With the modern evolution of that scripting, the CI/CD pipeline further reduces the time of deployment from hours to minutes or even seconds. Let’s see how that is done.
In the overall Continuous Delivery Pipeline, we saw the introduction of automation during Continuous Integration. The automation allows for building, testing, merging, and packaging operations without manual intervention as much as possible, as shown in the following diagram.

Figure 12.1 – CI and CD automation
We continue the use of automation in Continuous Deployment as illustrated in the preceding diagram. In Continuous Deployment, we take the application packaged at the tail end of Continuous Integration and deploy it to the test environment. After system-level testing is performed on the test environment, the application package is then deployed to the production environment. Such automation may be done by tools that combine Continuous Integration and Continuous Deployment, such as Jenkins and pipelines from GitLab and Bitbucket. Continuous Deployment automation may be separate from Continuous Integration in tools such as ArgoCD. Several pieces in terms of technology and practices help enable effective automation in Continuous Deployment.
The first important piece is version control. We’ve seen the importance of version control for text-based artifacts as the trigger for the CI/CD pipeline and as a way of connecting all artifacts together for understanding everything involved in a particular deployment or release.
Artifact repositories can act as version control for large, binary-based artifacts that can’t be stored in text-based version control systems. They store intermediate builds, code libraries, virtual machine images, and Docker containers that may be created as part of a build process. If a component does not require a rebuild and test, its artifacts may be directly retrieved from the artifact repository, saving time and effort.
The size of changes is another factor that can also reduce the time automation takes to deploy to production. We’ve seen in Chapter 4, Leveraging Lean Flow to Keep the Work Moving, that batch size is an important factor in encouraging flow. A small independent change will go through much faster than a large change that may start a lot of rebuilding and testing in the CI/CD pipeline.
Automating as many steps as possible, including the push to deployment, will dramatically reduce the lead time for deployment. Allowing automation to proceed to further steps in building and testing throughout the Continuous Integration and Continuous Deployment stages keeps the momentum happening without delays because manual actions are needed to proceed to the next step. This may reduce the deployment time to seconds instead of minutes.
Infrastructure as code
A key part of deployment automation is the creation and configuration of resources in production environments. Infrastructure as Code (IaC) allows us to define the desired infrastructure in terms of the resources and their configuration in terms of text-based descriptions. These configuration files are used by tools in conjunction with configuration management to create new resources, update resource configurations, or even tear them down if required. As mentioned in Chapter 3, Automation for Efficiency and Quality, popular IaC tools include Hashicorp’s Terraform and AWS CloudFormation for Amazon Web Services environments.
Version control plays a key part in establishing a smooth IaC process by ensuring that the evolution of configuration files is recorded and maintained. If a change to a product requires a change to the configuration in the production environment, the changes to the configuration file are created and tested in the staging environment. Tags in version control would serve to link together all artifacts associated with the change, from source code to tests to configuration file changes.
This process of building and testing the configuration files is no different than developing the product or its tests. This helps ensure that the resulting resources created in the production environment are reliable and in sync with any product changes.
Selective deployment
In some organizations, a production environment can be separated into multiple production environments. This separation can be based on some of the following factors:
- Infrastructure/resources
- Geography
- Customer
A selective deployment takes advantage of the separation by allowing deployment to happen at one instance of the production environment. An example of a selective deployment to an environment dedicated to a single customer is shown in the following illustration.

Figure 12.2 – Selective deployment to Customer A’s production environment
Our preceding example allows for testing to occur in a limited production capacity with Customer A, while other customers in other production environments do not see the change. Deployment in one of several environments allows for a flexible release strategy, such as a canary release where changes are released to specific regions or customers before releasing to the entire customer base. We will discuss canary releases in more detail in Chapter 13, Releasing on Demand to Realize Value.
An example of real-world selective deployment happens at Facebook. As Facebook grew in popularity, the release engineering team kept up with the development activity by working on a push from master system that allowed for changes to be released more frequently. As detailed in https://engineering.fb.com/2017/08/31/web/rapid-release-at-massive-scale/, deployments started with 50% Facebook employees, then 0.1% of the Facebook production traffic, eventually rolling out to 10% of Facebook production traffic.
Self-service deployment
There may be justifiable reasons that your organization cannot allow automation to deploy to your production environment. Generally, this is done to adhere to compliance policies.
If this is the case, self-service deployment (often called one-button deployment) allows anyone, usually developers, to deploy changes that have passed Continuous Integration into production. This method still uses automation to perform the actual deployment, so developers do not have unrestricted access to the production environment.
The deployment using automation is still recorded and audited so that the complete activities are tracked. This traceability of every automated deployment may give confidence to business compliance offices to allow a move to automating deployment.
Reducing risk
Jez Humble, in the book Continuous Delivery: Reliable Software Releases through Build, Test, and Deployment Automation, famously said the following about deployment: “If it hurts, do it more frequently, and bring the pain forward.” We have seen key methods for doing deployment more frequently. We will now look at practices that may help us deal with the pain of deployments.
The following practices allow us to mitigate the risk of introducing failures in the production environment:
- Dark launches
- Feature flags
- Blue/green deployments
- Version control
Blue/green deployments and version control were discussed in previous chapters. For this chapter, let’s focus our exploration on the other mitigations.
Feature flags
Feature flags (or feature toggles) are the primary mechanism for implementing both dark launches and canary releases. By selecting the visibility of the feature in terms of whether the flag is enabled or disabled, you effectively separate the deployment of new features with the release of the feature where it is available to all users.
Feature flags also allow for quick rollbacks should problems arise in production. At the first sign of a problem, simply disable the feature flag.
When setting up feature flags, it is important to test the behavior of the feature flag at both positions: test the effects when the feature flag is enabled, and then when it is disabled. This testing should be done in the staging environment, well before it is deployed to production.
The presence of feature flags does add to the overall complexity of the solution by adding more permutations for testing behavior. Too many feature flags in play, especially obsolete feature flags for features long released, introduce more complexity in testing and technical debt. Obsolete feature flags should be removed at the first opportunity.
Dark launches
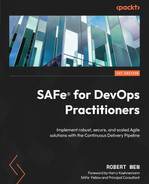
Dark launches allow features in the production environment to be visible to only developers, testers, and generally beta or select customers and not to the entire customer pool of users. To allow for dark launches, organizations typically use feature flags to allow or disallow the visibility of the feature based on the group that requires visibility.
An example of a dark launch for developers and testers using feature flags is detailed in the following illustration.
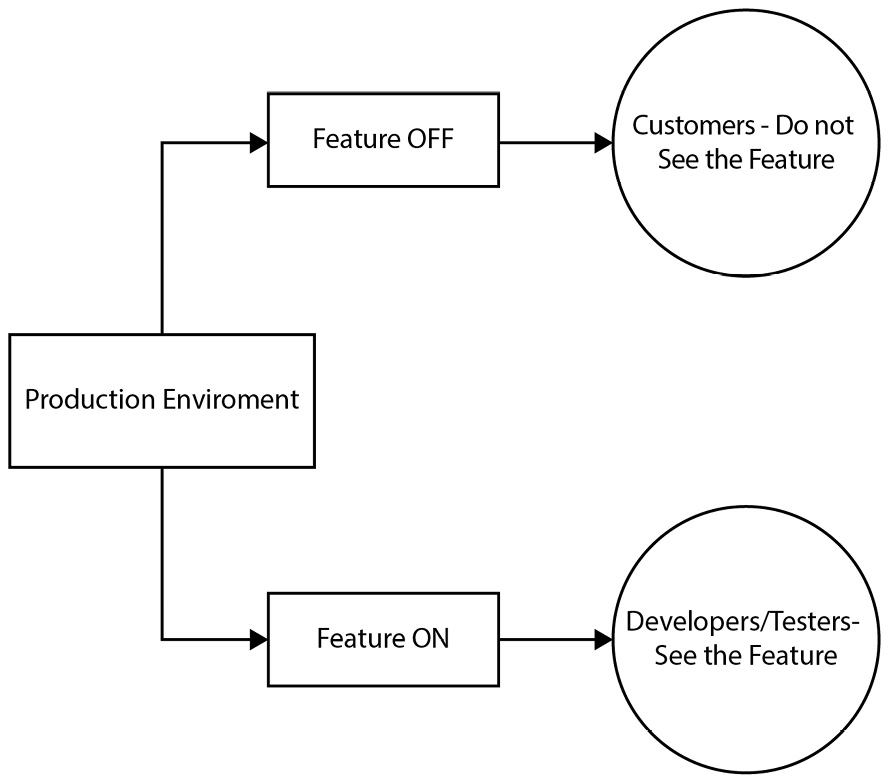
Figure 12.3 – Example of a dark launch using feature flags
In our preceding example, a new feature is visible to the developers and testers in the production environment. This visibility allows them to run experiments on this feature without affecting the customers, who do not see the feature.
Developers and testers can use dark launches in the following ways:
- Testing new application infrastructure
- Dynamically control which early customers can see new features
- Experimentation of new features
Dark launches are often synonymous with canary releases. The primary difference between a dark launch and a canary release is that the feature flag allows visibility to a select group of customers to determine their reaction to the new feature in canary releases.
We now need to see that these changes do not adversely affect our current production environment, even if these deployed changes are not released. To do this, we need to test. Let’s examine our testing process in production.
Verifying proper operation
The changes to the product, in the form of new features, are now in the production environment, but this doesn’t mean that the work is over. In fact, it has only begun. We need to see that our features function as we expect. This is true from a functional perspective, but also from other perspectives relating to NFRs.
The following practices allow us to verify correct behavior in the production environment:
- Production testing
- Test automation in production
- Test data management
- Testing NFRs
Some of these practices were introduced in the previous chapter but now that we are looking at the production environment, we can examine them closely. Let’s look at all these practices and their application to production.
Production testing
With feature flags in place as part of a dark launch, testing can continue against the resources of the production environment. While testing in the production environment is no greater simulation of the conditions that the production environment has, the tester should still approach testing in the production environment with caution. Production testing offers the following advantages:
- Allows for monitoring application performance in real-time, realistic scenarios
- Monitoring application performance against real-time traffic
- Further detection of bugs and malicious attacks
- Helps maintain the quality of the application
The tests run in production really should be the ones near the top of the testing pyramid in combination with a subset of tests run in the previous stage of Continuous Integration as a sanity check. We are really looking to confirm that the behavior of the features we are about to release is what we expect. All other aspects of the testing pyramid should have been covered in the tests run in test environments and in the staging environment. Testing in production complements the earlier testing. It is not meant to substitute for earlier testing.
Successful testing in production requires a detailed understanding of the following factors:
- Use real browsers and devices in the production environment. Emulators or simulators may have been used in testing environments, but they may not exhibit the same behavior as the “real thing.”
- Allow real traffic of the production environment for the measuring of application performance under load. This is, after all, the traffic the application will face.
- Use feature flags to allow for a small population of developers, testers, and beta customers to experience the new feature. Feature flags also allow for the quick disabling of features to everyone if problems occur.
- While production testing is occurring, the monitoring of the production environment must be continuous. This allows for the rapid shutdown of any tests at the first sign of a problem. In addition, reversion of test operations may be necessary.
- Use dedicated test user accounts so logging can determine what test transactions are versus real transactions.
A key test performed in production is an A/B test. In A/B testing, feature flags may direct beta customers to the new feature under test (option “A”) to gauge whether that new option has a change in behavior over the current application available to the rest of the user population (option “B”).
Test automation in production
Feature flag management is important when testing in production. Feature flags will not only determine whether a feature is visible, but also to whom that feature is visible.
A key use case of feature flag management occurs at Facebook. In the blog article at https://www.facebook.com/notes/10158791573022200, an engineer at Meta, Facebook’s parent company, describes how they use Gatekeeper to establish A/B testing for every UI change with real Facebook users. Gatekeeper ensures that real users are subjected to the testing of a single UI element and that the A/B tests don’t conflict.
Because they are evaluating small changes, Facebook knows that some users may have a less than ideal user experience, but Facebook is striving for a better overall product. To that end, if enough users don’t use the UI element change, it is regarded as a failed test and never makes its way to the entire Facebook population.
Test data management
While A/B testing may work to determine whether a given feature will be used by the end users, other testing may have to occur in production to see whether the desired flow and messaging occur for that feature.
Synthetic transactions use automated testing scripts to verify the end-to-end performance of our application in production. The scripts simulate the actions a user would make to complete a transaction. The synthetic transactions, and their responses made by the application, are recorded by synthetic monitoring tools. Allowing synthetic monitoring and testing with synthetic transactions allow testers behind feature flags to verify the following characteristics of the application:
- Functionality: Is the application moving through the correct pathways?
- Availability: Is the performance of the application in the production environment adequate?
- Response time: This is another measure of the application’s performance in the production environment.
Synthetic monitoring allows you to understand the key flows of your application and how well they are performing. These may also provide important things to check with monitoring tools when released.
Testing NFRs
Having the new features deployed into the production environment while visible to a select few through feature flags allows for the evaluation of key NFRs before release.
Synthetic transactions and monitoring allow for performance testing while in the production environment. The reception of a sample of the real traffic in the production environment allows for vulnerability testing.
Testing of NFRs in the production environment is one of the important last checks of a feature before release. This is an important step that cannot be missed. Synthetic transactions and feature flags can allow for low-risk testing of NFRs to ensure that the production environment remains robust.
As we examined performing tests in the production environment, we have discovered that a pivotal part of the verification is continuous monitoring. We will now discover what is needed for continuous monitoring to occur.
Monitoring the production environment
Monitoring the production environment allows us to understand whether the NFRs of the environment are still being maintained as well as whether new functionality deployed as features are functional and performing based on the constraints identified in NFRs.
There are a few practices that are instrumental in providing continuous monitoring. Let’s examine what these practices are and how to ensure that they are established in our production environment.
Full-stack telemetry
We need to monitor at various levels important measurements of our solution for a number of reasons. At the lower levels, we want to ensure that our production environment is stable and in no danger of failure. As we move to look at our system at higher levels, we want to ensure that we have measurements that allow us to determine whether our business hypothesis that started the development can be proven. Ultimately, at the business level, the measurements we take can gauge whether development is in line with our strategy or whether strategic alignments must be made.
These measurements taken for the range of levels we want are called full-stack telemetry. An example detailing the levels and sample measurements is in the following table.
|
Level for Measurement |
Sample Measurements |
|
Business |
Value Stream KPIs (Cycle Time, Lead Time) and Solution KPIs (revenue, NPS, and conversion rate). |
|
IT Service Management (ITSM) |
Service Level Objectives and other Service KPIs (Server uptime and network availability). |
|
Product or Solution |
Garbage Collection metrics, Response Time, Availability, and Application logs. |
|
Infrastructure |
CPU Utilization, RAM Utilization, Networking metrics, and Event logs. |
Table 12.1 – Sample measurements for levels of the solution
The required measurements must be designed during the Continuous Exploration stage of the Continuous Delivery Pipeline to ensure they can be easily collected during Continuous Deployment and beyond. The planned measurements should include data for both business use for measuring the benefit hypothesis as well as technical data that can tell us the state of the system in production.
Visual displays
Mountains of data can be collected through full-stack telemetry. What makes the data useful is organizing the data so that users can tell the state of the environment at a glance as well as identify when action must be taken quickly.
Dashboards provide a key way of visualizing data collected. The visualization is beneficial for identifying trends or understanding whether an important metric has exceeded a threshold that may indicate a failure in production.
The following is an example dashboard. This is the public dashboard for the cloud version of Grafana, a product used to create dashboards.

Figure 12.4 – Example dashboard from grafana.org
As important as it is to have a dashboard, it is just as important that the dashboards are visible to everyone in the organization. Transparency allows everyone on the value stream to have all the necessary information without waiting for approvals or debating whether they’re allowed to see individual measurements.
Federated monitoring
Transparency in displaying data visualization may be difficult in complex organizations with many lines of business, business units, and other groups. To ensure information is not placed in silos, thought may be placed onto how to ensure the information is federated and easy to share and exchange. The following figure is an illustration of a dashboard that displays federated information.

Figure 12.5 – Example of a federated dashboard
In the preceding figure, the dashboard displays the measurements for the selected system (System B). Information for the other systems is available by selecting the appropriate system in the control.
Sharing information in a federated structure allows for more transparency while encouraging agility in individual business units. This data from other sources should be combined with the local business unit information, allowing for a more holistic view of the business unit’s system. Dashboards and other information display mechanisms can display the system data and allow ways to drill down and view the data and its source.
With the wide variety of data shared and visible on dashboards, organizations can continuously monitor their production environment. This can prepare them for production failures that may occur when releasing new features. Let’s examine the practices they can employ when a production failure occurs.
Responding and recovering when disaster strikes
The ability to recover quickly is a key feature of a DevOps approach. One of the key DORA metrics is Time to Restore Service, with elite functioning DevOps organizations able to do so in minutes. Preparing for recovery is a major part of the CALMR approach.
To facilitate recovery, we look at the following practices:
- Proactive detection
- Cross-team collaboration
- Chaos engineering
- Session replay
- Rollback and fix forward
- Immutable infrastructure
A proactive response is important in production because this is the environment where the end users are. Problems here are visible and affect our customers. Problems not immediately handled can affect other work in other parts of the Continuous Delivery Pipeline.
Let’s examine the practices that allow us to be proactive in the production environment.
Proactive detection
Because we are using feature flags to separate deployment from release, we can proactively test and look for problems without disrupting customers, or worse, having our customers discover the problems. Feature flags enabled for testers allow them to examine new features in the production environment.
With this unique opportunity to have new features in the production environment without disturbing customer traffic, testers can perform additional testing, employ “what-if” scenarios, and eventually plan disaster recovery procedures involving the release of the new feature.
Cross-team collaboration
Problems that are visible to the customer and that have little information to start with may be a breeding ground for people to blame one another. The pressure increases on a very visible problem with feedback from angry customers. A solution may not be apparent early on. It is this type of stress that may test the idea of cross-team collaboration working, but it has shown itself the most effective way to solve such problems.
Having people from various disciplines in Development and Operations was one of the keys to the success at Flickr that we originally discussed in Chapter 1, Introducing SAFe® and DevOps. This collaboration across the different groups is still key to this day.
To have true collaboration, we need to work toward the mission-based, psychologically-safe generative culture we identified in Chapter 2, Culture of Shared Responsibility. With the movement to that type of culture, collective ownership happens and teams work together across disciplines to identify the root cause of problems and find solutions quickly. The problems then become opportunities for learning.
Chaos engineering
A worthwhile exercise that you can do proactively before releasing the feature is to perform a chaos engineering exercise, taking advantage of the feature flag so the effects are not seen by active customers.
The most famous example of chaos engineering is done by Netflix. As detailed in the blog article at https://netflixtechblog.com/the-netflix-simian-army-16e57fbab116, Netflix runs a set of tools they call the Simian Army to simulate production outages in the Amazon Web Services cloud. The most famous of these is Chaos Monkey, which simulates a virtual server going down. These experiments are run during the business day, with plenty of engineers watching and addressing problems found.
You can run an exercise that is similar to an execution of Chaos Monkey. Run the experiment to simulate an outage condition to see whether your new feature is resilient enough. At the end of the experiment, determine the next steps with a debrief.
The complete approach is detailed in Chapter 6, Recovering from Production Failures. Chaos engineering exercises can be performed on existing features that have been already released if there is sufficient time available in the error budget. Exercises can be performed on unreleased features with robust feature flag management.
Session replay
A useful tool for troubleshooting is session replay. Session replay is the ability to record individual users’ transactions and replay those transactions. The ability to perform session replay has the following benefits:
- Developers can understand where users may have problems with the usability of a website and it gives insight on how users are really using a given feature
- Developers can see the actions used to perform a fraudulent transaction on a website, which can lead to closing vulnerabilities
- For a production failure, developers can see the exact sequence of actions that users perform to cause the failure
Session replay that is performed on the client side presents the action from the end user’s point of view. These tools allow developers to see the position of the cursor, what clicks are made, and what gets typed in a video-like replay session. Dynatrace and Datadog are examples of tools that offer session replay.
Server-side-based session replay captures all website traffic and includes input of what gets typed and what gets clicked. Scrolling and mouse movements are not captured.
When using session replay, attention must be given to the session data. Such data typically contains private information such as passwords and may require large amounts of storage capability.
Rollback and fix forward
When production failures do occur, two quick methods to return to a stable environment include rollback and fix forward.
Rollback involves reverting the production to a previous iteration, one that doesn’t include the most recent change that probably caused the production failure. As we saw in Chapter 6, Recovering from Production Failures, two common methods of rolling back are blue/green deployments and feature flags.
Blue/green deployment is an easy way to roll back a production environment to an idle environment and the formerly idle environment back to the active state. Attention must be paid to components that represent state, such as databases or volatile storage. Those components require careful reversion when the transition back occurs.
Feature flags are an easy way to remove the visibility of the new feature when its release causes a production failure. A toggle of a feature flag back to off does not require an extensive code or configuration change.
Fixing forward is another method for getting the production environment stable after a production failure. To fix forward, you develop and propagate the fix for the failure through the Continuous Delivery Pipeline so that it is deployed and released to production. When performing a fix forward, it is recommended that you use the standard deployment process through the Continuous Delivery Pipeline and not skip any testing. Bypassing testing to create a “quick fix” can lead to greater technical debt.
Immutable architecture
A primary reason for automating deployment to testing, staging, and ultimately the production environment is to make the architecture immutable. That is, any change in the environment cannot be made manually.
Any change in any environment must be made through the Continuous Delivery Pipeline and every artifact needed for that change must be recorded in version control. The close coupling with version control and the Continuous Delivery Pipeline prevents configuration drift or the difference in changes between environments.
Summary
In this chapter, we continued our exploration of the Continuous Delivery Pipeline into the production environment. Our feature after having finished design in Continuous Exploration and development and testing in Continuous Integration, now finds itself ready for deployment to production. Automation plays a key role here in executing the steps to bring the change into the production environment, possibly using IaC to create and configure new production resources.
Even with the new change in production, testing is performed to build confidence before release. Feature flags allow engineers and select beta customers to perform testing on new changes in production while concealed from the general user population. Test data in the form of synthetic transactions allow functional testing and testing of NFRs to occur.
Monitoring in the production environment allows us to see the success or failure of the testing in production. We want to ensure we are looking at the correct measurements from system resources all the way to those metrics that may serve as leading indicators that the changes we want are realizing our benefit hypothesis. We want this data visible on dashboards and transparent to everyone. If monitoring indicates problems in production, we are ready to act. The entire value stream works together to find the root cause. We can roll back to a previous version or fix the problem and propagate the fix using the Continuous Delivery Pipeline.
Our change is now in the production environment. We now wait for the last event: releasing to our users so they can use it to their advantage. For this, we will examine the last stage of our Continuous Delivery Pipeline, release on demand, in our next chapter.
Questions
- What helps reduce the lead time to deploy to production? (pick 3)
- Unit testing
- Small batches of change
- Version control
- Behavior-driven development
- Automating deployment
- What practice allows you to perform canary releases?
- Infrastructure as code
- Blue/green development
- Selective deployment
- Self-service deployment
- Feature flags allow … (pick 3)
- Testers to view unreleased features in production
- You to run unit tests faster
- Developers to start a deployment to production
- Rollback of a new feature in the event of a production failure
- A select group of customers to do A/B testing
- The execution of a CI/CD pipeline
- Running a synthetic transaction in production can help measure … (pick 3)
- Cycle time
- Functionality
- Scalability
- Availability
- Response time
- What levels of operation should full-stack telemetry measure?
- IT service management
- Business
- Solution
- Infrastructure
- All of the above
- What information can be played back in a server-side session replay?
- Scrolling down the web page
- Input fields on a web form
- Moving the mouse cursor from left to right
- Horizontal scrolling to a button
- How are changes to production made in an immutable architecture?
- The administrator changes a file in the production environment.
- The administrator changes a configuration file and executes the IaC tool to create the change.
- The administrator changes a configuration file, submits the change into version control, and executes the CI/CD pipeline.
- The administrator restarts the production server.
- Name two practices that help enable immutable architecture.
- Feature flags
- Version control
- CI/CD pipeline
- Blue/green deployment
- Behavior-driven development
Further reading
- A summary from Scaled Agile feature guidance on Continuous Deployment in the Continuous Delivery Pipeline: https://www.scaledagileframework.com/continuous-deployment/
- A look from a Meta (Facebook’s parent company) engineer describing how Facebook performs testing, deployment, and release: https://engineering.fb.com/2017/08/31/web/rapid-release-at-massive-scale/
- Continuous Delivery: Reliable Software Releases through Build, Test, and Deployment Automation by Jez Humble and David Farley – The authoritative guide on creating a CI/CD pipeline and detailing integration, deployment, and release.
- A blog article from LaunchDarkly, a vendor for feature flag management, describing the uses and benefits of feature flags: https://launchdarkly.com/blog/guide-to-dark-launching/
- An article describing the advantages of performing testing in production: https://www.softwaretestingmaterial.com/testing-in-production/
- A detailed blog article describing the uses and advantages of testing in production: https://www.tothenew.com/blog/testing-in-production-environment-what-why-and-how/
- An article describing how testing is done in production at Facebook using Gatekeeper to monitor the user tests in production: https://www.facebook.com/notes/10158791573022200/
- A blog article describing the use of synthetic transactions in testing new features: https://www.netreo.com/blog/synthetic-transactions/
- A blog article from Netflix engineers describing how they perform chaos engineering with the set of tools they call “the Simian Army”: https://netflixtechblog.com/the-netflix-simian-army-16e57fbab116