3
Automation for Efficiency and Quality
Of the factors in the CALMR (Culture, Automation, Lean Flow, Measuring, Recovery) approach, automation is the one most associated with the DevOps approach. A great deal of energy is devoted by DevOps practitioners to keeping current on trends in technology for environments and tooling. These tools, with different functions, are tied together to form a toolchain or pipeline.
We start our look at different types of tools in our pipeline by looking at the foundational tool types every pipeline needs. This includes Agile project management, version control systems, and review/documentation tools.
Continuous Integration (CI) tools stem from build management utilities. We will examine tools that create builds and other types of tools that run when a build is executed. These include automated testing tools, packaging tools, and artifact repositories.
An extension of CI is the deployment of build packages to staging and production environments. We will examine the tool types used in Continuous Deployment (CD), including configuration management, Infrastructure as Code (IaC), and vulnerability scanning tools.
Automation still relies on people. We will have a look at the ways development teams and operations teams can align to create the necessary automation and environments using DevOps topologies.
Finally, we’ll see how people create the automation for the Continuous Delivery Pipeline in SAFe® by examining what the system team does in the Agile Release Train (ART).
In a nutshell, the following topics will be covered in this chapter:
- Pipelines and toolchains
- Continuous integration
- Continuous deployment
- DevOps topologies
- The system team
Pipelines and toolchains
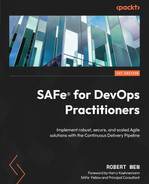
A toolchain is the set of tools used in DevOps practices in the product development life cycle. The classic representation of the toolchain used in DevOps is an infinity loop, broken up into a number of functions. Each function or stage is enhanced by automation. A representation of this infinity loop, created by Kharnagy, and licensed under the Creative Commons Attribution ShareAlike license, is shown in the following figure:
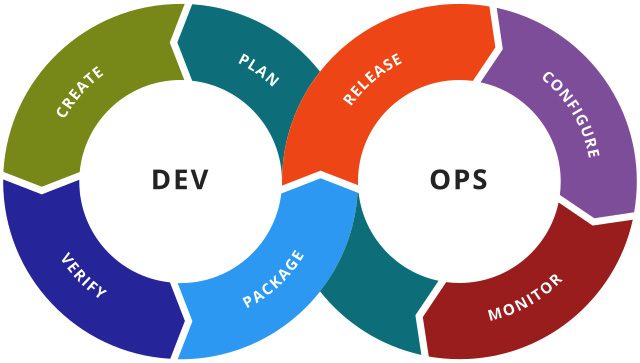
Figure 3.1 – DevOps toolchain
If we separate the ends of this infinity loop, we see the basis of our pipeline. The pipeline orchestrates the operation of all the stages with the exception of the monitoring stage. This begins our look at each pipeline stage, as shown in the following figure:

Figure 3.2 – DevOps pipeline
We begin our examination of the pipeline by looking at the activities whose artifacts set the pipeline in motion: plan and create. These foundational steps are illustrated in Figure 3.3:

Figure 3.3 – Pipeline foundations
Let’s start our examination of the CI/CD pipeline by looking at foundational tools. We will look at tools that can assist with planning in our value stream and monitoring the progress of the overall development process. We’ll also examine the tools that act as repositories for the code, tests, configuration scripts, and documentation.
Planning with Agile project management tools
To look at where we are from request to release, we need to find a way to understand what we must do, and what the progress is of those steps. There are a large variety of methods to achieve this, from physical Kanban boards to Excel spreadsheets. As teams deal with remote and geographically distributed ways of working, Agile project management tools are a popular method for doing this.
Agile project management tools allow for the creation and update of work items. Progress on the work items is displayed on either a Kanban board or a list of issues. Recording the work items and their progress allows for easy collection of progress metrics, such as lead time.
In addition, work items can be linked to branches in version control and executions in a CI/CD pipeline tool. This allows for a trail of when a change was released throughout the entire pipeline.
Leading Agile project management tools include Jira and Trello, both by Atlassian, Azure DevOps by Microsoft, Digital.ai Agility (formerly known as VersionOne), IBM Engineering Work Management (formerly known as IBM Team Concert), and Broadcom Rally. In addition, many version control tools such as GitHub and GitLab include Agile project management functions.
Creating code and documentation
Version control has been an important part of software development since the 1990s. With version control, multiple developers can work on the same code base without fear of deleting each other’s changes. To accomplish this, developers create a branch that contains their changes. When the time comes to share these changes, they merge the changes back into a shared branch where any differences are resolved. Merges can also be effective points for other developers to review any code changes going to the shared branch.
These days, code is not the only artifact kept in version control. Testing scripts used for automated testing can be kept in version control. Text files that are used for configuring staging and production environments are also kept in version control. In short, anything that is text that refers to any change or release is kept in version control. As we saw in Chapter 1, Introducing SAFe® and DevOps, when looking at Flickr, a common version control system between Dev and Ops is best.
The most prevalent version control system for code is Git, invented by Linus Torvalds, which was used as the repository for the Linux operating system. Git is a distributed version control system that allows copies of the entire repository to be easily replicated, even to developers. Even with the ease of replication, there are Git hosting solutions available that allow organizations to centralize the repositories to an origin. The most popular Git hosting products include Bitbucket by Atlassian, GitHub, GitLab, and Azure DevOps.
Documentation is another important artifact created for product development. Non-Functional Requirements (NFRs) may be detailed in specifications, architecture may be specified in terms of models and diagrams, and user interface/user experience (UI/UX) guidelines may be depicted as wireframes and sketches. These initial designs may start from planning and continue in the iterative learning cycles.
Document repositories and wiki software are used to store requirements specifications, architectural models, UI wireframes, and product and user documentation. Popular repositories include Confluence from Atlassian and GitLab Pages.
Once changes have been added to the repository in version control, the work of the CI/CD pipeline can begin. Let’s take a look at the activities that make up continuous integration.
Continuous integration
When code changes are ready, automation can begin building the necessary packages for use in staging and production environments. As part of the build process, tests can be run to determine the correct function as well as security. When testing indicates correct and secure functionality, a package is created and stored in artifact repositories based on the technology used.
This part of the pipeline is illustrated in the following figure:

Figure 3.4 – Pipeline: Continuous integration
Let’s look at how the CI portion of the pipeline manages a build, executes the initial-level testing, and packages the build. We will begin with a definition of continuous integration, continuous delivery, and continuous deployment.
Continuous integration versus continuous delivery versus continuous deployment
We will see that continuous integration captures the activities that can be automatically run once a change has been committed to the version control system. Code, including any changes, can be compiled or packaged to a form computers can use. Tests are run after the build step to ensure no bugs or security vulnerabilities have been introduced. Notifications can be created upon success or failure. Upon success, the code changes can be merged with the existing code base. We will examine these steps in detail when we look at the continuous integration stage of the Continuous Delivery Pipeline in Chapter 11, Continuous Integration of Solution Development.
Continuous delivery takes the continuous integration steps further by allowing the newly-merged changes to be packaged and delivered to a staging environment, a test environment that is as similar to production as possible, or to production. Once delivered to the environment, further tests can be run to verify the correctness of new features or to perform a deeper security scan. The success of these tests allows the organization to release the changes when they’re ready. Detailed steps outlining continuous delivery (labeled as continuous deployment) will be listed in Chapter 12, Continuous Deployment to Production.
Continuous deployment is continuous delivery with one further step: when the tests are complete in the production environment, the new features are automatically released to allow customers to use them immediately.
Regardless of whether your final stop in automation is continuous integration, continuous delivery, or you completely automate a release through continuous deployment, you will typically use the same tool to establish your pipeline. Let’s look at that category of tools now.
Orchestrating the change
Pipeline orchestration tools (commonly referred to as CI/CD tools) begin as build management tools. These tools execute build scripts and perform additional actions when triggered manually or automatically when a commit occurs in the version control system.
Earlier versions of CI/CD tools maintained the jobs to be done as part of the UI. CI/CD tools today allow jobs to be defined through a text file using YAML or other formats.
The power of the CI/CD tools lies in their flexibility. Easy integration with other tools to perform other functions, such as automated testing and deployment, has enabled overall success in the DevOps movement. Scalability in execution through the incorporation of agent software in worker nodes is another important factor, allowing jobs to be created in any environment.
CI/CD tools can be set up in on-premises environments, on private clouds, or as Software-as-a-Service (SaaS) products. The most popular CI/CD tool for on-premises or private cloud environments continues to be Jenkins, an open source project that started as Hudson. Other popular tools include CircleCI and Bamboo from Atlassian. Many Git hosting products have rolled out CI/CD pipeline extensions as part of their system, including GitLab, GitHub Actions on GitHub, Azure DevOps, and Bitbucket Pipelines on Bitbucket Cloud.
Verifying quality
By far, one of the most important functions a pipeline can do is set up and execute automated testing. Automated testing is gaining attention due to the shift-left philosophy with the realization that the earlier and more often you do testing, the better the quality of the finished product. The DevSecOps movement advocates for earlier and more frequent automated testing as a way of establishing continuous security. Early testing can be done without requiring the code to be executed in an environment either through simulated inputs and evaluating outputs or through an examination of the code.
These first-level tests are known as unit tests and static analyses. Let’s take a detailed look at them now.
Unit tests (test-driven development)
Unit tests are scripts written to verify that functions in code produce the desired output when given simulated input. Unit test frameworks such as JUnit and NUnit are specific to the language used to create the code. Unit tests can run directly from the pipeline as a defined stage.
Test management software can also be used to execute unit tests. Each unit test is saved as a test case in the test management software, and the results are recorded. Test management software can also set up an integration to Agile project management tools to record defects when tests fail.
Popular test management software includes Engineering Test Management from IBM, XRay from XBlend, and Zephyr from SmartBear.
Static analysis
Static analysis is the examination of code without executing it. Typically, tools are used to analyze and audit the code. Static analysis has other names depending on the expected outputs:
- Linting is a static analysis done with a specific tool (lint). Linting examines code looking for possible code errors and can be used to enforce coding standards.
- Static application security testing (SAST) is static analysis applied to searching for possible security vulnerabilities in code.
- Dependency scanning looks at the dependencies of libraries called by code to review whether known security vulnerabilities exist.
- License scanning looks at the dependencies called by code to review the type of open source licensing the libraries use. This helps keep the organization compliant with the types of open source licenses used and if attribution and distribution of changes are required.
Tooling that can perform the analysis described, including SAST, includes SonarQube from SonarSource, Snyk, Coverity from Synopsys, mend.io (formerly WhiteSource), Klocwork offered by Perforce, as well as GitLab.
Packaging for deployment
After the first level of the tests pass, the pipeline can then prepare the code changes. Packaging the changes is dependent upon several factors, including the language and the technology used for deployment.
Artifact repository tools allow for version control of large package images. These may pose problems with storage on the version control software mentioned previously because these artifacts are large binary files. These binary images may range from standard packages such as WAR files in Java or NPM images in Node.js, to virtual machine (VM) images. The popularity of Docker as a deployment technology has created a need to identify and version control Docker images in private repositories, resulting in additional capabilities for artifact repository tools.
Popular artifact repository tools include Artifactory by JFrog and Nexus by Sonatype. In addition, GitLab and Azure DevOps include the ability to act as an artifact repository for binary images.
Continuous deployment
During the continuous integration phase of the pipeline, we saw the last step as the packaging of changes into a binary image. Continuous deployment continues from that step to the application of that image into testing and production environments.
Automation may play a role in adding or updating resources in these environments. IaC tools allow the configuration of these resources.
Now that code changes are in an environment, testing can be done in further detail to find problems with quality and security. Here, the tests may also look at how changes affect the performance and validation of the desired changes.
As changes are added to environments, we need to be aware of the effects of these changes. To that end, we will measure the performance of the overall environment including the storage and analysis of logs.
The continuous deployment stage is illustrated in the following figure:

Figure 3.5 – Pipeline: Continuous deployment
Let’s look at these activities carried out in the environments. We may need to configure the environment to set up new features. Then comes the actual deployment of changes into the environment. Finally, more and deeper testing can be performed in the environment to ensure the correct function, security, and value.
Configuring environments with IaC
Often, changes may involve creating new resources in an environment. Part of the configurations in configuration management tools may invoke other tools that allow the automatic creation of resources. The creation of these resources is guided by a script, often in YAML format. Due to the reliance on these scripts, the tools are described as IaC.
The emergence of public cloud environments, such as Amazon Web Services (AWS), Azure from Microsoft, and Google Cloud Platform, has introduced tools associated with each cloud environment. The most notable of these is CloudFormation, which works with AWS.
Other vendors offer IaC tools that are more flexible, working in a variety of physical servers, private cloud, and public cloud environments. The most notable of these is Terraform by Hashicorp.
Releasing with configuration management and feature flags
Configuration management tools are responsible for identifying and setting the configuration of development and production environments. A pipeline can invoke the configuration management tool to introduce a build package that has passed the continuous integration stage.
Originally, configuration management tools specified the configuration for physical (bare metal) servers or VM images. They have grown to include Docker containers and Kubernetes clusters.
Descriptions of configurations are often specified in terms of the desired configuration state but do not elaborate on the necessary steps to achieve the desired state. This helps to achieve idempotence in the system.
Popular configuration management tools include Chef by Progress Chef, Puppet, and Ansible by Red Hat. Ansible has an advantage over both Chef and Puppet in that it connects to the environment resources through Secure Shell (SSH), which removes the need to install agent software on the resource.
Release visibility with feature flags
Even as code changes make their way into production environments, those changes may not be visible to the end users or affect existing functionality. This may be due to code switches or feature flags that prevent the visibility of the code changes. This allows for a gradual rollout of changes, such as canary deployments. This also allows for a quick reversion to the previous state by deactivating the applicable feature flags.
Popular feature flag tools include LaunchDarkly, Flagsmith, and CloudBees Feature Management.
Additional verification through advanced testing in the environment
Now that changes are built, packaged, and placed in environments, testing can work on deeper levels. Test inputs can be placed in the environment to determine whether the code works as expected, whether any vulnerabilities are introduced, and whether the system behaves as expected.
These types of tests that measure correct functionality, security, and acceptance are described as follows.
Functional and UI testing
Functional testing is most concerned with code correctness. It exists primarily to see whether the coding works and meets the base requirements. Typically, functional tests go beyond the individual code functions, which would have been tested during unit testing. Specific types of functional testing are used in the following scenarios:
- Sanity testing is running a small set of functional tests to verify code features
- Smoke testing usually involves running short, high-level functional tests to gain confidence in a new build or a new deployment
- Regression testing is a more extensive execution of functional tests to verify that new code features work with the existing system functionality
Automated tools for functional testing depend upon the language the coding features are written in, the environment the code will be deployed in, and the technology platform (web versus mobile versus other). A cross-section of popular tools includes UFT by Micro Focus, Worksoft Certify, and Tricentis Tosca.
UI testing is functional testing for graphical UIs. This ensures that elements such as buttons and fields on a web page connect to the correct underlying code functions and ensures the correctness of those code functions.
Many popular UI testing tools are based on Selenium, a platform that captures actions performed on a web page in scripts that can be repeated by automation. Such tools include TestComplete and CrossBrowserTesting by SmartBear and Sauce Labs.
Load/performance testing
Performance testing, such as load testing, is not designed to measure correct functionality. Rather, the goal of performance testing is to verify any NFRs such as reliability and scalability. We want to see how the system, including any new code changes, can handle increased demand for its resources by flooding the system with a large number of system requests, such as logins and form evaluations.
Popular tools for performance testing include LoadRunner from Micro Focus and JMeter for traditional applications and Sauce Performance from Sauce Labs for web and mobile application performance testing.
Dynamic application security testing
Dynamic application security testing (DAST) continues the emphasis on security in DevSecOps. With DAST, automated tests continue security scanning by performing simulated attacks on the environment for web applications to find vulnerabilities.
A leading DAST scanner is OWASP Zed Attack Proxy, which is used by GitLab to provide DAST scanning functionality on its pipeline.
IaC scanning
Additional tests for DevSecOps continue with the ability to scan the IaC files to discover whether there are any misconfigurations or security vulnerabilities.
Leading tools such as Snyk and GitLab can scan for multiple IaC tools, including Ansible, Terraform, Dockerfiles, and configuration services for public clouds, such as CloudFormation, Google Deployment Manager, and Azure Resource Manager (ARM).
Container scanning
Containers are a technology where an application and any needed libraries are encapsulated as a virtual image. This virtual image can be an extension of base resources that represent the functions provided by an operating system.
Docker is the technology used to implement containers. Developers define the application and libraries in Docker images. The image can be placed in a repository where it can be pulled and executed in any environment by Docker Engine.
Container scanning allows the Docker image and dependent images to be scanned to look for security vulnerabilities. Tools that can implement container scanning include GitLab and Snyk.
Acceptance tests (behavior-driven development)
Acceptance tests are test scripts written in a business-readable language called Gherkin. Each test is composed of three main clauses, each starting with a keyword:
- Given: This clause describes the initial conditions
- When: This clause describes the input for the test
- Then: This clause describes the desired behavior
Cucumber is the tool that executes Gherkin tests. Cucumber is available in an open source version and paid versions are available in CucumberStudio and Cucumber for Jira. All versions are supported by SmartBear.
Monitoring the environment
We now leave tools that are part of the pipeline to tools that are run continuously. Ongoing evaluation of staging and production environments is done by tools independent of the pipeline. These tools perform the following functions:
Performance monitoring/reporting
Stability is the key goal for operations. To that end, they will monitor the health of the environment by collecting metrics that can indicate the health of key components. This may include the following metrics:
- CPU utilization
- Memory utilization
- Storage utilization
- The number of processes
- Network statistics
- Application state
Popular tools for monitoring include Prometheus for collecting metrics and Grafana for displaying the metrics on a dashboard. If the environment is on a public cloud, CloudWatch is available on AWS, and Azure Monitor is available on Azure. Cloud-based monitoring-as-a-service (MaaS) products can consolidate monitoring from multiple environments and sources. Such products include Datadog and New Relic.
Log collection
Another aspect of monitoring comes from collecting log messages created by the system and applications. The messages may provide context for issues when problems arise in the environment.
Logs from different systems, different system components, and different applications are collected into one source using log aggregation tools. These tools include a search capability to filter by an important keyword when necessary.
Log aggregation tools can be a software application that resides on-premises or in a private cloud, a feature available on public clouds, or a SaaS product. Popular log aggregation tools include the combination of Elasticsearch, Logstash, and Kibana (an ELK stack) for collection and analytics in on-premises/private cloud environments. Log collection is part of the AWS CloudWatch service. Splunk and Datadog are popular SaaS-based products that perform log aggregation.
Alerting
When problems arise, it is important to notify the key people in a timely fashion. Alert tools can provide multiple channels for notification, including emails, SMS messages, and IM chat messages. They may also provide a tolerance mechanism to prevent too many alert messages to operations personnel and alert fatigue from occurring. These tools can also create issues for incident management so that IT service management (ITSM) processes are followed.
Leading alerting tools include PagerDuty and Opsgenie by Atlassian.
At this point, we’ve talked about the technology involved in creating the automation that is part of DevOps. Let’s focus our attention now on people, in terms of who can be responsible for installing and configuring such automation as the CI/CD pipeline.
DevOps topologies
With the growing list of tools and technologies available to Dev and Ops, it may be difficult to figure out where the responsibilities lie in moving toward a DevOps approach. Who is responsible for creating the CI/CD pipeline? What do we consider databases? How do we deploy into production?
In 2013, Matthew Skelton initially described three team anti-types to avoid and five possible team structures. Additional contributions have increased the number of anti-types to eight and the number of beneficial team structures to nine. The following list shows the anti-types and they are elaborated here at https://web.devopstopologies.com:
- Dev and Ops Silos
- Permanent DevOps Team Silo
- Dev Doesn’t Need Ops
- DevOps as the Dev Tools Team
- Rebranded Sysadmins
- Ops Embedded in Dev Team
- Dev and DBA Silos
- Fake SRE
The 9 DevOps topologies from that site are as follows.
Dev and Ops collaboration
This structure is considered the ideal DevOps approach, where Dev and Ops are working together and have smooth collaboration. Implementing this structure likely requires a large organizational culture change toward a generative culture.
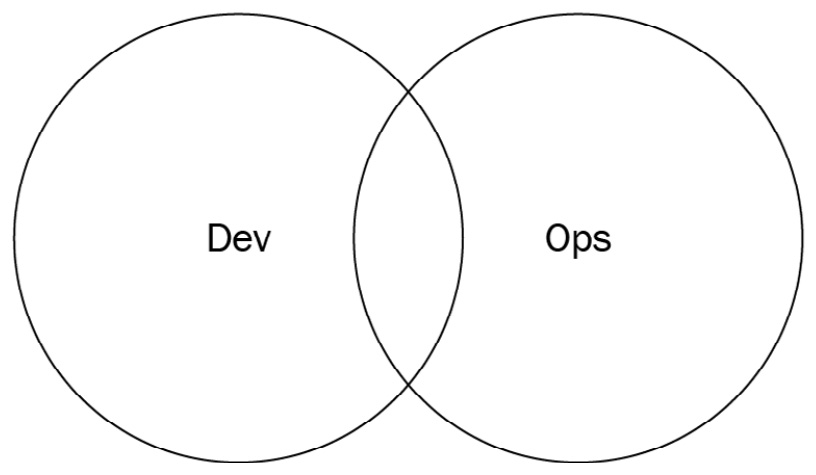
Figure 3.6 – Dev and Ops collaboration (diagram based on work at devopstopologies.com – licensed under CC BY-SA)
Fully shared Ops responsibilities
Some organizations with a single web-based product, such as Netflix or Facebook, may be able to take the Dev and Ops collaboration model shown previously and integrate Ops more fully. In this model, there is very little separation between Dev and Ops. Because of this, everyone is focused on the mission.
Figure 3.7 – Fully shared Ops responsibilities (Diagram based on work at devopstopologies.com – licensed under CC BY-SA)
Ops as infrastructure as a service
There may be some organizations that have a more traditional Ops department. Also, some organizations may deploy applications to public cloud environments such as AWS or Azure. In either case, a small subset of the Dev department may treat operations as a service and set up tooling for deployment, metrics, provisioning, and monitoring of those resources. In this model, there is no direct collaboration with Operations.
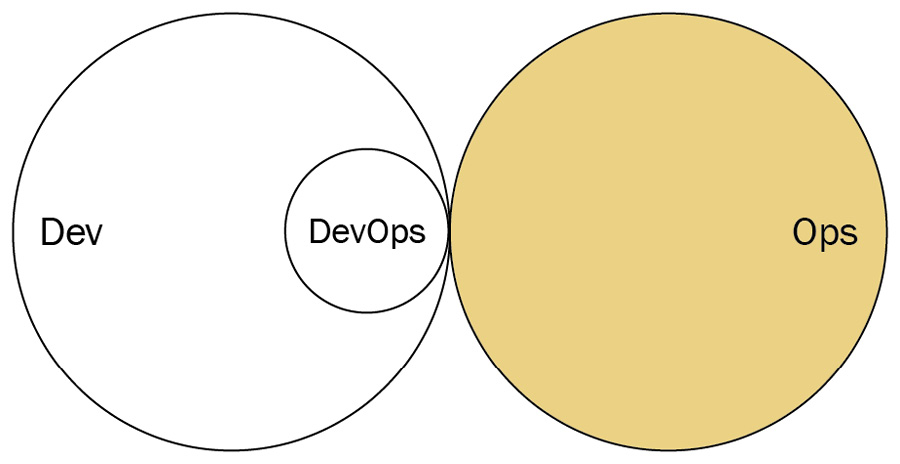
Figure 3.8 – Ops as infrastructure as a service (diagram based on work at devopstopologies.com – licensed under CC BY-SA)
DevOps as an external service
Some smaller teams and organizations may not have the manpower or experience to move toward a DevOps approach. In that case, they may contract an external vendor to create the test environments and automation and configure the monitoring. The DevOps vendors may also train Dev and Ops to move to a different model, such as Dev and Ops collaboration.
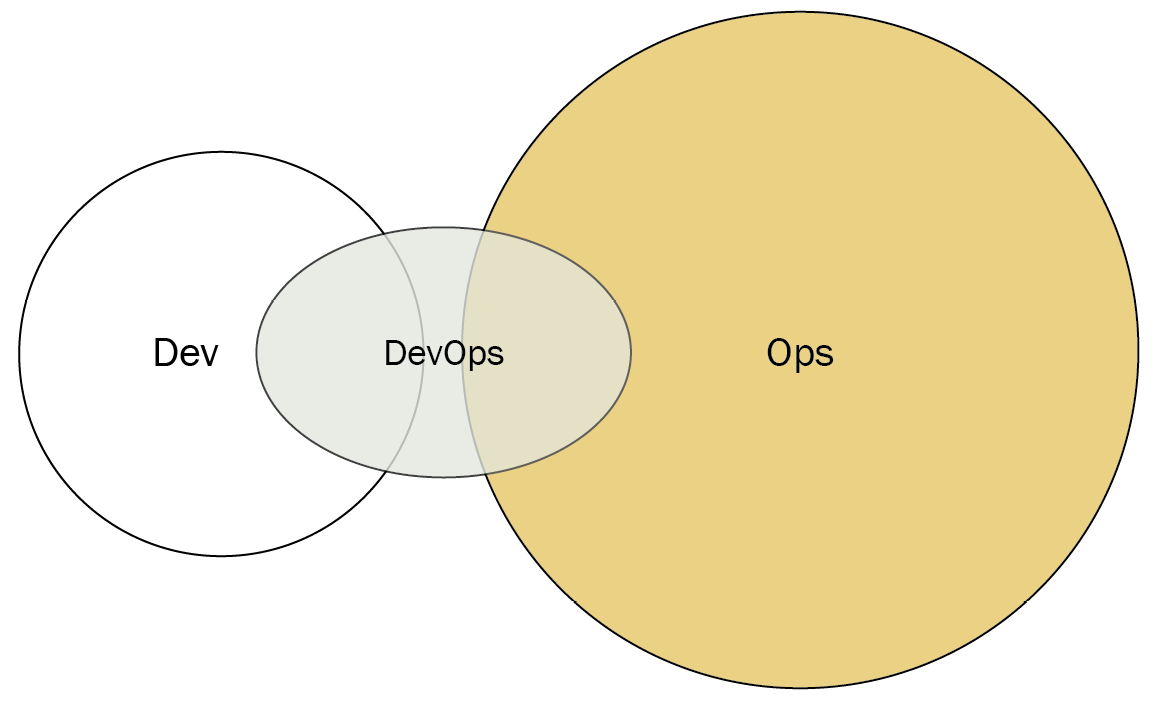
Figure 3.9 – DevOps as an external service (Diagram based on work at devopstopologies.com – licensed under CC BY-SA)
DevOps team (with expiration date)
There may be situations where having a dedicated DevOps team works. The idea is that the DevOps team can act as a bridge for both Dev and Ops teams. The DevOps team can instruct developers on working with infrastructure and can instruct operations personnel on Agile development. At some point, the DevOps team will disband, allowing Dev and Ops to collaborate in the Dev and Ops collaboration model.
The danger exists when the DevOps team does not disband, instead forming a separate silo. This is actually one of the identified anti-types (DevOps Team Silo) mentioned on the DevOps topologies website.
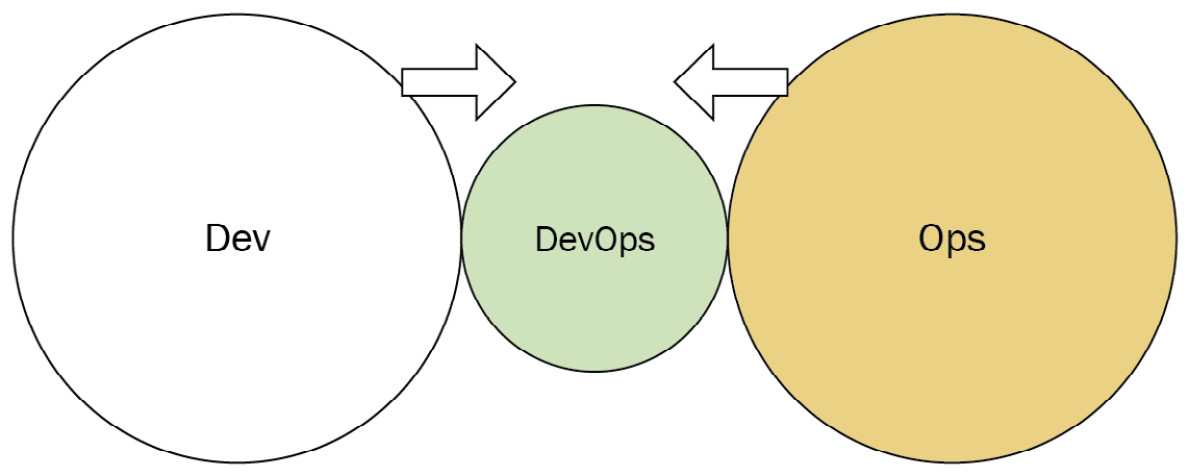
Figure 3.10 – DevOps team with expiration date (diagram based on work at devopstopologies.com – licensed under CC BY-SA)
DevOps advocacy team
A DevOps advocacy team acts as a facilitator between Dev and Ops if the two departments tend to drift apart. Unlike the DevOps team with an expiration date, this DevOps team is kept on an ongoing basis, ensuring both Dev and Ops follow current DevOps practices.
Like the DevOps team with an expiration date, a DevOps advocacy team runs the risk of turning into a DevOps Team Silo.
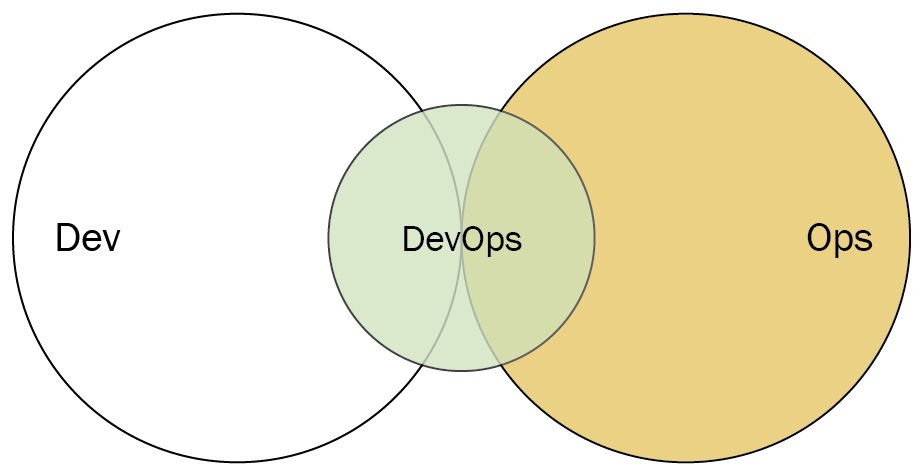
Figure 3.11 – DevOps advocacy team (Diagram based on work at devopstopologies.com – licensed under CC BY-SA)
SRE team
As far back as 2004, Google has used its software engineers as operations personnel. These site reliability engineers (SREs) handle the support of production environments, mostly by developing software to keep the resources and services running. SREs accept the application from Dev, but only if Dev provides enough evidence in the form of logs and metrics that it meets a quality threshold. If the code does not meet this standard, SREs can reject the deployment.
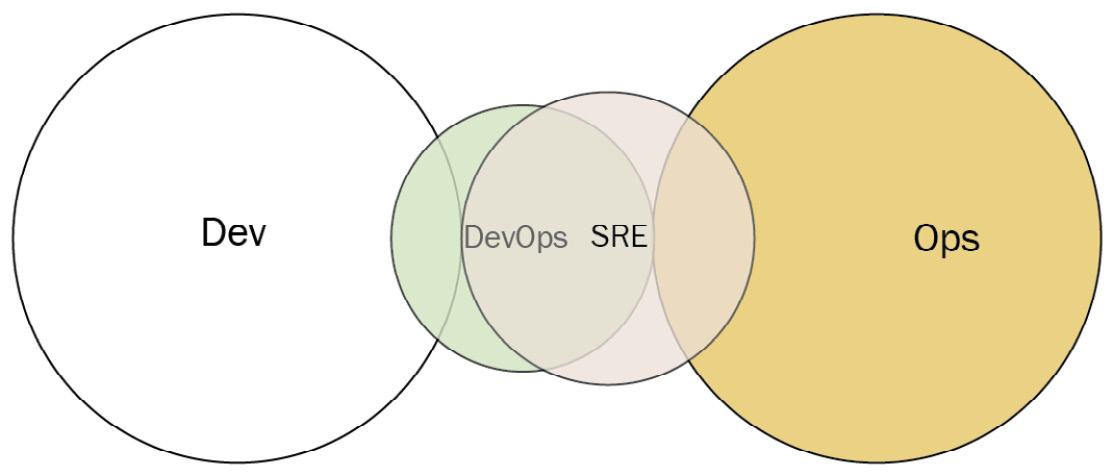
Figure 3.12– SRE team (diagram based on work at devopstopologies.com – licensed under CC BY-SA)
Container-driven collaboration
Because containers abstract many of the infrastructure details, most collaboration between Dev and Ops is not necessary. In this case, a container-based deployment may be accepted by Ops most of the time if there is a sound engineering culture. If not monitored closely, there is a risk of changing to an anti-type where Ops is expected to deploy anything from Dev without question.
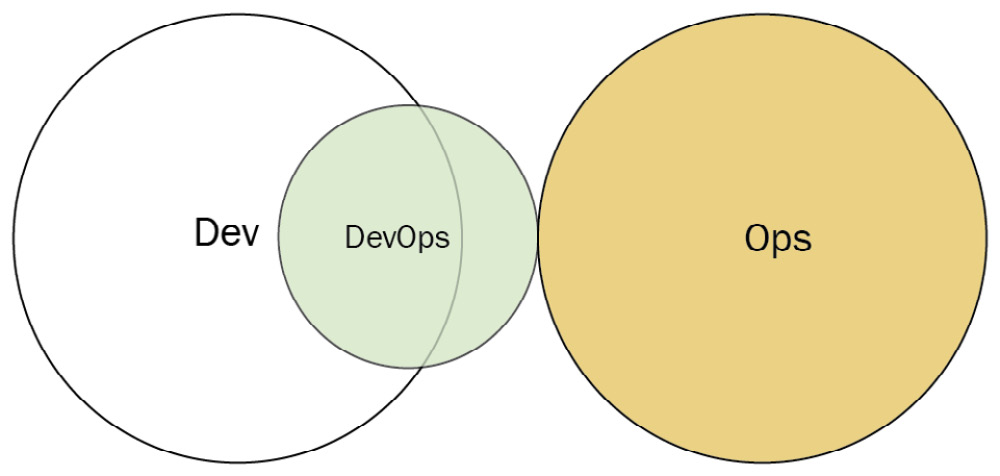
Figure 3.13 – Container-driven collaboration (diagram based on work at devopstopologies.com – licensed under CC BY-SA)
Dev and DBA collaboration
If the applications an organization develops rely on one or more central databases, the collaboration between developers and the database administrators (DBAs) may be crucial. To enable that collaboration, the database developers in Dev work closely with the DBAs in operations.
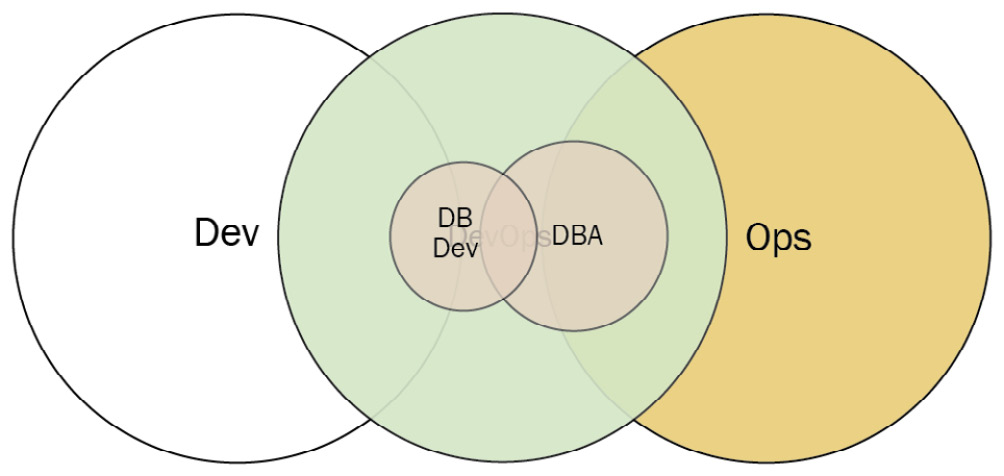
Figure 3.14 – Dev and DBA collaboration (Diagram based on work at devopstopologies.com – licensed under CC BY-SA)
Now that we have seen possible configurations for organizing the team responsible for the CI/CD pipeline, let’s take a close look at such a team on the ART: the system team.
The system team
The system team is the team on the ART that is responsible for the tooling and automation of the Continuous Delivery Pipeline. They work with the other teams on the ART to help in delivering valuable solutions.
The system team may follow one of several DevOps topologies. The system team may be set up as a DevOps team with an expiration date. They will set up the Continuous Delivery Pipeline and instruct the Dev and Ops personnel on its use before disbanding. Another model for the system team may be being set up as a DevOps advocacy team.
As custodians of the automation and development process, they have deep responsibilities to the other teams on the ART. These responsibilities are described as follows.
Building infrastructure for solution development
The system team will often be responsible for setting up the pre-build, continuous integration, and continuous deployment portions of the CI/CD pipeline and integrating the technology so it’s a seamless part of the Continuous Delivery Pipeline. They strive to apply automation as much as possible. This may also involve close collaboration with other teams, so they may visit other teams’ events.
Spearheading solution integration
As part of maintaining the CI phase, the system team may be involved in determining the build process after a change has been committed to version control. They will maintain the proper build scripts and CI configuration files. If build automation is not yet available, they may be the team performing build and integration activities.
Setting up end-to-end testing
To support the other teams, the system team may help the testers with the creation and optimization of automated tests. They may also work with the other teams to aggregate separate tests into well-defined test suites for different types of testing, such as smoke testing.
Assisting with demos
The ART integrates the work from all its teams and demonstrates the working state of the solution at a given point in time. This integration and demonstration is called the system demo and happens at a regular cadence.
As maintainers of the Continuous Delivery Pipeline, the system team is there to ensure that technical environments work for all teams so that the system demo is seamless.
Facilitating the release
Because the system team has a holistic view of the process, they may be called upon to verify that deployments to production and final release are valid.
The system team can be considered the DevOps team for the ART. It may follow one of the DevOps topologies as a way of collaborating with the other Agile teams. Its responsibilities primarily involve configuring the automation, but it may assist the Agile teams in other ways as the entire ART endeavors to deliver value.
Summary
Automation plays a key role in DevOps. We looked at the important tools that make up a DevOps toolchain, especially those parts of the toolchain that are orchestrated from building and testing to deployment, creating the CI/CD pipeline or the pipeline.
CI typically includes activities that happen to code changes after they have been committed to version control. This may include preliminary testing, and upon passing, they may be built together and packaged into an artifact based on language and technology.
CD continues from where CI leaves off by taking the build artifacts and applying them to testing or production environments. Here, environments will be reconfigured, possibly with new resources. Additional testing will be performed to ensure security, correctness, and validation of anticipated value.
DevOps topologies outline possible models of collaboration between Dev and Ops teams with the possible inclusion of people specializing in DevOps. Some of the topologies are not long-lasting, lest they turn into anti-types that stifle collaboration.
In SAFe, the system team performs as the DevOps team on the ART. That team is responsible for constructing and maintaining the Continuous Delivery Pipeline for the other teams on the ART.
Automation does allow the ART or any DevOps team to deliver faster, but not if the development process is not optimized for Lean flow. In the next chapter, we will examine the practices from the Lean thinking movement that enable flow.
Questions
Test your knowledge of the concepts in this chapter by answering these questions.
- What tests are examples of static analysis (pick two)?
- Unit tests
- Linting
- DAST
- Dependency scanning
- Acceptance tests
- What allows code changes to be hidden in production until turned on?
- Version control
- Continuous integration
- Feature flags
- Continuous deployment
- Monitoring includes activities such as performance monitoring, alerting, and what?
- Load testing
- Version control
- Log collection
- Unit testing
Further reading
- The original formulation of DevOps topologies, including three anti-types and five types: https://blog.matthewskelton.net/2013/10/22/what-team-structure-is-right-for-devops-to-flourish/
- The updated formulation of DevOps topologies: https://web.devopstopologies.com
- Team Topologies: Organizing Business and Technology Teams for Fast Flow by Matthew Skelton and Manuel Pais – the evolution of DevOps topologies to look at topologies for all kinds of teams.