
13
Section Creation and Analysis
Up to this point, we’ve essentially been chipping away at progressing our Residential Subdivision design, all while learning many of the design and analysis tools available to us within Civil 3D. We’ve taken an existing site composed of two existing lots and have subdivided it into smaller building parcels, graded lots and building pads, two roads, and several utilities to service future development. From a design standpoint, we are just about complete. From an analysis standpoint, we’ll take a look at one more set of tools, Sectioning tools, available to us within Civil 3D that will allow us to further analyze our design.
Also, up to this point, we’ve mostly been working in plan view with the occasional need to view our modeled objects in our Object Viewer. As we utilize the Sectioning tools, we’ll be able to view our modeled objects through a slightly different lens where we’ll truly be able to visualize how our design will look under our top-graded surface. That said, in this chapter, we’ll review Section View creation, display, and management methods within Civil 3D within the following topics:
- Creating sample lines along alignments
- Creating Section Views to display modeled objects
- Creating intelligent section sheets for plan production
With that, let’s go ahead and open up our Utility Model.dwg file located within our Practical Autodesk Civil 3D 2023Chapter 13Model directory. Once it’s open, you’ll notice that we’ll be starting this chapter pretty much where we left off in Chapter 12, Utility Modeling Tool Belt for Everyday Use, with the display of our model looking similar to that shown in Figure 13.1:
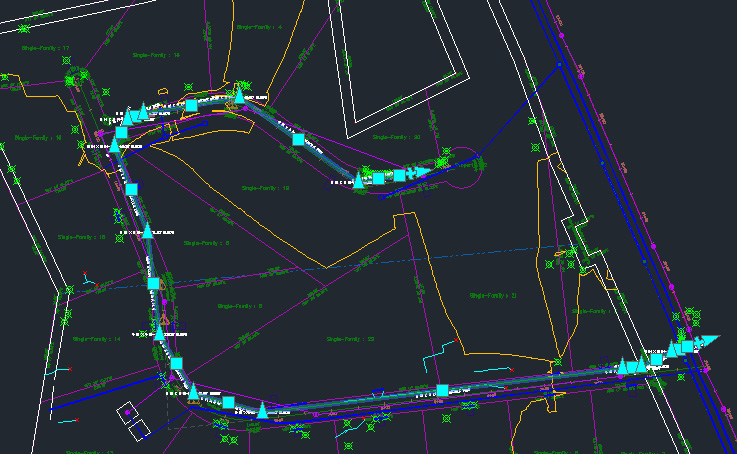
Figure 13.1 – Final appearance of our Residential Subdivision after Chapter 10
Technical requirements
The exercise files for this chapter are available at https://packt.link/UoiPn
Creating sample lines along alignments
With our Utility Model.dwg file currently open, let’s begin familiarizing ourselves with the Cross Section tools available to us within Civil 3D. When we think about Cross Sections, we quite often think about roadway sections as these are where they are most often displayed within a construction drawing plan set. Since we currently have surfaces, corridors, and utilities designed, all of which are currently available within our Utility Model.dwg file, we’ll want to set ourselves up to include all of these objects in the sampling of the Cross Section sample lines we create; this will become a little clearer in a little bit.
For us to get to the point where we can create Cross Sections, we’ll first need to create sample lines along our alignments. These sample lines will be placed so that they are perpendicular to our alignments at specified stations and/or intervals and will be used as a reference for linking our Section Views later on in this chapter.
To create sample lines, we’ll go up to our Home ribbon and select our Sample Lines tool in the Profile area and Section Views panel. Once activated, we’ll be prompted at our command line to select an alignment. Let’s go ahead and select our ALG – Subdivision Main Road – Access alignment, at which point the Create Sample Line Group dialog box will appear, where we’ll fill out the fields and make the following selections (also displayed in Figure 13.2) and then click the OK button:
- Name: SLG – Subdivision Main Road – Access
- Description: Subdivision access road from York Hwy
- Sample Line Style: Road Sample Line
- Sample Line Label Style: Section Station
- Select Data Sources to Sample: Check the Sample box next to all the items listed to include all the available ones within our Section Views:
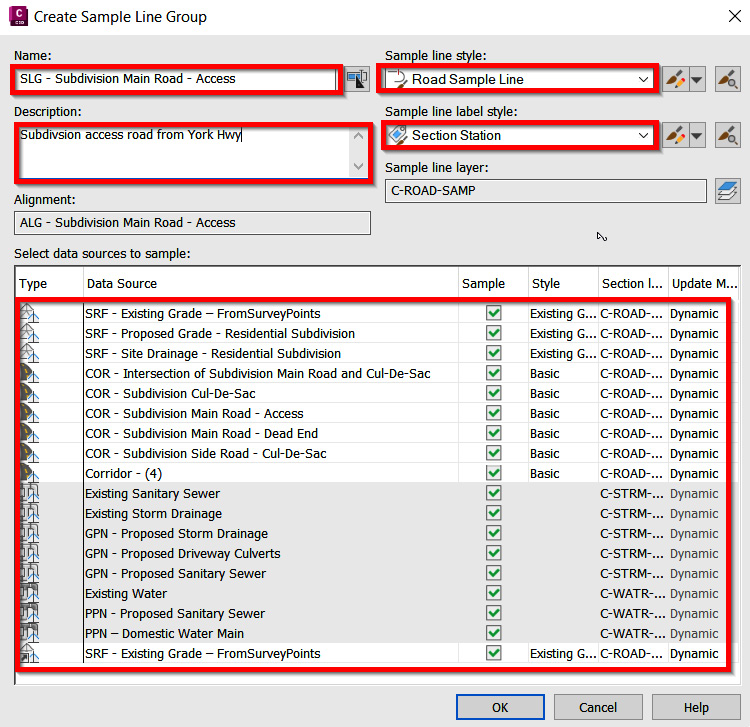
Figure 13.2 – The Create Sample Line Group dialog box
After selecting the OK button within the Create Sample Line Group dialog box, we’ll gain access to our Sample Line Tools toolbar. Running from left to right, we have the following tools available to us (also shown in Figure 13.3):
- Manually Enter a Name for Sample Line: Allows us to manually enter sample line names as we create them
- Edit Name Template: Allows us to automate the naming convention of sample lines as they’re created
- Alignment Picker: Allows us to change alignments by selection as required
- Current Sample Line Group: Lists the current sample line group that we are creating sample lines for
- Sample Group Tools: Allows us to create a new sample line group, edit Group Defaults, delete our Current Group, select Group from Drawing, edit Swath Widths for Group, and sample more sources
- Sample Line Creation Methods: Allows us to create sample lines using the following methods: By Range of Stations, At a Station, From Corridor Stations, Pick Points on Screen, and Select Existing Polylines
- Select/Edit Sample Line: Allows us to select individual entities
- Sample Line Entity View: Changes the view of sample lines to display them in a table format
- Undo: Allows us to undo the previous sample line that was created
- Redo: Allows us to redo the sample line’s creation:
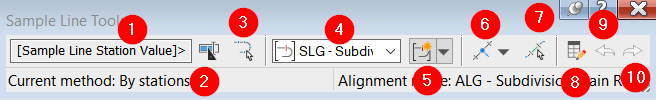
Figure 13.3 – The Sample Line Tools toolbar
With that, let’s go ahead and select the Sample Line Creation Methods drop-down arrow and select the By Station Range option. Once selected, the Create Sample Lines – By Station Range dialog box will appear, where we’ll make selections as required for the project. I’ve provided an example of how I would typically approach the sample line creation process if Cross Sections are not required for the project (refer to Figure 13.4):
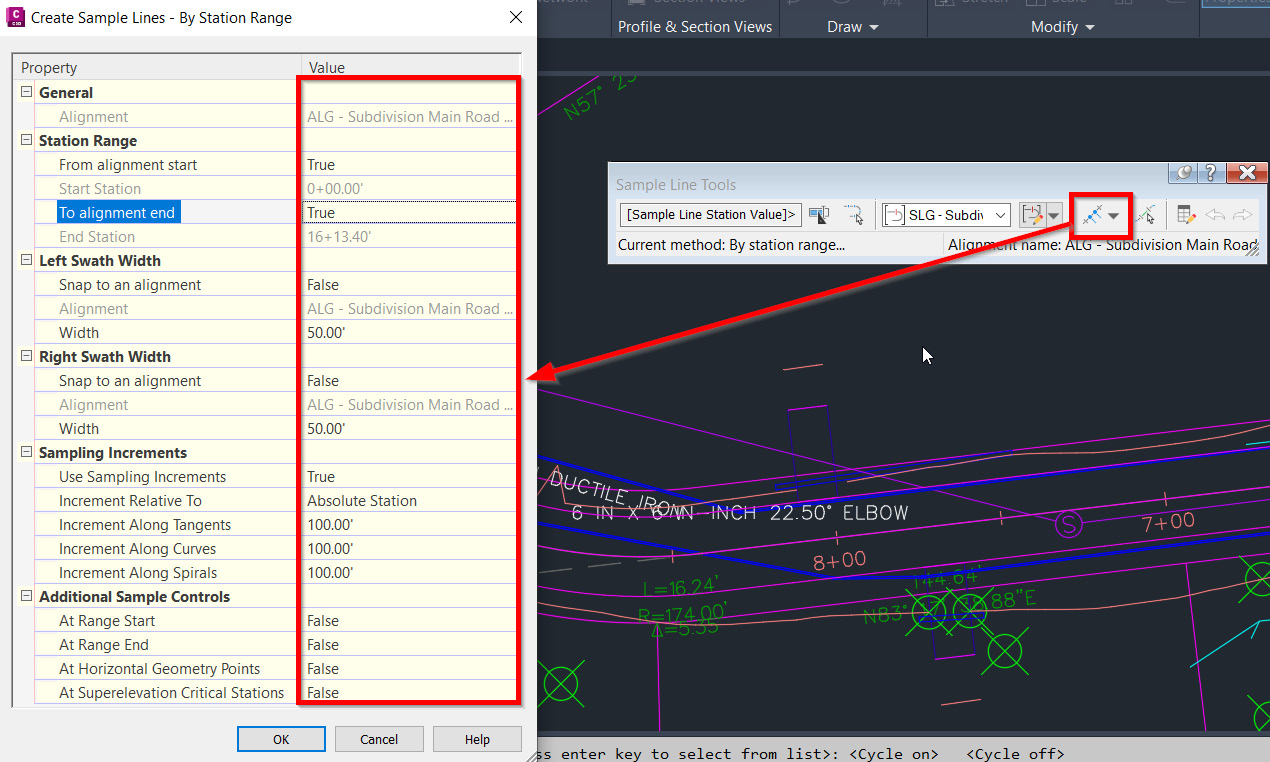
Figure 13.4 – The Create Sample Lines – By Station Range dialog box
Once all the fields have been filled out accordingly, click the OK button at the bottom of our Create Sample Lines – By Station Range dialog box and watch Civil 3D automatically generate our sample lines per the defined criteria. In our example, we should now be seeing sample lines created along our ALG – Subdivision Main Road – Access alignment at 100’ intervals, as shown in Figure 13.5:
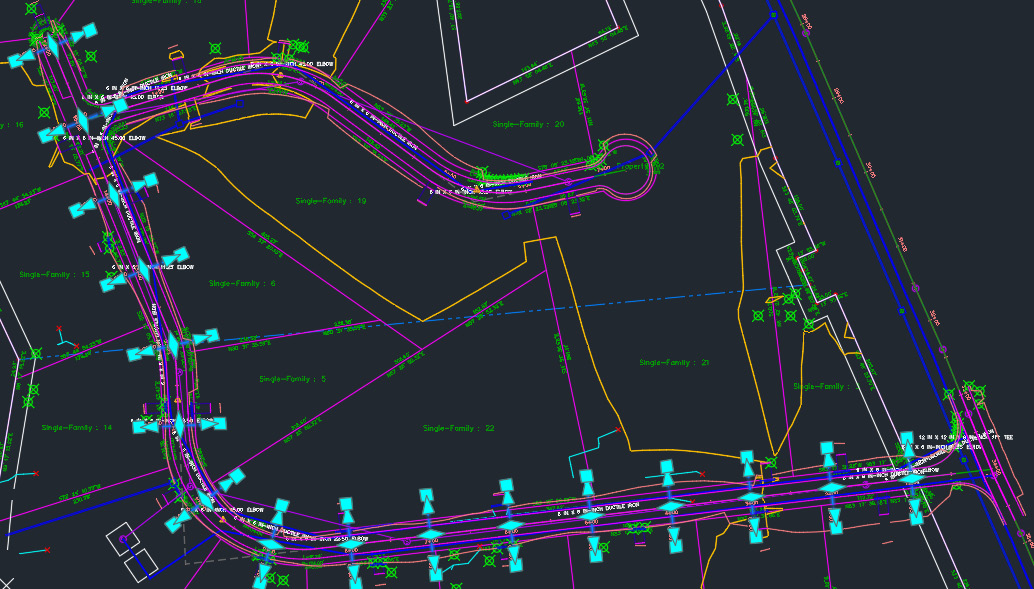
Figure 13.5 – Sample lines created for the SALG – Subdivision Main Road – Access sample line group
With our sample lines and SLG – Subdivision Main Road – Access sample line group created for our ALG – Subdivision Main Road – Access alignment, let’s run through the same workflow for our ALG – Subdivision Side Road – Cul-De-Sac alignment.
Jumping back up to our Home ribbon, we’ll select the Sample Line tool in the Profile and Section Views panel again. In the Create Sample Line Group dialog box that appears, we’ll fill out the fields make the following selections, and then click the OK button:
- Name: SLG – Subdivision Side Road - Cul-De-Sac
- Description: Cul-De-Sac side road connecting to Subdivision Main Road Alignment
- Sample Line Style: Road Sample Line
- Sample Line Label Style: Section Station
- Select Data Sources to Sample: Check the Sample box next to all items listed to include all available within our Section Views
Then, with the Sample Line Tools toolbar appearing again, we’ll apply the same sample line creation criteria using the Create Sample Lines – By Station Range method again, with the final result looking similar to that shown in Figure 13.6:
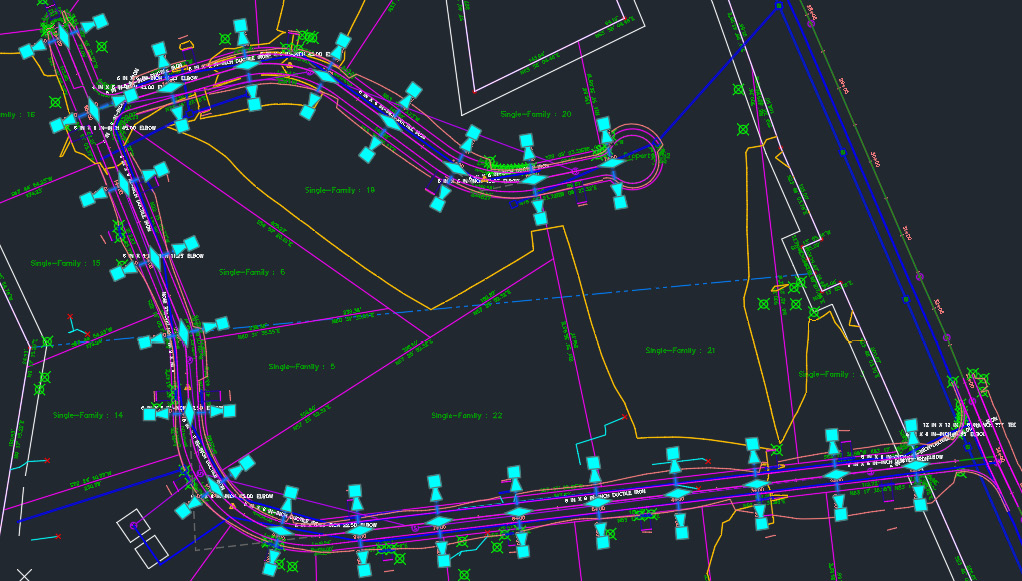
Figure 13.6 – Sample lines created for SLG – Subdivision Side Road – Cul-De-Sac sample line group
Now, with all sample lines, sample line groups, and necessary data sources being sampled, we can go ahead and create data shortcuts for our sample line groups so that we can create our sections in a reference file. We’ll want to create these inside a reference file, instead of a model file, so that we can externally reference just the Section Views themselves into our final sheet files when it comes to plan production.
That said, let’s pull up our toolspace and activate our Prospector tab. Once activated, we’ll scroll down to the area where we have our Data Shortcuts project listed Right-click the Data Shortcuts project name and select Create Data Shortcuts. When the Create Data Shortcuts dialog box appears, check the boxes next to our newly created sample line groups, SLG – Subdivision Main Road – Access and SLG – Subdivision Side Road – Cul-De-Sac, and then click OK (refer to Figure 13.7):
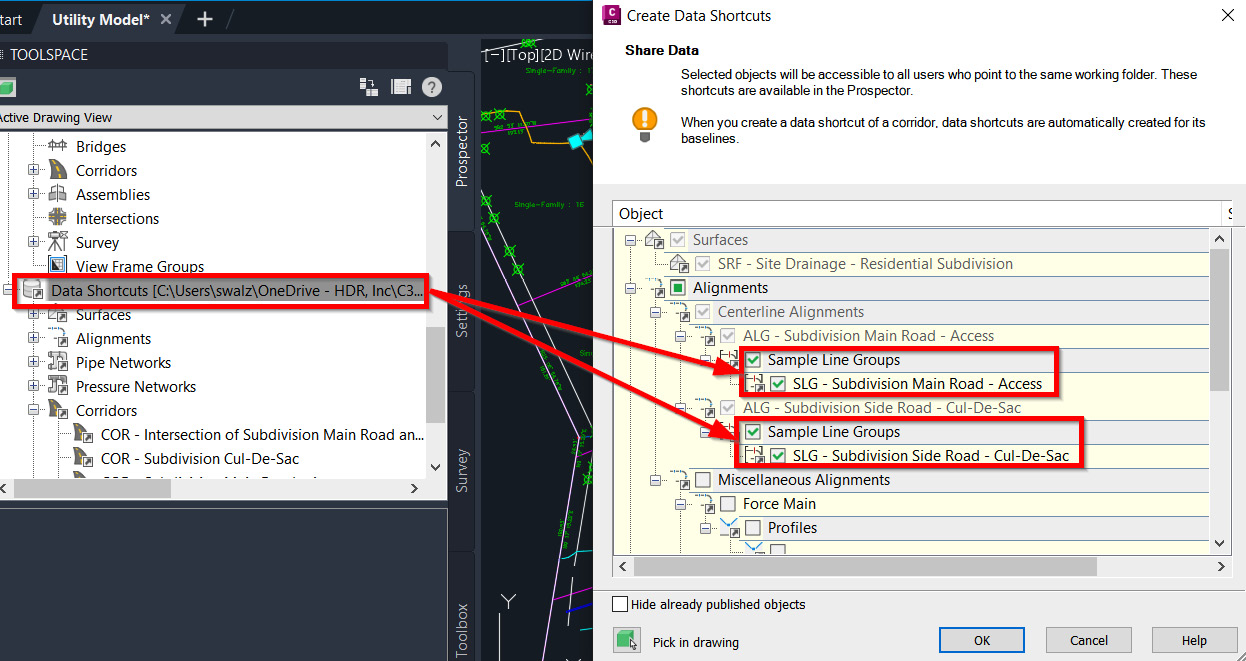
Figure 13.7 – Create Data Shortcuts of Sample Line Groups
Over the next couple of sections, we’ll begin to explore how we can carry this information into other files for display and analysis purposes, with the ultimate purpose of preparing our section reference file for eventual incorporation into our construction drawing plan set.
Creating Section Views to display modeled objects
With that, let’s go ahead and open up Civil 3D, or go to your start screen if it’s already open, and create a new drawing using similar steps outlined in Chapter 7, Alignments – The Second Foundational Component to Designs within Civil 3D. We can use our Company Template File.dwt file located in Practical Autodesk Civil 3D 2023Chapter 13 and select Open in the lower right-hand corner of the Select Template dialog box. Once our new file has been created, we’ll want to save it as Section Reference.dwg in our Practical Autodesk Civil 3D 2023Chapter 13Model directory.
As discussed back in Chapter 3, Sharing Data within Civil 3D, reference files are intended to contain/represent 2D geometry and static elements and annotation. Reference files would include content such as surveyed planimetrics, civil site plan geometry, erosion control BMPs, and so on.
Although sections are considered to be Civil 3D objects, only certain elements of sections can be data referenced. In the case of sections, sample lines and sample line groups can be data referenced, but Section Views cannot be, as those are configured in individual files as needed while maintaining a live link to the sample line groups they derive from.
With our Section Reference.dwg file created, let’s go ahead and jump back into our Prospector tab in our toolspace, and then set the Working Folder area of our Data Shortcuts project to Practical Autodesk Civil 3D 2023Chapter 13 location and select the C3D_2023_123456_Data_Shortcuts project, as shown in Figure 13.8:
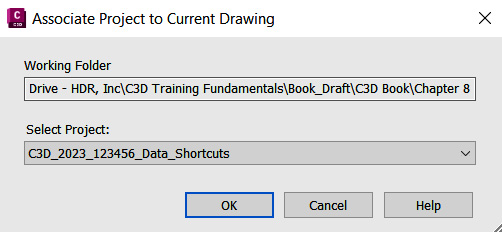
Figure 13.08 – Associate Project to Current Drawing
After our Civil 3D data shortcuts project has been associated with our current file, we can then safely create data references of our SLG – Subdivision Main Road – Access and SLG – Subdivision Side Road – Cul-De-Sac sample line groups in our Section Reference.dwg file.
To do this, we need to expand our Alignments category, our Proposed Conditions subfolder, then each of our alignments, and finally each of the Sample Line Groups categories (refer to Figure 13.9), right-click on each of our sample line groups created earlier, and select the Create… option:
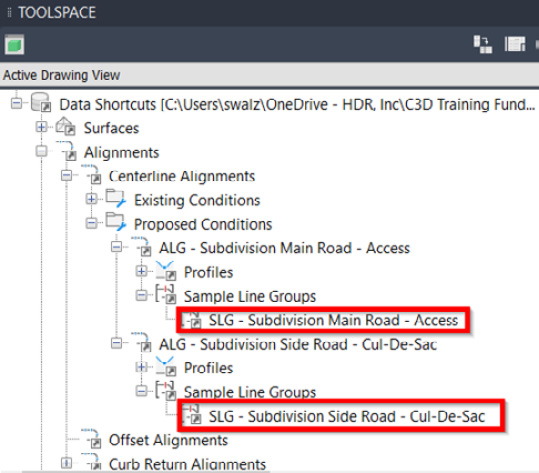
Figure 13.9 – Sample line group data shortcuts
Once created, our Create Sample Line Group Reference dialog box will appear. Here, we’ll want to jump down to our Select Data Sources to Sample section toward the bottom of our dialog box and make sure we have all sources checked, as shown in Figure 13.10:
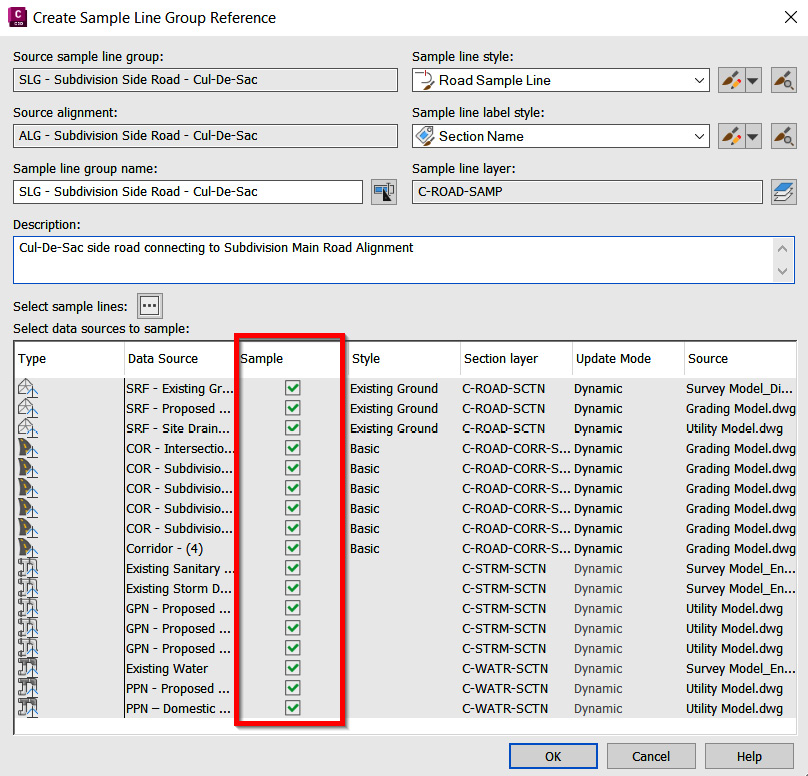
Figure 13.10 – The Create Sample Line Group Reference dialog box
After selecting all data sources, click the OK button – Civil 3D will go ahead and import all sample lines and data sources associated with each sample line group. During this importing process, you’ll notice that Civil 3D is automatically creating, importing, and linking all data references listed in the Data Sources section of our Create Sample Line Group Reference dialog box, not just the sample lines and sample line groups.
Note
When we go to select the Create Reference… option for the second sample line group, Civil 3D will recognize that those data reference objects are already in the file, so it will not duplicate the insertion of those objects, but rather confirm and insert any that are missing from our current file and link accordingly.
After both sample line groups have been data referenced into our Section Reference.dwg file, along with all data sources being sampled, our Model Space should have all reference objects visible, with the output looking similar to what’s displayed in Figure 13.11:
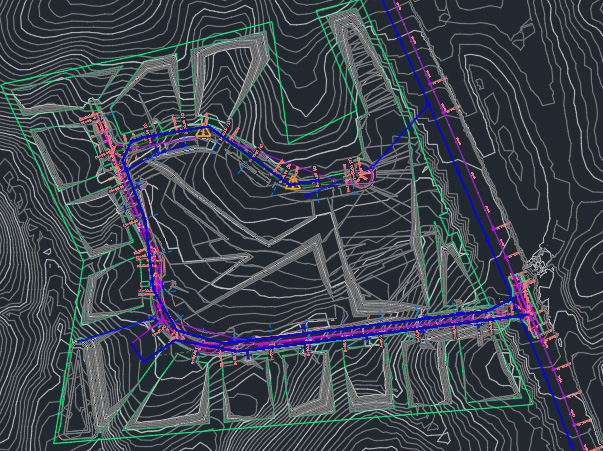
Figure 13.11 – All data sources referenced in our Section Reference.dwg file
Moving on to creating Section Views, let’s go back up to our Profile and Section Views panel in our Home ribbon and select the down arrow next to Section Views (refer to Figure 13.12). As shown in Figure 13.12, we can quickly see that we have a few different tools available to us related to our Section Views. These tools and their descriptions are as follows:
- Create Multiple Views: Allows us to generate and display multiple Section Views within a specified sample line group at one time
- Create Section View: Allows us to generate and display a singular Section View within a specified sample line group
- Project Objects to Multiple Section Views: Allows us to project objects (AutoCAD Points, Solids, Polylines, and/or Blocks) from the plan view into multiple Section Views
- Project Objects to Section View: Allows us to project objects (AutoCAD Points, Solids, Polylines, and/or Blocks) from the plan view into a singular Section View:
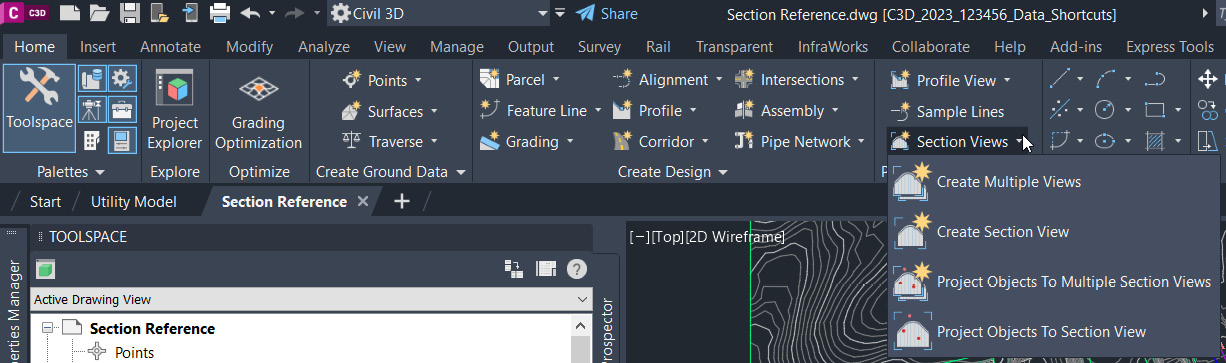
Figure 13.12 – Section Views tools
To give us an idea of the value Section Views can provide, we’ll start by using the Create Section View option, which will allow us to generate and display a singular Section View within a specified sample line group.
After selecting Create Section View, our Create Section View dialog box will appear with the General tab activated. Using the following steps in the General tab, we’ll fill out the fields and make selections (also displayed in Figure 13.13):
- Select Alignment: ALG – Subdivision Main Road – Access
- Sample Line Group Name: SLG – Subdivision Main Road – Access
- Sample Line: 7+00.00
- Section View Name: SCV – Subdivision Main Road – Access
- Description: Section Views along Subdivision Main Road
- Section View Style: Road Section
- Click the Next button:
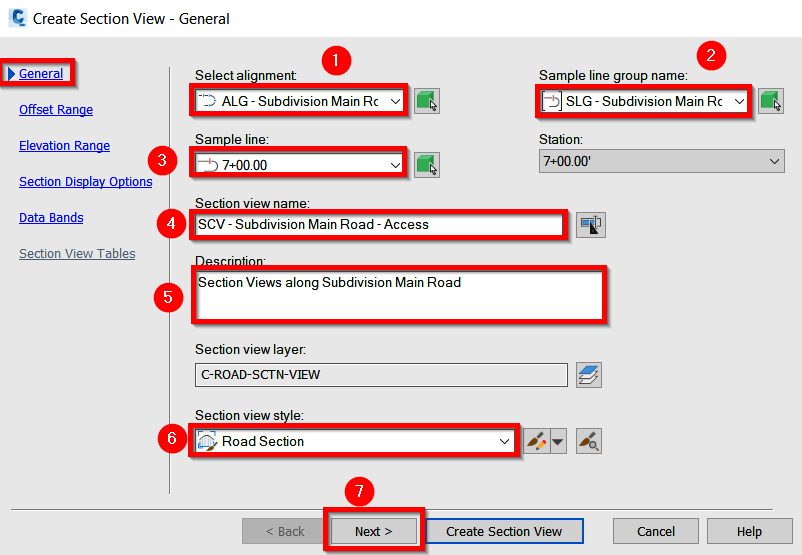
Figure 13.13 – The Create Section View – General tab
In our Offset Range tab, we’ll use the following steps to fill out the fields and make selections (also displayed in Figure 13.14):
- Offset Range: Automatic (you’ll notice that the Left and Right values are grayed out. The default values listed are representative of the length of the offset we had associated with our sample lines in the first section.)
- Click the Next button:
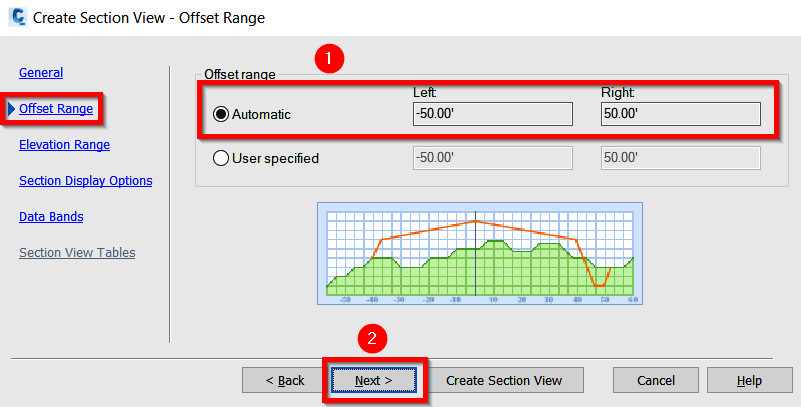
Figure 13.14 – The Create Section View – Offset Range tab
In the Elevation Range tab, we’ll use the following steps to fill out the fields and make selections (also displayed in Figure 13.15):
- Offset Range: Automatic (you’ll notice that the Minimum and Maximum values are grayed out. The default values listed are representative of the elevation range that will appropriately display our objects within the Section View we’re creating.)
- Click the Next button:
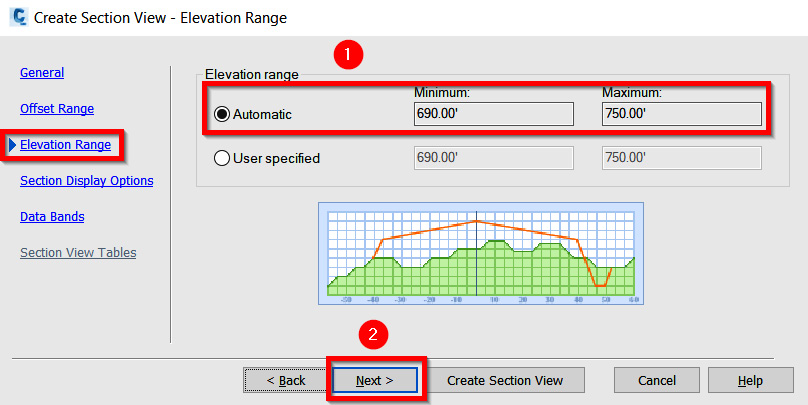
Figure 13.15 – The Create Section View – Elevation Range tab
In the Section Display Options tab, we’ll use the following steps to fill out the fields and make selections (also displayed in Figure 13.16):
- Change the Style associated with our SRF – Proposed Grade – Residential Subdivision Surface Model from Existing Grade to Finished Grade.
- Uncheck the Draw box associated with our SRF – Site Drainage – Residential Subdivision Surface Model (you’ll recall that we created this temporary Surface Model in Chapter 12, Utility Modeling Tool Belt for Everyday Use, for our Stormwater Analysis).
- Click the Next button:
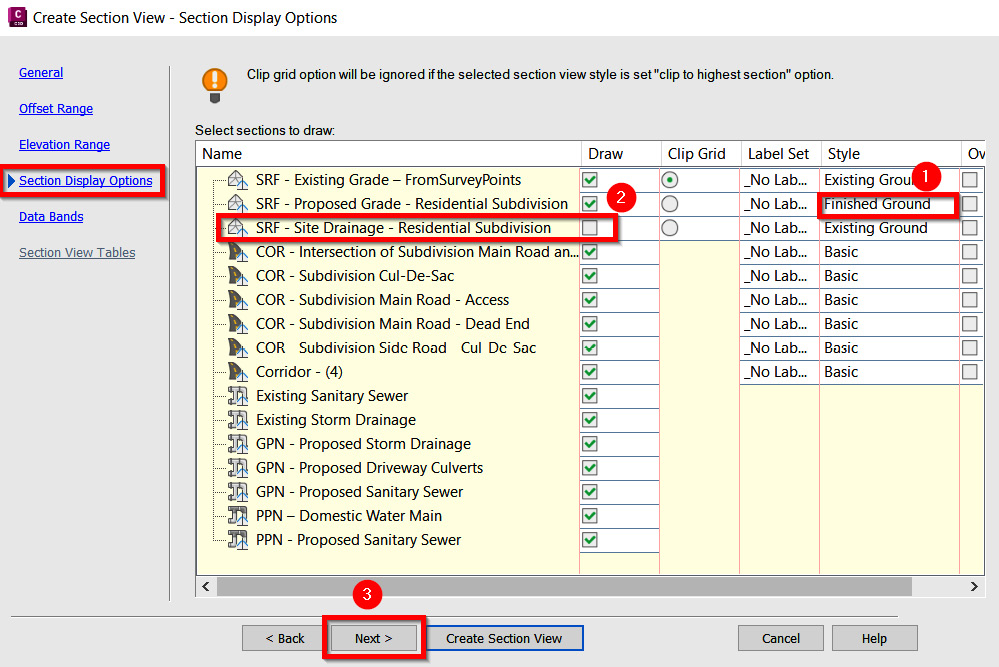
Figure 13.16 – The Create Section View – Section Display Options tab
In the Data Bands tab, we’ll use the following steps to fill out the fields and make selections (also displayed in Figure 13.17):
- Select Band Set: Offsets Only
- Location: Bottom of Section View
- Click the Create Section View button:
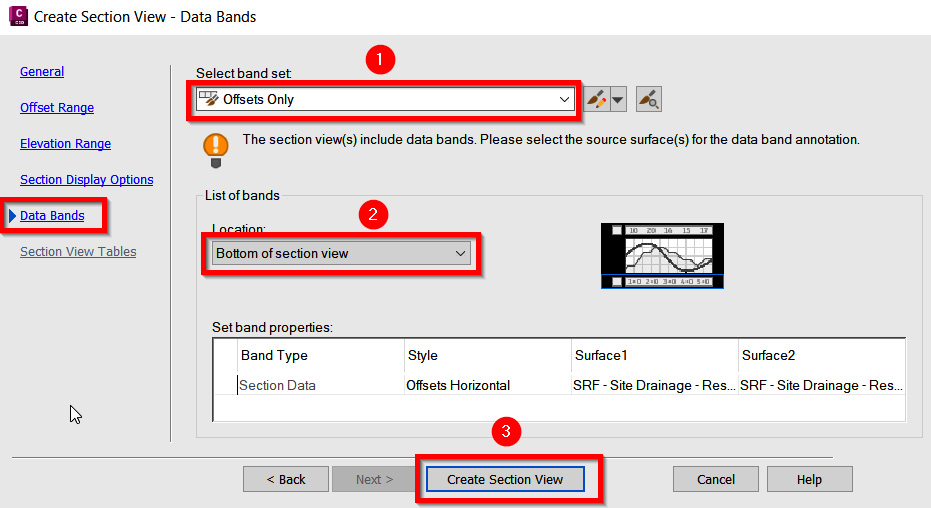
Figure 13.17 – The Create Section View – Data Bands tab
After clicking the Create Section View button, the Create Section View dialog box will disappear, and we’ll be prompted at the command line to identify Section View Origin. To identify this Section View Origin, we’ll click in an open area within our Model Space to manually place our individual Section View.
Now, if we go ahead and select the outer dashed boundary line of our newly created Section View, we’ll notice that a few different grips appear on the screen (refer to Figure 13.18):
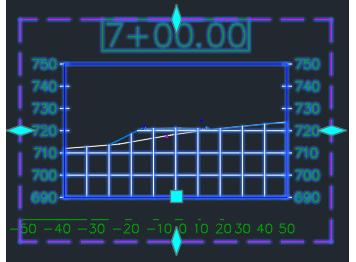
Figure 13.18 – Section View at station 7+00.00
The grips on the top, bottom, left, and right sides of the boundary line allow us to stretch our Drafting Buffer Outline. This Drafting Buffer Outline does not provide much value when generating singular Section Views but can have an effect when we create multiple Section Views for plan production purposes.
The boxed grip at the bottom of our Section Grid represents the actual insertion point of our Section View. If we click on this grip, we can move/relocate the Section View anywhere else that we’d like, still while maintaining that dynamic link to the data sources that are being displayed.
Now that we’ve been able to get an idea of what the singular Section View generation workflow looks like, let’s move on to creating multiple Section Views that we will be able to incorporate into our plan production set and further analyze all of our modeled objects within our Residential Subdivision design.
Creating intelligent section sheets for plan production
Creating multiple Section Views has a few different benefits and advantages, with the biggest one being that we can easily configure our Section Views so that they are already prepared for construction drawing sheeting. A few more additional benefits are as follows:
- Dynamic linking to sample lines and sample line groups
- Adjustable sheet drafting buffer outlines that will dynamically update all remaining Section Views
- Quickly analyze all modeled objects in all Section Views
With that, let’s go up to our Profile and Section Views panel in our Home ribbon and select the Create Multiple Views tool. Once selected, the Create Multiple Section Views dialog box will appear. Right off the bat, you’ll notice that we have quite a few more options and selections to make than what was available in the previous exercise when we were creating just a singular Section View.
Starting with our General tab activated within the Create Multiple Section Views dialog box, we’ll fill out the fields and make selections as follows (also displayed in Figure 13.19) and click the Next button:
- Select Alignment: ALG – Subdivision Main Road – Access
- Sample Line Group Name: SLG – Subdivision Main Road – Access
- Station Range: Automatic
- Section View Name: SCV – Subdivision Main Road – Access
- Description: Section Views along Subdivision Main Road
- Section View Style: Road Section:
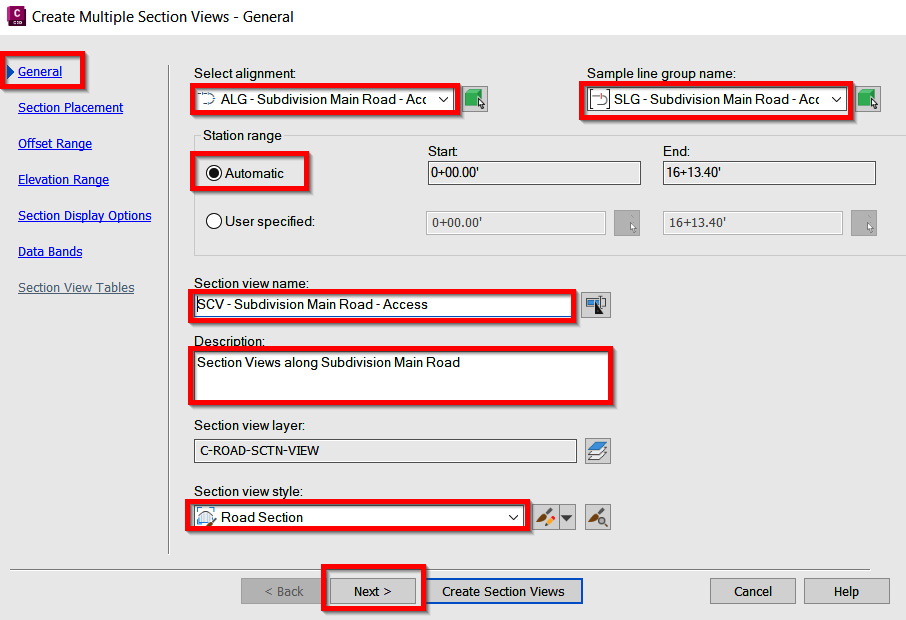
Figure 13.19 – The Create Multiple Section View – General tab
Next, in the Section Placement tab, we’ll use the following steps to fill out the fields and make selections (also displayed in Figure 13.20) and then click the Next button:
- Select the Production – Use a layout from a template file .dwt to place sections on sheets option.
- Click on the ellipsis button to specify a template and layout to create new section sheets.
- In the Select Layout as Sheet Template dialog box, click on the ellipsis button to specify a template and layout to create new section sheets.
- Select the corresponding sheet layout that we wish to use for plan production purposes. In our case, we’ll opt for ANSI D Section 40 Scale.
- Click on the OK button in the Select Layout as Sheet Template dialog box.
- Select Basic for Group Plot Style:
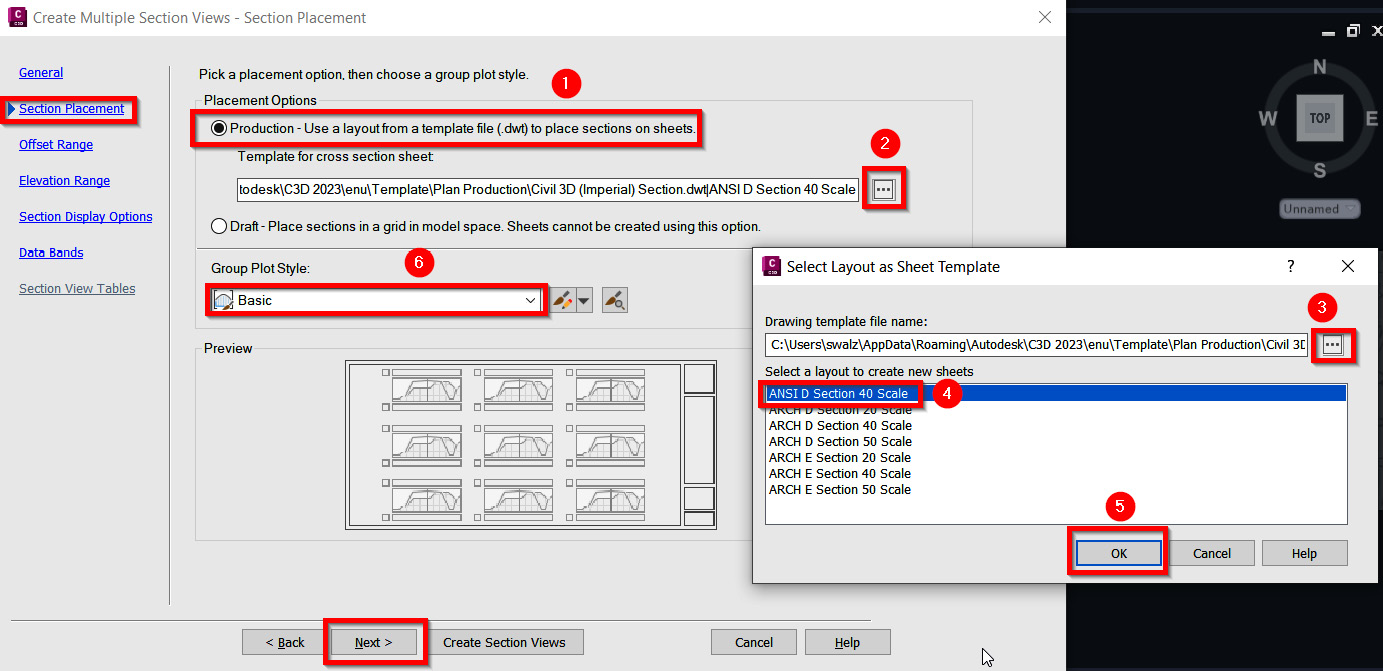
Figure 13.20 – The Create Multiple Section View – Section Placement tab
Note
Note that we were to select the Draft – Place sections option in a grid in Model Space, sheets cannot be created using this option, so Civil 3D will place all the Section Views in a grid. These Section Views are great for quickly analyzing all Civil 3D modeled objects that cross our sample lines but can be difficult to organize for sheeting purposes later on down the road. This is not to say it can’t be done, but it makes it more time-consuming if there is a need to sheet all Section Views.
The final four tabs (Offset Range, Elevation Range, Section Display Options, and Data Bands) are the same as what we previously reviewed when we were generating individual Section Views. That said, we’ll apply the same selections we had in the previous section and click on the Create Section Views button at the bottom of the Create Multiple Section Views dialog box.
After selecting the Create Section View button, the Create Section View dialog box will disappear, and we’ll be prompted at the command line to Identify Section View Origin. Just as we did earlier, we’ll click in an open area within our Model Space to manually place our Section Views, with our multiple section view layout looking similar to that shown in Figure 13.21.
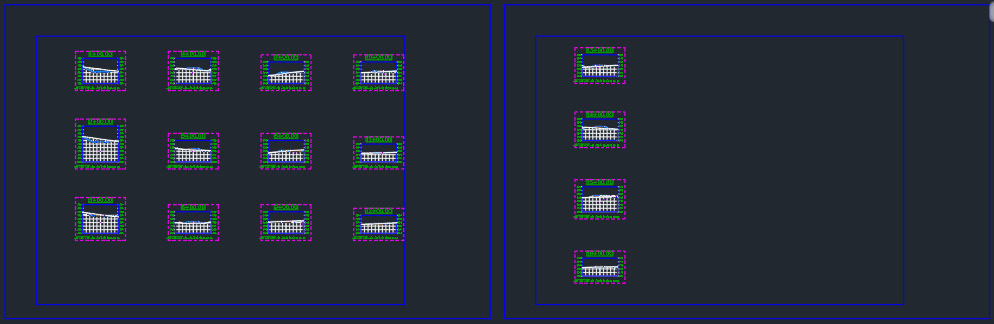
Figure 13.21 – Multiple section views along the ALG – Subdivision Main Road – Access alignment
With all Section Views created along our ALG – Subdivision Main Road – Access alignment, let’s run through the same process for our sample line group associated with ALG - Subdivision Side Road - Cul-De-Sac alignment. We’ll want to apply the same steps as before, but with the following changes specified in our General tab within the Create Multiple Section Views dialog box:
- Select Alignment: ALG – Subdivision Side Road – Cul-De-Sac
- Sample Line Group Name: SLG – Subdivision Side Road – Cul-De-Sac
- Section View Name: SCV – Subdivision Side Road – Cul-De-Sac
- Description: Section Views along Subdivision Side Road – Cul-De-Sac
After running through all the steps within the Create Multiple Section Views dialog box and then placing our multiple Section Views in an open area within our Model Space, we can start looking at different ways to analyze the sections that have been generated for us.
The first and most obvious way to analyze our sections is by simply looking at/reviewing each Section View to verify that all Civil 3D modeled objects displayed make sense (that is, gravity and pressure network piping are located below the finished grade, proposed grade lines are tying back into existing grade lines as expected, corridor model geometry appears as expected, and so on).
Quick tip
If we select any one of our Section Views to pull up the Section View Contextual ribbon, we’ll gain access to the Analyze panel, which contains a Station Tracker tool. If we have our Model Space view set up with multiple views, where one view is displaying Section Views while another is displaying our Plan View, we can quickly locate where each section is located within our Plan View, as shown in Figure 13.22:
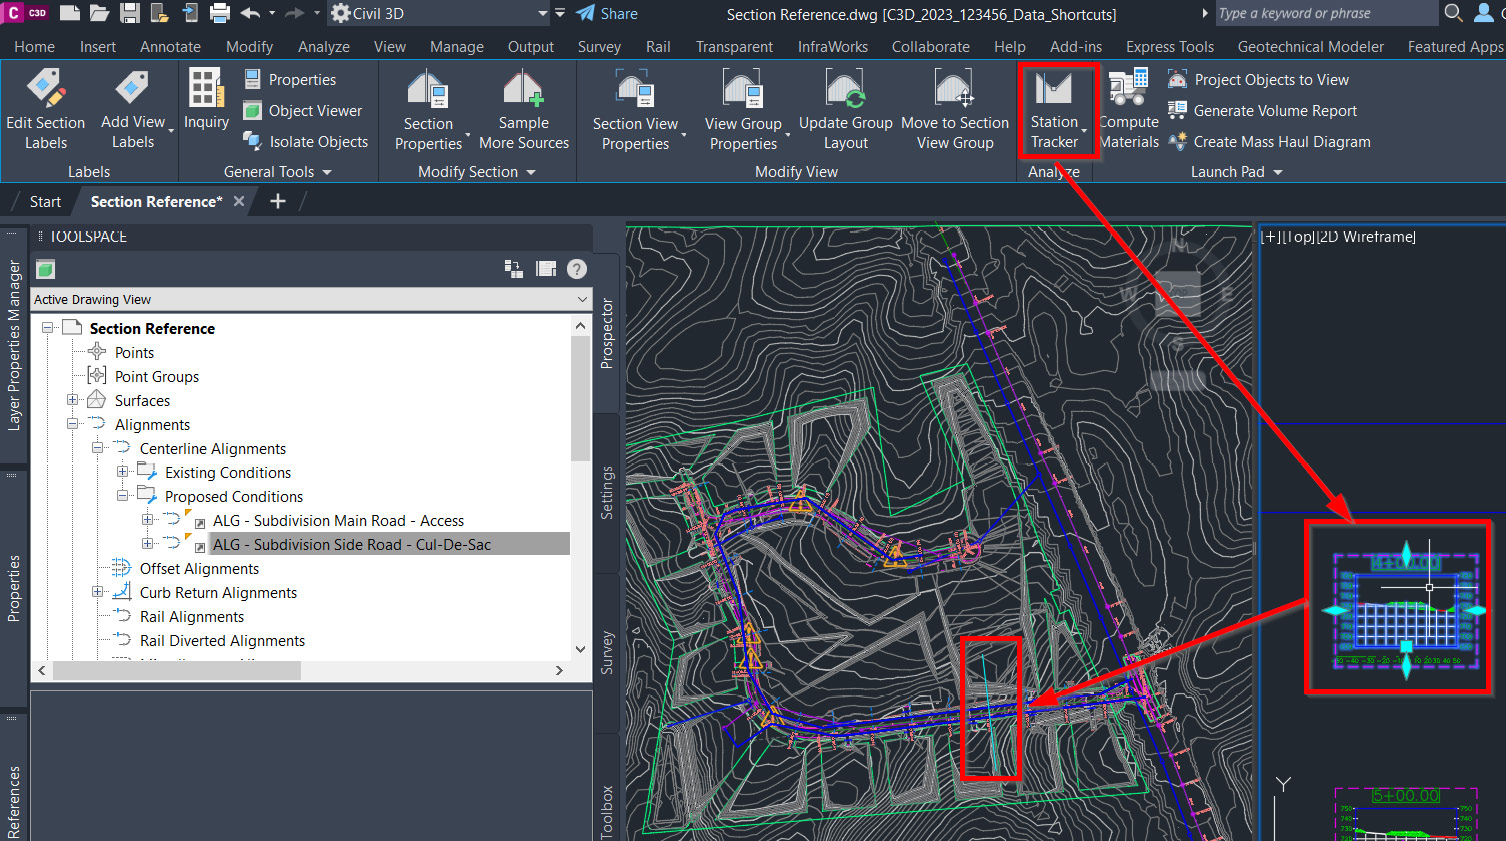
Figure 13.22 – Section View Station Tracker
The second type of analysis that can be performed at this stage allows us to generate quantity reports of material and analyze cut versus fill as it relates to earthwork so that we can better gauge how much dirt needs to be moved/relocated and either carried off-site during construction or brought in to build our site up.
All these types of metrics will provide significant value and insight to contractors as they are bidding for the job and provide enough information for the owner to make a more informed decision as it relates to funding. These tools are available through the Compute Materials tool available in the Launch Pad panel within our Section View Contextual ribbon, as shown in Figure 13.23:
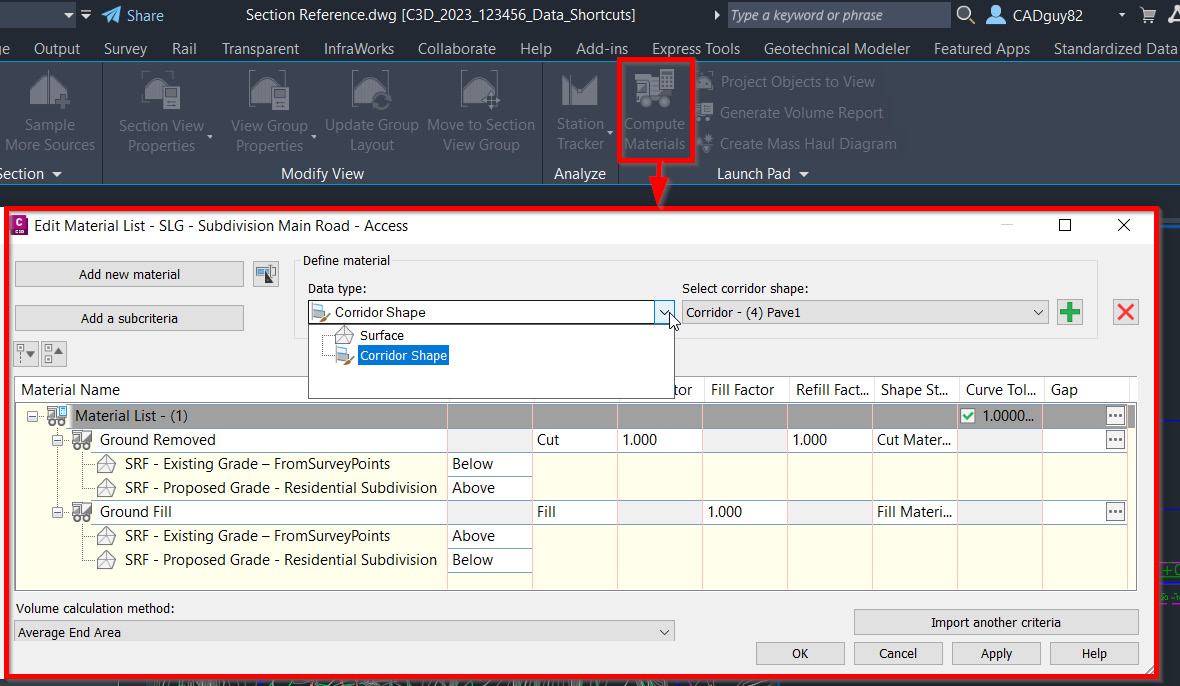
Figure 13.23 – Section View Station Tracker
Once we’re satisfied with how our sections look and that all modeled objects throughout our Residential Subdivision design are accurately located and in conformance to design standards and regulations, we can confidently say that we are finished with our design.
More and more frequently, we are seeing clients and agencies requesting a digital delivery solution, whereas designs are submitted with Models as the Legal Document (MALD), and plan production sheets are for information only. That said, at present, there is still a need to take the next steps to finalize all reference files in preparation for our construction drawing plan set.
Summary
By working through this chapter, we officially completed our Residential Subdivision design. We also gained the assurance that all modeled objects are located where they should be and as we intended them to be in conformance with design standards and regulations. We learned how we can generate Section Views (should the project require them) and maintain a dynamic link to all modeled objects throughout our design where our sample lines intersect. Furthermore, we also learned how we can leverage Section Views to further analyze our modeled objects and overall design.
In the next chapter, we’ll take a look at the plan production capabilities and tools available to us within Civil 3D, where we can automatically generate sheet files of our design. This will essentially be the final step that we’ll want to take just before submitting our design as part of the digital delivery process. Historically, this effort is begun much earlier on in the design process, typically just before a conceptual design review.
However, as the modeling process becomes more intricate, and technology advancements continue to increase the possibilities of reviewing our models in place of sheets, we must spend more time and effort up front, ensuring that our models are truly representative of our design and that we are maintaining dynamic linking between as many modeled objects as possible to minimize risk and rework later on down the road.