
9
Monitoring, Backup, and Security
Monitoring, backup, and security should not be afterthoughts, but necessary processes before deploying MongoDB in a production environment. In addition, monitoring can (and should) be used to troubleshoot and improve performance at the development stage.
In this chapter, we will discuss the operational aspects of MongoDB. Having a backup strategy that produces correct and consistent backups, as well as making sure that our backup strategy will work in the unfortunate case that a backup is needed, will be covered in this chapter. Finally, we will discuss security for MongoDB for many different aspects, such as authentication, authorization, network-level security, and how to audit our security design.
This chapter will focus on the following three areas:
- Monitoring clusters
- Cluster backups
- Securing our clusters
Technical requirements
You will need MongoDB version 5 or a free tier account in MongoDB Atlas installed to smoothly sail through the chapter. The code that has been used for all the chapters and can be found at https://github.com/PacktPublishing/Mastering-MongoDB-6.x.
Monitoring clusters
When we are designing a software system, we undertake many explicit and implicit assumptions. We always try to make the best decisions based on our knowledge, but there may be some parameters that we have underestimated or didn’t take into account.
Using monitoring, we can validate our assumptions and verify that our application performs as intended and scales as expected. Good monitoring systems are also vital for detecting software bugs and helping us detect early potential security incidents.
The following screenshot shows the wealth of options for monitoring in MongoDB Atlas. Detailing each and every metric is outside the scope of this chapter, but it’s important to have at least a cursory understanding of what each metric measures.
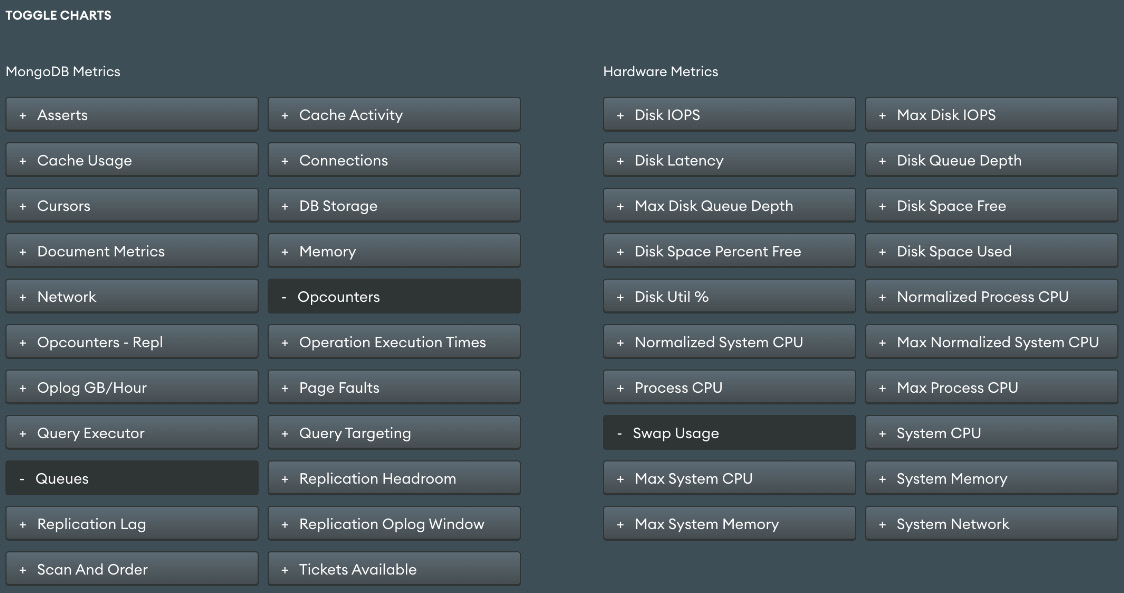
Figure 9.1 – MongoDB Atlas monitoring metrics
What should we monitor?
By far the most important metric to monitor in MongoDB is memory usage. MongoDB (and every database system, for what it’s worth) uses system memory extensively to increase performance. Whether we use the built-in WiredTiger storage engine or one of the commercial alternatives, memory usage is the first thing that we should keep our eyes on.
Understanding how computer memory works can help us evaluate metrics from our monitoring system. The following are the most important concepts related to computer memory.
Page faults
RAM is fast but expensive. Hard disk drives, or solid-state drives, are relatively cheaper and slower, and they also provide durability for our data in the case of system and power failures. All of our data is stored on the disk, and when we perform a query, MongoDB will try to fetch data from the memory. If the data is not in the memory, then it will fetch the data from the disk and copy it to the memory. This is a page fault event because the data in the memory is organized into pages.
As page faults happen, the memory gets filled up and eventually, some pages need to be cleared for more recent data to come into the memory. This is called a page eviction event. We cannot completely avoid page faults unless we have a really static dataset, but we do want to try to minimize page faults. This can be achieved by holding our working set in memory.
Memory
The resident memory size is the total amount of memory that MongoDB owns in the RAM. This is the base metric to monitor, and it should be less than 80% of the available memory.
Virtual and mapped memory
When MongoDB asks for a memory address, the operating system will return a virtual address. This may or may not be an actual address in the RAM, depending on where the data resides. MongoDB will use this virtual address to request the underlying data. When we have journaling enabled (which should be always enabled, unless we fully understand and accept the data loss risk from disabling it), MongoDB will keep another address on record for the journaled data. Data after the last checkpoint, which is by default every 60 seconds, will be written in the journal. The virtual memory refers to the size of all of the data requested by MongoDB, including the journaling.
The mapped memory excludes journaling references.
What all of this means is that over time, our mapped memory will be roughly equal to our working set, and the virtual memory will be our mapped memory size plus the dataset size after the last checkpoint.
Working sets
The working set is the data size that MongoDB uses. In the case of a transactional database, over time, this will converge to the data size that MongoDB holds, but there may be cases where we have collections that are not used at all and will not contribute to our working set.
We can directly monitor memory in MongoDB Atlas at the MongoDB level using the Memory option from Figure 9.1. We can indirectly monitor memory usage by using the hardware metrics from the same page named after System Memory and Max System Memory.
Tracking free space
A common issue with any database is running out of free disk space. As with the memory, we need to track the disk space usage and be proactive, rather than reactive, with it. Keep monitoring the disk space usage, with proper alerts when it reaches 40%, 60%, or 80% of the disk space, especially for datasets that grow quickly.
Disk space issues are often the ones that cause the most headaches for administrators, DevOps, and developers because of the time it takes to move data around.
Note
The directoryperdb option can help with data sizing as we can split our storage into different physically mounted disks.
We can monitor disk IOPS and disk free space in the Hardware Metrics section of the monitoring dashboard in MongoDB Atlas.
Monitoring replication
Replica sets use the operations log (oplog) to keep the synced state. Every operation gets applied on the primary server and then gets written in the primary server’s oplog, which is a capped collection. Secondaries read this oplog asynchronously and apply the operations one by one.
If the primary server gets overloaded, then the secondaries won’t be able to read and apply the operations fast enough, generating replication lag. Replication lag is counted as the time difference between the last operation applied on the primary and the last operation applied on the secondary, as stored in the oplog capped collection.
For example, if the time is 4:30 PM and the secondary just applied an operation that was applied on our primary server at 4:25 PM, this means that the secondary is lagging five minutes behind our primary server.
In our production cluster, the replication lag should be close to (or equal to) zero.
We can monitor the replication lag in the MongoDB Metrics section of the monitoring dashboard in MongoDB Atlas.
Oplog size
Every member in a replica size will have a copy of the oplog in db.oplog.rs(). The reason for this is that if the primary steps down, one of the secondaries will get elected, and it needs to have an up-to-date version of the oplog for the new secondaries to track.
The oplog size is configurable, and we should set it to be as large as possible. The oplog size doesn’t affect the memory usage and can make or break the database in cases of operational issues.
The reason for this is that if the replication lag increases over time, we will eventually get to the point where the secondaries will fall so far behind the primary that the secondary server won’t be able to read from the primary’s oplog; this is because the oldest entry in the primary’s oplog will be later than the latest entry that was applied in our secondary server. Essentially, in this case, there will be a gap between the secondary and primary oplogs. During this gap, we lost track of operations that might have happened, and this causes MongoDB to halt replication.
In general, the oplog should hold at least 1 to 2 days’ worth of operations. The oplog should be longer than the time it takes for the initial sync, for the same reason that is detailed earlier.
We can monitor the oplog size in the MongoDB Metrics section of monitoring in MongoDB Atlas using the Replication Oplog window and the Oplog GB/Hour metrics.
Network
Network usage can be the bottleneck in performance or it can be indicative of another issue with the environment. In both cases, it’s useful to keep an eye on network usage and if possible report any anomalies for further investigation. We can inspect Bytes in, Bytes out, and number of requests using the Network option in the MongoDB Metrics section of the monitoring dashboard in MongoDB Atlas.
Cursors and connections
The number of connections and the number of cursors (open and timed out) in the MongoDB Metrics section of monitoring in MongoDB Atlas can verify the health state of our cluster.
Too many connections may drain the database and reveal a systemic issue with our application code. Too few connections can be underutilizing our database.
Too many open cursors will also put extra load on our database, and too many timeout cursors means that our database is already under heavy load.
Document Metrics
The Document Metrics option in the MongoDB Metrics section of the monitoring dashboard in MongoDB Atlas outputs the number of CRUD operations happening every second across each server in the cluster.
Not all CRUD operations are created equal in terms of adding load to the database, but on average, this is a useful metric to identify if one of the servers is behaving out of sync with the rest of the cluster.
For example, if we have two identical secondaries in a replica set and one of them is showing less than half of the operations occurring compared to the other, it could be a sign of some network bandwidth or a configuration issue between this server and the primary.
Monitoring memory usage in WiredTiger
Using WiredTiger, we can define the internal cache memory usage on startup. By default, the internal cache will be ( (total RAM size in GB) - 1 ) / 2, with a lower limit of 256 MB and an upper limit of 10 GB.
This means that in a system with 16 GB RAM, the internal cache size would be ( 16 - 1 ) / 2 = 7.5 GB.
On top of the internal cache, there is also memory that MongoDB can allocate for other operations such as maintaining connections and data processing (in-memory sort, map-reduce, aggregation, and more).
MongoDB processes using the WiredTiger storage engine will also use all of the available memory in the underlying operating system by using the filesystem cache.
We can view the settings for the WiredTiger cache via the mongo shell as follows:
> db.serverStatus().wiredTiger.cache
We can adjust its size by using the storage.wiredTiger.engineConfig.cacheSizeGB parameter.
The generic recommendation is to leave the WiredTiger internal cache size at its default. If our data has a high compression ratio, it may be worth reducing the internal cache size by 10% to 20% to free up more memory for the filesystem cache.
Tracking page faults
The number of page faults can remain fairly stable and not affect performance significantly. However, once the number of page faults reaches a certain threshold, our system will be quickly and severely degraded. This is even more evident for HDDs, but it affects solid-state drives (SSDs) as well.
The way to ensure that we don’t run into problems regarding page faults is to always have a staging environment that is identical to our production in setup. This environment can be used to stress test how many page faults our system can handle, without deteriorating performance. Comparing the actual number of page faults in our production system with the maximum number of page faults that we calculated from our staging system, we can find out how much leeway we have left.
Another way to view page faults is via the shell, looking at the extra_info field of the serverStatus output as follows:
> db.adminCommand({"serverStatus" : 1})['extra_info']
{ "note" : "fields vary by platform", "page_faults" : Long("3465") }
As the note states, these fields may not be present on every platform.
Tracking B-tree misses
As you saw in the previous chapter, proper indexing is the best way to keep MongoDB responsive and performant. B-tree misses refer to page faults that happen when we try to access a B-tree index. Indexes are usually used frequently and are relatively small compared to our working set and the memory available, so they should be in the memory at all times.
If we have an increasing number of B-tree misses or ratio of B-tree hits, or if there is a decrease in the number of B-tree misses, it’s a sign that our indexes have grown in size and/or are not optimally designed. B-tree misses can also be monitored via MongoDB Cloud Manager, or in the shell.
Note
In the shell, we can use collection stats to get B-tree information, located under the B-tree subdocument.
I/O wait
I/O wait refers to the time that the operating system waits for an I/O operation to complete. It has a strong positive correlation with page faults. If we see I/O wait increasing over time, it’s a strong indication that page faults will follow as well. We should aim to keep the I/O wait at less than 60% to 70% for a healthy operational cluster. This can buy us some time to upgrade in the case of a suddenly increased load.
Read and write queues
Another way to look at I/O wait and page faults is via read and write queues. When we have page faults and I/O wait, requests will inevitably start to queue for either reads or writes. Queues are the effect rather than the root cause, so by the time the queues start building up, we know we have a problem to solve.
Lock percentage
Lock percentage was important with the original MMAPv1 MongoDB storage engine, which was deprecated in MongoDB version 4. WiredTiger implements document-level concurrency and transparently retries operations to overcome write conflicts.
WiredTiger only needs to use an intent lock in the global, database, and collection levels and so locking is not nearly as much of an issue in the current version as it was in the past.
While locking is less of an issue, we can still have high contention in any of the document, collection, database, or global levels that will result in queues building up over time. We can monitor the number of operations waiting for a read lock, a write lock, or the total (sum) of these two. These metrics and many others are available in every MongoDB environment. For example, in MongoDB Atlas, queues is currently an option under the View monitoring option on the cluster dashboard page.
Working set calculations
A working set is the strongest indicator of our memory requirements. Ideally, we would like to have our entire dataset in the memory, but most of the time, this is not feasible. The next best thing is to have our working set in memory. The working set can only be calculated indirectly as of MongoDB version 3.0.
Indirectly, our working set is the size of the data that we need to satisfy 95% or more of our user’s requests. To calculate this, we need to identify the queries that the users make and which datasets they use from the logs. Adding 30% to 50% to it for index memory requirements, we can arrive at the working set calculation.
Another indirect way of estimating the working size is through the number of page faults. If we don’t have page faults, then our working set fits in the memory. Through trial and error, we can estimate the point at which the page faults start to happen and understand how much more of a load our system can handle.
If we can’t have the working set in memory, then we should have at least enough memory so that the indexes can fit in memory. In the previous chapter, we described how we can calculate index memory requirements and how we can use this calculation to size our RAM accordingly.
Monitoring tools
There are several options for monitoring. In this section, we will discuss how we can monitor by using MongoDB’s own tools or third-party tools.
Free cloud-based monitoring
MongoDB offers free cloud-based monitoring for on-premises installations. It is as simple as typing db.enableFreeMonitoring() in the command line.
The result then will be as follows:
{
...
"url": "<MONGODB_MONITORING_URL>"
...
}
We can then go to the MONGODB_MONITORING_URL and watch metrics from our server. This URL is not authenticated and it’s only hard to guess because of a long unique part of the URL. This is fair enough for development purposes but should not be used for any production deployment as we could potentially leak our cluster’s monitoring status to an adversary.
SaaS-hosted tools
MongoDB, Inc.’s own tool MongoDB Cloud Manager (formerly MongoDB Monitoring Service) is a robust tool for monitoring all of the metrics that were described earlier. MongoDB Cloud Manager requires a MongoDB Enterprise Advanced subscription with a 30-day trial period.
MongoDB Cloud Manager metrics can also be accessed via MongoDB Atlas, MongoDB, Inc.’s DBaaS offering. This also has a limited free tier and is available in all three major cloud providers (Amazon, Google, and Microsoft).
On-premises tools
MongoDB Ops Manager (available with MongoDB Enterprise Advanced), is the on-premises version of the MongoDB Cloud Manager.
MongoDB Cloud Manager should be used when we want a SaaS-hosted tool to monitor our own MongoDB servers, deployed on-premises or in the cloud of our choice.
MongoDB Ops Manager should be used where we can’t have a SaaS pointing to our servers. This could be, for example, because of security requirements.
We can use the Ops Manager (as part of downloading MongoDB Enterprise Advanced) in our local dev environment for free for evaluation and development purposes, but any other production use, including testing (pre-prod environments), is forbidden by the Terms of Use of MongoDB Enterprise Advanced.
Open source tools
All major open source tools, such as Nagios, Munin, and Cacti, provide plugin support for MongoDB. Although it is beyond the scope of this book, operations and DevOps should be familiar with both setting up and understanding the metrics that were described earlier in order to effectively troubleshoot MongoDB and preemptively resolve issues before they grow out of proportion.
The mongotop and mongostat commands and scripts in the mongo shell can also be used for ad hoc monitoring. One of the risks with such manual processes, however, is that any failure of the scripts may jeopardize our database. If there are well-known and tested tools for your monitoring needs, please avoid writing your own.
In this section, we went through the attributes that we should be monitoring using MongoDB. We also learned about an array of different tools that we can use to monitor our MongoDB database, both on-premises or in the cloud. In the following section, we will learn about one of the best safeguards for when (and not if) things go south: taking backups of our data.
Cluster backups
A well-known maxim goes as follows:
“Hope for the best, plan for the worst.”
– John Jay (1813)
This should be our approach when designing our backup strategy for MongoDB. There are several distinct failure events that can happen.
Backups should be the cornerstone of our disaster recovery strategy in case something happens. Some developers may rely on replication for disaster recovery, as it seems that having three copies of our data is more than enough. We can always rebuild the cluster from the other two copies in case one of the copies is lost.
This is the case in the event of disks failing. Disk failure is one of the most common failures in a production cluster and will statistically happen once the disks start reaching their mean time between failures (MTBF).
However, it is not the only failure event that can happen. Security incidents, or human errors, are just as likely to happen and should be an integral part of our plan. Catastrophic failures by means of losing all replica set members at once, from a fire, a flood, an earthquake, or a disgruntled employee, are events that should not lead to production data loss.
Note
A useful interim option, in the middle ground between replication and implementing proper backups, could be setting up a delayed replica set member. This member can lag several hours or days behind the primary server so that it will not be affected by malicious changes in the primary. The important detail to take into account is that the oplog needs to be configured so that it can hold several hours of delay. Also, this solution is only an interim as it doesn’t take into account the full range of reasons why we need disaster recovery, but it can definitely help with a subset of them.
Disaster recovery is a class of failures that require backups to be taken not only periodically, but also by using a process that isolates them (both geographically and in terms of access rules) from our production data.
Backup options
Depending on our deployment strategy, we can choose different options for backups.
Cloud-based solutions
The most straightforward solution arises if we are using a cloud DBaaS solution. In the example of MongoDB Atlas, we can manage backups from the GUI or using the API.
MongoDB Atlas offers the Cloud Backups service, which uses the snapshot functionality from the underlying cloud provider (AWS, Microsoft Azure, or Google Cloud Platform) to provide both on-demand and Continuous Cloud Backups with a frequency and retention that is dependent on the MongoDB Atlas cloud level of service selected. This feature is only available on paid plans.
Continuous Cloud Backups use the oplog to back up our data, so we need to make sure that the oplog size is larger than the writes that will incur between two backup attempts. If the oplog size is not large enough, then the backup will be aborted.
Backups, either on-demand or continuously taken, guarantee point-in-time recovery.
Note
MongoDB Atlas backups are the recommended method by MongoDB for sharded clusters, only because of their operational efficiency.
On-premises solutions
If we host MongoDB on our own servers, we can use MongoDB, Inc.’s MongoDB Cloud Manager. Cloud Manager is a SaaS that we can point to our own servers to monitor and back up our data. It uses the same oplog that replication uses and can back up both replica sets and sharded clusters.
If we don’t want to (or can’t, for security reasons) point our servers to an external SaaS service, we can use MongoDB Cloud Manager’s functionality on-premises, using MongoDB Ops Manager. To get MongoDB Ops Manager, we need to get a subscription to the Enterprise Advanced edition of MongoDB for our cluster.
Backups with filesystem snapshots
The most common backup method in the past, and one that is still sometimes used, relies on the underlying filesystem point-in-time snapshots functionality to back up our data.
EBS on EC2, and Logical Volume Manager (LVM) on Linux, support point-in-time snapshots.
Note
If we use WiredTiger with the latest version of MongoDB, we can have volume-level backups, even if our data and journal files reside in different volumes.
We can make a backup of a replica set as follows:
- To make a backup of a replica set, we need to have a consistent state for our database. This implies that we have all of our writes either committed to the disk or in our journal files.
- If we use WiredTiger storage, our snapshot will be consistent as of the latest checkpoint, which is either 2 GB of data or the last-minute backup.
Note
Ensure that you store the snapshot in an off-site volume for disaster recovery purposes. You need to have enabled journaling to use point-in-time snapshots. It’s good practice to enable journaling regardless.
Making a backup of a sharded cluster
If we want to make a backup of an entire sharded cluster, we need to stop the balancer before starting. The reason is that if there are chunks migrating between different shards at the time that we take our snapshot, our database will be in an inconsistent state, having either incomplete or duplicate data chunks that were in flight at the time we took our snapshot.
Backups from an entire sharded cluster will be approximate in time. If we need point-in-time precision, we need to stop all of the writes in our database, something that is generally not possible for production systems.
First, we need to disable the balancer by connecting to mongos through the mongo shell as follows:
> use config
> sh.stopBalancer()
Then, if we don’t have journaling enabled in our secondaries, or if we have journal and data files in different volumes, we need to lock our secondary mongo instances for all shards and the config server replica set.
Note
We also need to have a sufficient oplog size in these servers so that they can catch up to the primaries once we unlock them; otherwise, we will need to resync them from scratch.
Given that we don’t need to lock our secondaries, the next step is to back up the config server. In Linux (and using LVM), this would be similar to doing the following:
$ lvcreate --size 100M --snapshot --name snap-14082017 /dev/vg0/mongodb
Then, we need to repeat the same process for a single member from each replica set in each shard.
Finally, we need to restart the balancer using the same mongo shell that we used to stop it, as follows:
> sh.setBalancerState(true)
Without going into too much detail here, it’s evident that making a backup of a sharded cluster is a complicated and time-consuming procedure. It needs prior planning and extensive testing to make sure that it not only works with minimal disruption but also that our backups are usable and can be restored back to our cluster.
Note
MongoDB Atlas can back up an entire sharded cluster without any of the preceding steps. It’s all possible using the GUI or API, providing a guarantee for point-in-time restore of a snapshot. It is the recommended method by MongoDB.
Making backups using mongodump
The mongodump tool is a command-line tool that can make a backup of the data in our MongoDB cluster. As such, the downside is that all of the indexes need to be recreated on restore, which may be a time-consuming operation.
The major downside that the mongodump tool has is that in order to write data to the disk, it needs to bring data from the internal MongoDB storage to the memory first. This means that in the case of production clusters running under strain, mongodump will invalidate the data residing in the memory from the working set with the data that would not be residing in the memory under regular operations. This degrades the performance of our cluster.
On the plus side, when we use mongodump, we can continue taking writes in our cluster, and if we have a replica set, we can use the --oplog option to include the entries that occur during the mongodump operation in its output oplog.
If we go with that option, we need to use --oplogReplay when we use the mongorestore tool to restore our data back to the MongoDB cluster.
mongodump is a great tool for single-server deployments, but once we get to larger deployments, we should consider using different (and better planned) approaches to back up our data.
Note
We can’t use mongodump/mongorestore with a sharded cluster in MongoDB 4.2 or later. This is because in-flight sharded transactions may end up in an inconsistent state.
Backing up by copying raw files
If we don’t want to use any of the preceding options that were outlined, our last resort is to copy the raw files using cp/rsync, or something equivalent. This is generally not recommended for the following reasons:
- We need to stop all of the writes before copying files.
- The backup size will be larger since we need to copy indexes and any underlying padding and fragmentation storage overhead.
- We cannot get point-in-time recovery by using this method for replica sets, and copying data from sharded clusters in a consistent and predictable manner is extremely difficult.
Note
Making a backup by copying raw files should be avoided unless no other option really exists.
Making backups using queuing
Another strategy that’s used in practice is utilizing a queuing system, intercepting our database and the frontend software system. Having something such as an ActiveMQ queue before the inserts/updates/deletes in our database means that we can safely send out data to different sinks, which are MongoDB servers or log files in a separate repository. Like the delayed replica set method, this method can be useful for a class of backup problems but can fail for some others.
Note
This is a useful interim solution, but it should not be used as a permanent one.
EC2 backup and restore
MongoDB Cloud Manager can automate making backups from EC2 volumes. Given that our data is in the cloud, we could use the Cloud Manager instead.
But then, if we can’t use the Cloud Manager for some reason, we can write a script to make a backup by implementing the following steps:
- Assuming that we have journaling enabled (and we really should) and we have already mapped dbpath, containing data and journal files to a single EBS volume, we first need to find the EBS block instances associated with the running instance by using ec2-describe-instances.
- The next step is to find the logical volumes that dbpath of our MongoDB database is mapped to using lvdisplay.
- Once we have identified the logical devices from the logical volumes, we can use ec2-create-snapshot to create new snapshots. We need to include each and every logical device that maps to our dbpath directory.
To verify that our backups work, we need to create new volumes based on the snapshots and mount the new volumes there. Finally, the mongod process should be able to start mounting the new data, and we should connect by using MongoDB to verify these.
Using EC2 servers to host our MongoDB servers is less popular now than it was in the past, mostly because of the wide variety of other options available.
Incremental backups
Making full backups every time may be viable for some deployments, but as the size reaches a certain threshold, full backups take too much time and space.
At this point, we will want to make full backups every once in a while (maybe once per month, for example) and incremental backups in-between (for example, nightly).
Both Ops Manager and Cloud Manager support incremental backups, and if we get to this size, it may be a good idea to use a tool to make our backups instead of rolling out our own.
If we don’t want to (or can’t) use these tools, we have the option of restoring via the oplog as follows:
- Make a full backup with any method that was described earlier.
- Lock writes on the secondary server of our replica set.
- Note the latest entry in the oplog.
- Export the entries from the oplog after the latest entry as follows:
> mongodump --host <secondary> -d local -c oplog.rs -o /mnt/mongo-oldway_backup
--query '{ "ts" : { $gt : Timestamp(1467999203, 391) } }'
- Unlock writes on the secondary server.
To restore, we can use the oplog.rs file that we just exported, and use mongorestore with the --oplogReplay option as follows:
> mongorestore -h <primary> --port <port> --oplogReplay <data_file_position>
This method requires locking writes and as such is not recommended in general.
An even better solution is to use the LVM filesystem with incremental backups, but this depends on the underlying LVM implementation, which we may or may not be able to tweak.
Making backups is the best way to protect ourselves from catastrophic failures, no matter whether the root cause is in our control or not. In the following section, we will learn about how we can best secure our data from unauthorized access. Security is one of the most important non-functional requirements that we must take into account while designing, developing, and maintaining MongoDB-based systems.
Securing our clusters
Security is a multifaceted goal in a MongoDB cluster. For the rest of this chapter, we will examine different attack vectors and how we can protect against them. In addition to these best practices, developers and administrators must always use common sense so that security interferes only as much as is required for operational goals.
Authentication
Authentication refers to verifying the identity of a client. This prevents the impersonation of someone in order to gain access to their data.
Username/password client-based authentication
The simplest way to authenticate is by using a username and password pair. This can be done via the shell in two ways, the first of which is as follows:
> db.auth( <username>, <password> )
Passing in a comma-separated username and password will assume the default values for the rest of the fields as follows:
> db.auth( {
user: <username>,
pwd: <password>,
mechanism: <authentication mechanism>,
digestPassword: <boolean>
} )
If we pass a document object, we can define more parameters than username/password.
Client-server and server-server key-based authentication
Authenticating our clients with a username/password pair is the simplest way to authenticate our clients to the server.
Taking this one step forward, we can authenticate our users with a certificate file. The (authentication) mechanism parameter can take several different values, with the default being SCRAM-SHA-256.
MONGODB-x.509 is used for TLS/SSL authentication. Users and internal replica set servers can be authenticated by using SSL certificates, which are self-generated and signed or come from a trusted third-party authority.
To configure x.509 for internal authentication of replica set members, we need to supply one of the following parameters.
The following is for the configuration file:
security.clusterAuthMode / net.ssl.clusterFile
The following is used on the command line:
--clusterAuthMode and --sslClusterFile
> mongod --replSet <name> --sslMode requireSSL --clusterAuthMode x509 --sslClusterFile <path to membership certificate and key PEM file> --sslPEMKeyFile <path to SSL certificate and key PEM file> --sslCAFile <path to root CA PEM file>
MongoDB Enterprise Advanced, the paid offering from MongoDB, Inc., adds two more options for authentication as follows:
- The first added option is the Generic Security Service Application Program Interface (GSSAPI) Kerberos. Kerberos is a mature and robust authentication system that can be used for Windows-based Active Directory deployments, among others.
- The second added option is LDAP Proxy Authentication (LDAP SASL). LDAP is similar to Kerberos; it’s a mature and robust authentication mechanism that is the foundation behind Microsoft’s Active Directory.
We can mutually authenticate our replica set or sharded cluster servers to one another using the same methodology, and this is good practice to do in a production environment.
Localhost exception
Landing into a project that’s already well on the way should have authentication and roles sorted already. It’s only when we are starting a greenfield project that we need to use the localhost exception. Simply put, the localhost exception allows us to create only the first user or role ever in the database.
In a standalone database or a replica set, the localhost exception rule only applies when there are no users or roles set up.
In a sharded environment, the localhost exception rule applies to each shard in isolation and the entire cluster as a whole.
Note
We should create the first user using either the userAdmin or userAdminAnyDatabase role to be able to grant any permissions and create new users through this root user.
MongoDB Atlas also supports passwordless authentication using AWS IAM roles. It is compatible with passwordless AWS IAM authenticatiion setup or we can use SAML Single Sign On (SSO) using any 3rd party provider such as for example, Okta or Ping. The secret key that we will use locally for authentication is not persisted by the local driver or transmitted over the wire to the MongoDB Atlas servers, which is convenient for security reasons.
Role-based access control-based authorization
After we have configured the authentication to verify that the users are who they claim they are when connecting to our MongoDB server, we need to configure the rights that each one of them will have in our database.
This is the authorization aspect of permissions. MongoDB uses role-based access control to control permissions for different user classes.
Every role has permission to perform some actions on a resource.
A resource can be one or more collections or databases.
The command’s format is as follows:
{ db: <database>, collection: <collection> }If we specify "" (an empty string) for either db or collection, it means any db or collection. An example of this is as follows:
{ db: "mongo_books", collection: "" }This would apply our action in every collection in the mongo_books database.
Note
If the database is not the admin database, this will not include the system collections. System collections, such as <db>.system.profile, <db>.system.js, admin.system.users, and admin.system.roles, need to be defined explicitly.
Similar to the preceding option, we can define the following:
{ db: "", collection: "" }We define this to apply our rule to all of the collections across all of the databases, except for system collections, of course.
We can also apply rules across an entire cluster as follows:
{ resource: { cluster : true }, actions: [ "addShard" ] }The preceding example grants privileges for the addShard action (adding a new shard to our system) across the entire cluster. The cluster resource can only be used for actions that affect the entire cluster, rather than a collection or database (for example, shutdown, replSetReconfig, appendOplogNote, resync, closeAllDatabases, and addShard).
What follows is an extensive list of cluster-specific actions and some of the most widely used actions.
The list of the most widely used actions is as follows:
- find
- insert
- remove
- update
- bypassDocumentValidation
- viewRole/viewUser
- createRole/dropRole
- createUser/dropUser
- inprog
- killop
- replSetGetConfig/replSetConfigure/replSetStateChange/resync
- getShardMap/getShardVersion/listShards/moveChunk/removeShard/addShard
- dropDatabase/dropIndex/fsync/repairDatabase/shutDown
- serverStatus/top/validate
The cluster-specific actions are as follows:
- unlock
- authSchemaUpgrade
- cleanupOrphaned
- cpuProfiler
- inprog
- invalidateUserCache
- killop
- appendOplogNote
- replSetConfigure
- replSetGetConfig
- replSetGetStatus
- replSetHeartbeat
- replSetStateChange
- resync
- addShard
- flushRouterConfig
- getShardMap
- listShards
- removeShard
- shardingState
- applicationMessage
- closeAllDatabases
- connPoolSync
- fsync
- getParameter
- hostInfo
- logRotate
- setParameter
- shutdown
- touch
- connPoolStats
- cursorInfo
- diagLogging
- getCmdLineOpts
- getLog
- listDatabases
- netstat
- serverStatus
- top
If this sounds too complicated, that’s because it is! The flexibility that MongoDB allows for configuring different actions on resources means that we need to study and understand the extensive lists, as described earlier.
Thankfully, some of the most common actions and resources are bundled in built-in roles.
We can use these built-in roles to establish the baseline of permissions that we will give to our users, and then fine-grain these based on the extensive list.
User roles
There are two different generic user roles that we can specify as follows:
- read: A read-only role across non-system collections and the following system collections: system.indexes, system.js, and system.namespaces collections
- readWrite: A read and modify role across non-system collections and the system.js collection
Database administration roles
There are three database-specific administration roles as follows:
- dbAdmin: The basic admin user role that can perform schema-related tasks, indexing, and gathering statistics. A dbAdmin cannot perform user and role management.
- userAdmin: Create and modify roles and users. This is complementary to the dbAdmin role.
Note
A userAdmin can modify itself to become a superuser in the database, or, if scoped to the admin database, the MongoDB cluster.
- dbOwner: Combining readWrite, dbAdmin, and userAdmin roles, this is the most powerful admin user role.
Cluster administration roles
The following are the cluster-wide administration roles that are available:
- hostManager: Monitor and manage servers in a cluster.
- clusterManager: Provides management and monitoring actions on the cluster. A user with this role can access the config and local databases, which are used in sharding and replication, respectively.
- clusterMonitor: Read-only access for monitoring tools provided by MongoDB, such as MongoDB Cloud Manager and the Ops Manager agent.
- clusterAdmin: Provides the greatest cluster management access. This role combines the privileges that are granted by the clusterManager, clusterMonitor, and hostManager roles. Additionally, the role provides the dropDatabase action.
Backup and restore roles
Role-based authorization roles can be defined in the backup and restore granularity level as follows:
- backup: Provides privileges that are needed to back up the data. This role provides sufficient privileges to use the MongoDB Cloud Manager backup agent, the Ops Manager backup agent, or mongodump.
- restore: Provides the privileges that are needed to restore data with mongorestore, without the --oplogReplay option or system.profile collection data.
Roles across all databases
Similarly, the following is the set of available roles across all databases:
- readAnyDatabase: Provides the same read-only permissions as read, except it applies to all but the local and config databases in the cluster. The role also provides the listDatabases action on the cluster as a whole.
- readWriteAnyDatabase: Provides the same read and write permissions as readWrite, except it applies to all but the local and config databases in the cluster. The role also provides the listDatabases action on the cluster as a whole.
- userAdminAnyDatabase: Provides the same access to user administration operations as userAdmin, except it applies to all but the local and config databases in the cluster. Since the userAdminAnyDatabase role allows users to grant any privilege to any user, including themselves, the role also indirectly provides superuser access.
- dbAdminAnyDatabase: Provides the same access to database administration operations as dbAdmin, except it applies to all but the local and config databases in the cluster. The role also provides the listDatabases action on the cluster as a whole.
Superuser roles
Finally, the following are the available superuser roles:
- root: Provides access to the operations and all of the resources of the readWriteAnyDatabase, dbAdminAnyDatabase, userAdminAnyDatabase, clusterAdmin, restore, and backup combined.
- __system: The __system role is assigned by MongoDB internally and is not designed to be used by applications or users. This role grants database-wide unrestricted access. If you definitely need this role, it’s better to create a user-defined role as explained earlier and grant it anyAction on anyResource instead.
Note
Superuser roles should be avoided as they can have potentially destructive permissions across all of the databases on our server.
Network-level security
Apart from MongoDB-specific security measures, the following are the best practices that have been established for network-level security:
- Only allow communication between servers, and only open the ports that are used for communicating between them. Use a firewall to ensure that every other port is closed.
- Always use TLS/SSL for communication between servers. This prevents man-in-the-middle attacks from impersonating a client.
- Always use different sets of development, staging, and production environments and security credentials. Ideally, create different accounts for each environment, and enable two-factor authentication in both staging and production environments.
- Use a VPN over TLS/SSL (for best performance) if we need to communicate to a server in a remote location. An example of such usage could be a delayed secondary server in a replica set in a remote location used for disaster recovery purposes.
- Use the net.bindIp configuration to limit communication to the mongod or mongos processes to the backend servers that will process the front end (UI) requests.
Auditing security
No matter how much we plan our security measures, a second or third pair of eyes from someone outside of our organization can give a different view of our security measures and uncover problems that we may have underestimated or overlooked. Don’t hesitate to involve security experts and white hat hackers to do penetration testing on your servers.
Special cases
Medical or financial applications require added levels of security for data privacy reasons.
If we are building an application in the healthcare space, accessing users’ sensitive and personally identifiable information, we may need to get HIPAA certified.
If we are building an application that interacts with payments and manages cardholder information, we may need to become PCI/DSS compliant.
Note
The specifics of each certification are outside the scope of this book, but it is important to know that MongoDB has use cases in these fields that fulfill the requirements, and, as such, it can be the right tool with proper, well-thought design.
Overview
Summing up the best practice recommendations involving security, we have the following:
- Enforce authentication: Always enable authentication in production environments.
- Enable access control: First, create a system administrator, and then use that administrator to create more limited users. Give as few permissions as needed for each user role.
- Define fine-grained roles in access control: Do not give more permissions than needed for each user.
- Encrypt communication between clients and servers: Always use TLS/SSL for communication between clients and servers in production environments. Always use TLS/SSL for communication between mongod and mongos or config servers as well.
- Encrypt data at rest: The MongoDB Enterprise Advanced edition offers the functionality to encrypt data when stored, using WiredTiger encryption at rest.
Note
Alternatively, we can encrypt data using filesystem, device, or physical encryption. In the cloud, we often get the option for encryption as well (for example, with EBS on Amazon EC2).
- Limit network exposure: MongoDB servers should only be connected to the application servers and any other servers that are needed for operations. Ports other than the ones that we set up for MongoDB communications should not be open to the outside world. If we want to debug MongoDB usage, it’s important to have a proxy server with controlled access set up to communicate with our database.
- Audit servers for unusual activity: The MongoDB Enterprise Advanced edition offers a utility for auditing. By using it, we can output events to the console, a JSON file, a BSON file, or the syslog. In any case, it’s important to make sure that audit events are stored in a partition that is not available to the system’s users.
- Use a dedicated operating system user to run MongoDB. Make sure that the dedicated operating system user can access MongoDB but doesn’t have unnecessary permissions.
- Disable JavaScript server-side scripts if they are not needed.
MongoDB can use JavaScript for server-side scripts with the following commands: mapReduce(), group(), $accumulator, and $function. If we don’t need these commands, we should disable server-side scripting by using the –noscripting option on the command line or setting security.javascriptEnabled=false.
Summary
In this chapter, you learned about three operational aspects of MongoDB: monitoring, backup, and security.
We discussed the metrics that we should monitor in MongoDB and how to monitor them. Following that, we discussed how to make backups and ensure that we can use them to restore our data. Finally, you learned about security with authentication and authorization concepts as well as network-level security and how to audit it.
As important as it is to design, build, and extend our application as needed, it is equally important to make sure that we have peace of mind during operations and are safeguarded from unexpected events, such as human error and internal or external malicious users.
In the following chapter, you will learn about pluggable storage engines, a new concept that was introduced in version 3.0 of MongoDB. Pluggable storage engines allow different use cases to be served, especially in application domains that have specific and stringent requirements concerning data handling and privacy.