
4
Auditing
In this chapter, we will learn how to set up, configure, and deploy auditing using MongoDB Enterprise Edition to showcase on-premises deployment and MongoDB Atlas for cloud-based deployment. Auditing is a mandatory requirement in regulated industries and is part of any best practice guideline around best security practices. By the end of this chapter, we will know how to deploy auditing on-premises or in a MongoDB Atlas environment, enabling us to design secure systems and comply with regulatory requirements if needed.
Auditing is a MongoDB feature that is only available in MongoDB Enterprise Edition and, at the time of writing, the non-shared instances of MongoDB Atlas, the M10 size or larger.
In this chapter, we will cover the following topics:
- Auditing and logging differences
- Audit setup in MongoDB Enterprise Edition
- Audit setup in MongoDB Atlas, the cloud-based DBaaS offering by MongoDB
- Audit case study
Technical requirements
To follow along with the code in this chapter, you will need to install MongoDB Enterprise Edition locally or connect to a MongoDB Atlas database. You can download MongoDB Enterprise Edition for developer evaluation for free from mongodb.com or use the fully managed DBaaS MongoDB Atlas offering, which provides a free tier and seamless upgrades to the latest version.
Auditing and logging differences
Auditing and logging are two concepts that are, sometimes, used interchangeably in some contexts. However, there are some important differences between the two.
Logging refers to program-level events that happen throughout its execution. Usually, these events are atomic operations that happen internally and contain information that is useful for development, bug identification, and fixing. Logging includes information about what happened in the level of detail that is useful for the developers. Often, logs are deleted after a short- or developer-determined amount of time.
As an example of logging, when we start up the MongoDB server, we can see entries in the logs like the following:
{"t":{"$date":"2022-02-05T13:10:05.951+00:00"},"s":"I", "c":"STORAGE", "id":22430, "ctx":"Checkpointer","msg":"WiredTiger message","attr":{"message":"[1644066605:951809][12592:0x700005bf7000], WT_SESSION.checkpoint: [WT_VERB_CHECKPOINT_PROGRESS] saving checkpoint snapshot min: 37, snapshot max: 37 snapshot count: 0, oldest timestamp: (0, 0) , meta checkpoint timestamp: (0, 0) base write gen: 1"}
This log entry, which is from the preceding WiredTiger storage subsystem, is referring to an internal checkpoint save that is used for journaling purposes. This log entry can also be useful for debugging purposes if there is ever a system failure, but it is not so useful for auditing purposes.
On the other hand, auditing refers to business-level events.
A business-level event refers to an action that is usually performed by a user and refers to a domain rather than an implementation-level library.
Auditing answers the question of “Who did What and When?” in the system. We might also want to answer the question of “Why?” in the case of a root cause investigation.
As an example of auditing, the following is a line from the audit log in MongoDB:
{ "atype" : "createCollection", "ts" : { "$date" : "2022-02-12T14:12:30.060+00:00" }, "uuid" : { "$binary" : "2jmqHHr3SoirJJ1/KwHk+Q==", "$type" : "04" }, "local" : { "ip" : "XXX", "port" : 27017 }, "remote" : { "ip" : "86.153.147.144", "port" : 60764 }, "users" : [ { "user" : "admin", "db" : "admin" } ], "roles" : [ { "role" : "readWriteAnyDatabase", "db" : "admin" } ], "param" : { "ns" : "audit-project.contracts" }, "result" : 0 }
Auditing configuration is usually driven by legal requirements in the case of certain industries and applications such as banking and defense.
Auditing is not performed in a vacuum but aims to offer a holistic view of a user’s interaction with the system. We should be able to answer the fundamental question of “What was the series of events that brought the system into the target state?” using auditing.
Auditing can be kept indefinitely and will be kept for as long as the legal requirements dictate. Usually, auditing requirements derive from regulatory requirements and, as such, are quite prescriptive in the exact details of implementation. What to audit, how long to store the data, and how exactly we should store the data and other parameters are prescribed in specifications such as the Payment Card Industry Data Security Standard (PCI DSS), which is used for payments processing.
Generally, we use logging to perform auditing tasks.
Currently, auditing is only available in the MongoDB Enterprise Edition and MongoDB Atlas standalone instances. Percona Server for MongoDB also supports auditing in a way that is mostly compatible with MongoDB’s own implementation.
Additionally, Amazon’s DocumentDB implements auditing features via Amazon CloudWatch. At the time of writing, DocumentDB is compatible with MongoDB 3.6 and 4.0.
Audit setup in MongoDB Enterprise Edition
MongoDB Enterprise Edition is the paid version of MongoDB. Anyone can download it from the MongoDB site for development or evaluation purposes, but it needs a license before installing on production servers.
Note
MongoDB Enterprise Edition supports audit log encryption using an external Key Management Interoperability Protocol (KMIP) server, starting from version 6.0.
All of the following examples can be reproduced locally using MongoDB Enterprise Edition.
Audit events and format
We can record any of the following events in the console, the syslog, a JSON file, or a BSON file:
- Schema (DDL) such as creating or dropping a collection
- Replica set and sharded cluster operations such as sharding an existing collection or adding a new shard
- Authentication and authorization such as authentication failure events
- CRUD operations, such as inserting, updating, deleting, or querying documents in the collection
The audit message format is as follows:
{
atype: <string>,
ts : { $date: <timestamp> },
uuid : { $binary: <string>, $type: <string> },
local: { ip: <string>, port: <int> || isSystemUser: <boolean> || unix: <string> },
remote: { ip: <string>, port: <int> || isSystemUser: <boolean> || unix: <string> },
users : [ { user: <string>, db: <string> }, ... ],
roles: [ { role: <string>, db: <string> }, ... ],
param: <document>,
result: <int>
}
By default, fields such as ts (timestamp), users, and rules are included in every audit log.
The atype, param, and result values for the events that are audited are specified in the Audit Event Actions, Details, and Results section of the official MongoDB documentation, which can be found at https://www.mongodb.com/docs/manual/reference/audit-message/.
An example of an audit output message is creating a database. Using the JSON output notation, the relevant audit log would be as follows:
{
atype: 'createDatabase',
param: { ns: <database> },
result: 0,
ts : { $date: <timestamp> },
uuid : { $binary: <string>, $type: <string> },
local: { ip: <string>, port: <int> || isSystemUser: <boolean> || unix: <string> },
remote: { ip: <string>, port: <int> || isSystemUser: <boolean> || unix: <string> },
users : [ { user: <string>, db: <string> }, ... ],
roles: [ { role: <string>, db: <string> }, ... ],
}
Here, the param field is used to add metadata and details of the audited event. In this case, the embedded subdocument contains the ns field, which has a string value with the database name.
In the createCollection audit event, we can audit the creation of a collection or a view. If we create a view, then the param field will contain the aggregation pipeline definition for the view, which is useful if we want to reproduce the view for testing or debugging purposes, as shown in the following code:
{
ns: <database>.<collection || view>,
viewOn: <database>.<collection>,
pipeline: [ <pipeline definition> ]
}
Following on from audit events logging, in the next section, we will learn about audit filters.
Audit filters
By default, MongoDB will record all auditable operations, as detailed in the Audit Event Actions, Details, and Results section of the previously mentioned documentation, in the output stream as per our configuration settings.
We can use audit filters to limit the events that will be audited. The filters can either be applied statically on server startup or dynamically at runtime.
To start our server with audit filters, we can either define them via the command line or through the mongod or mongos config file.
Here is an example of how to set up static audit filters on startup, using the command line:
mongod --auditFilter '{ atype: "authenticate", "param.db": "test" }'
Here is an example using a mongod or mongos config file:
auditLog:
filter: '{ atype: "authenticate", "param.db": "test" }'
Audit filters are useful, even more so if we don’t need to restart our server to edit them. We can enable runtime audit filter editing by starting our server with auditLog.runtimeConfiguration=true and unsetting (not declaring at all) both auditLog.filter and auditAuthorizationSuccess variables.
If either of these two variables is set, then the server will fail to start. The reason for this is that MongoDB cannot decide between using runtimeConfiguration or the configuration provided at startup.
The following examples show how we can use dynamically configured audit filters at runtime.
To edit the auditAuthorizationSuccess variable during runtime, we can issue an admin command directly from the mongosh shell, as follows:
db.adminCommand( { setParameter: 1, auditAuthorizationSuccess: true } )
Similarly, we can edit the auditlog filter with another db.adminCommand() command. Here is an example:
db.adminCommand( { setAuditConfig: 1, filter: { atype: "authenticate", "param.db": "test" } } )
This is the equivalent of the example used in the first part of this section, where we defined audit filters at startup time. These filters are commonly referred to as static audit filters.
Audit guarantee
MongoDB will always write the audit event even before writing to the journal for all operations that affect the database’s durability, such as any document create, update, and delete actions.
Audit events are guaranteed to have the same ordering as their operations for every connection. MongoDB guarantees that every event will be written to disk only after all prior events have been written.
In the next section, we will move from the MongoDB local setup to the auditing setup for MongoDB Atlas, which is the DBaaS offering from MongoDB.
Audit setup in MongoDB Atlas
MongoDB Atlas supports auditing in all dedicated clusters (non-free) from M10 and up.
At the time of writing, serverless instances are still in preview and do not support database auditing.
Enabling auditing in MongoDB Atlas is as simple as enabling the toggle button under Security | Advanced settings.
The following screenshot shows the different users and roles that we can configure to target for auditing:
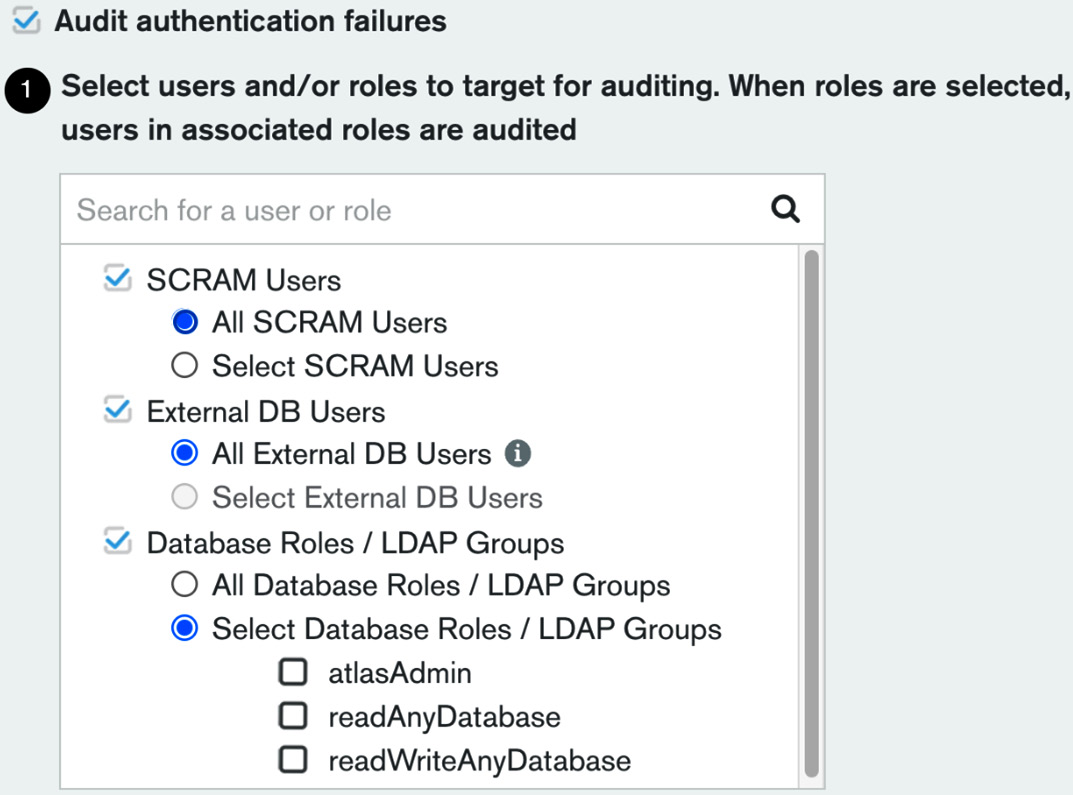
Figure 4.1 – Auditing users in MongoDB Atlas
Auditing can be configured on both a user level and a role level. Selecting a role will implicitly apply our selection to all users that are members of this role.
The list of roles is extensive but most of them are self-explanatory, such as readWriteAnyDatabase.
The following screenshot shows a snippet of the available actions that we can select to audit using MongoDB Atlas:
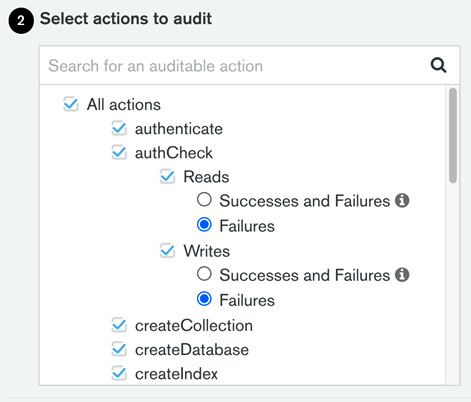
Figure 4.2 – Auditable actions in MongoDB Atlas
Additionally, we can configure auditing per action and audit a limited set of all database operations. The list of database operations that we can include or exclude from auditing logs is as follows:
- authenticate
- authCheck
- createCollection
- createDatabase
- createIndex
- renameCollection
- dropCollection
- dropDatabase
- dropIndex
- createUser
- dropUser
- dropAllUsersFromDatabase
- updateUser
- grantRolesToUser
- revokeRolesFromUser
- createRole
- updateRole
- dropRole
- dropAllRolesFromDatabase
- grantRolesToRole
- revokeRolesFromRole
- grantPrivilegesToRole
- revokePrivilegesFromRole
- enableSharding
- shardCollection
- addShard
- removeShard
- shutdown
- applicationMessage
Most of these preceding commands are self-explanatory.
A slight exception is authcheck. Locally, we need to set auditAuthorizationSuccess to true in order to log successful authorization attempts in the logs. This Boolean value works in conjunction with the authcheck event action.
In MongoDB Atlas, we get four radio buttons to choose from in authcheck. They are mapped to the following four actions:
- authChecksReadFailures
- authChecksReadAll
- authChecksWriteFailures
- authChecksWriteAll
Likewise, in a local deployment, AuthChecksReadAll and authChecksWriteAll will also set auditAuthorizationSuccess to true.
Setting auditAuthorizationSuccess to true applies to both reads and writes. There is no capability to audit reads and writes at a different granularity with regard to auditing successful events.
Important Note
Enabling auditing to log each and every successful login can severely impact performance.
JSON audit filter
The audit filter is the configuration file that specifies which events will be audited. The Graphical User Interface (GUI) driven filter builder is one way to configure MongoDB. The other way is through a JSON configuration file.
This is as simple as clicking on the relevant button:
Figure 4.3 – The custom audit filter button
Clicking on this button will allow us to view the JSON filter that results from our GUI changes. Then, we can edit the JSON file and toggle between the GUI and JSON representations of the filter.
Audit logging access
Audit events can be accessed via logs or a REST API.
A typical audit log line is shown as follows:
{ "atype" : "authCheck", "ts" : { "$date" : "2022-02-10T07:17:44.892+00:00" }, "uuid" : { "$binary" : "isBORpArSUCG4vONSn4Mqw==", "$type" : "04" }, "local" : { "ip" : "192.168.253.134", "port" : 27017 }, "remote" : { "ip" : "192.168.253.134", "port" : 34142 }, "users" : [], "roles" : [], "param" : { "command" : "isMaster", "ns" : "admin", "args" : { "isMaster" : 1, "topologyVersion" : { "processId" : { "$oid" : "6204bc17fcb99d4cac30d5a0" }, "counter" : { "$numberLong" : "3" } }, "maxAwaitTimeMS" : { "$numberLong" : "10000" }, "$db" : "admin", "$readPreference" : { "mode" : "primaryPreferred" } } }, "result" : 0 }
We can download the logs using the GUI from the project’s dashboard page, as follows:

Figure 4.4 – The Download Logs option
Additionally, we can access the logs via the REST API.
To access the logs via the REST API, we need the following four parameters:
- The public API key
- The private API key
- The project ID
- The MongoDB cluster hostname
The public and private API keys are both generated from the Organization | Access Manager page “create API” functionality setting. The private key is only visible once, so we need to make a note of it.
Typically, the project ID is a long hex string, for example, 620173c921b1ab3de3e8e610, which we can retrieve from the Organization | Projects page.
To retrieve the project ID, click on the ellipsis in the project’s row and select Copy Project ID, as shown in the following screenshot:

Figure 4.5 – Use the Copy Project ID option to retrieve the project ID
We are able to retrieve the project’s ID.
Finally, the MongoDB cluster hostname is visible on the Database overview page.
Putting all the preceding steps together, the following curl command will download MongoDB’s audit logs locally:
curl --user '{public_key:private_key}' --digest --header 'Accept: application/gzip' --request GET "https://cloud.mongodb.com/api/atlas/v1.0/groups/{project_id}/clusters/{hostname}/logs/{mongodb_log_filename}" --output "mongodb-audit-log.gz"
The preceding {mongodb_log_filename} placeholder can have any of the following four values. These map to the four available log files in MongoDB Atlas:
- mongodb.gz
- mongos.gz
- mongodb-audit-log.gz
- mongos-audit-log.gz
In the previous sections, we learned about audit setup and configuration in MongoDB Enterprise Edition locally, along with how to use the cloud MongoDB Atlas offering. In the next section, we will put everything into action in a case study using MongoDB Atlas and the MongoDB Command-Line Interface (CLI).
Audit case study
In this section, we will put everything together and present an audit project using MongoDB Atlas and the MongoDB CLI.
MongoDB CLI
The MongoDB CLI allows us to configure Atlas, Cloud Manager, Ops Manager, and IAM operations. In this section, we will use the MongoDB Atlas interface to connect to our Atlas instance.
We can install the MongoDB Atlas tool by following the instructions in the documentation page: https://www.mongodb.com/docs/mongocli/stable/install/ or using the GitHub repo https://github.com/mongodb/mongodb-atlas-cli
We can use the general purpose mongocli or the Atlas specific atlascli.
The next step is to initiate and configure mongocli to authenticate to our cluster:
$ mongocli config
? Public API Key: [public_key]
? Private API Key: [? for help] ************************************
? Choose a default organization: [alex's Org]
? Choose a default project: [audit-project (620173c921b1ab3de3e8e610)]
? Default MongoDB Shell Path: [/usr/local/bin]
You need to change the preceding input values marked with [] (for example, [public_key]) with your own values. Public and private API keys can be fetched from Project | Access manager in the MongoDB Atlas GUI.
The other inputs, namely default organization, default project, and Default MongoDB Shell Path should have the correct default values auto-discovered by MongoDB.
On completing this setup wizard, we will be authenticated into the cluster from the command line.
Important Note
By default, the MongoDB CLI will store the configuration settings in ~/.config/mongocli.toml.
Then, we can access our Atlas cluster from the shell, and we are able to script any interaction with it:
$ mongocli atlas dbusers list
[
{
"databaseName": "admin",
"ldapAuthType": "NONE",
"x509Type": "NONE",
"awsIAMType": "NONE",
"groupId": "620173c921b1ab3de3e8e610",
"roles": [
{
"roleName": "readWriteAnyDatabase",
"databaseName": "admin"
}
],
"scopes": [],
"username": "admin"
}
]
We should then enable access to our database from our IP address. By default, MongoDB Atlas databases are not open to external connections, including the admin IP. To change that, we can address the following command to enable our current IP to connect:
./mongocli atlas accessLists create --currentIp
This should return a result similar to the following:
{
"links": [
{
"rel": "self",
"href": "https://cloud.mongodb.com/api/atlas/v1.0/groups/[groupid]/accessList?pageNum=1u0026itemsPerPage=100"
}
],
"results": [
{
"cidrBlock": "A.B.C.D/32",
"comment": "My IP Address",
"groupId": "620173c921b1ab3de3e8e610",
"ipAddress": "A.B.C.D"
},
],
"totalCount": 1
}
We can create, update, and delete IP blocks that are allowed to connect to MongoDB Atlas and add whole subnets to it.
For example, an entry formatted as 1.2.3.0/24 would allow clients coming from any IP starting with 1.2.3... to connect.
Important Note
The MongoDB CLI will accept singular and plural naming for the same command. For example, both accessList and accessLists will result in invoking the same command.
Mongo shell and audit logs
We should then install the latest mongosh shell, which replaces the old mongo shell. Similar to the MongoDB CLI, we can install it using either Homebrew or by directly downloading the .zip file and adding mongocli to the shell PATH. Let’s get started:
- Once you have installed the mongosh shell, connecting to MongoDB Atlas is as simple as navigating to the Databases dashboard page, clicking on Connect, and then clicking on Connect with the MongoDB Shell.
- We can use the connection string by replacing myFirstDatabase with the default database that we entered in the preceding config file, such as the following:
$ mongosh "mongodb+srv://mdb52-audit.m5mlj.mongodb.net/audit-project" --apiVersion 1 --username admin
Doing this will allow us to access the mongosh shell. It will connect to our cloud MongoDB Atlas instance, and use the audit-project database.
In this audit-project database, we have the contract_signees collection, which includes the contract information metadata between two or more parties. A sample entry looks like this:
{
_id: ObjectId("6207c023a4edd7e2b6855256"),
signees: [ 'alex', 'bob', 'catalina' ],
createdAt: ISODate("2022-02-12T14:11:47.703Z"),
contractId: '101'
}
The contracts collection, which includes contractId and a link to the URL where we have stored the contract body, looks like this:
{
_id: ObjectId("6207c04ea4edd7e2b6855257"),
contractId: '101',
url: 'http://www.example.com/contracts/101'
}
Every operation that interacts with the databases has been logged in the audit logs.
- We can download logs from the MongoDB CLI directly, with the following command:
$ mongocli atlas logs download [hostname] [mongodb.gz || mongos.gz || mongosqld.gz || mongodb-audit-log.gz || mongos-audit-log.gz]
We are interested in audit logs, so will use the mongodb-audit-log.gz parameter.
- To find out the [hostname] value, we can use the process list command, as follows:
$ mongocli atlas process list
- Now, select the hostname value or the userAlias value from the JSON entry with typeName: REPLICA_PRIMARY.
The following code is an example entry for an insert operation:
{ "atype" : "authCheck", "ts" : { "$date" : "2022-02-12T14:11:47.737+00:00" }, "uuid" : { "$binary" : "2jmqHHr3SoirJJ1/KwHk+Q==", "$type" : "04" }, "local" : { "ip" : "192.168.248.220", "port" : 27017 }, "remote" : { "ip" : "XXX", "port" : 60764 }, "users" : [ { "user" : "admin", "db" : "admin" } ], "roles" : [ { "role" : "readWriteAnyDatabase", "db" : "admin" } ], "param" : { "command" : "insert", "ns" : "audit-project.contract_signees", "args" : { "insert" : "contract_signees", "documents" : [ { "signees" : [ "alex", "bob", "catalina" ], "createdAt" : { "$date" : "2022-02-12T14:11:47.703+00:00" }, "contractId" : "101", "_id" : { "$oid" : "6207c023a4edd7e2b6855256" } } ], "ordered" : true, "apiVersion" : "1", "lsid" : { "id" : { "$binary" : "rib46IESTA6HDFCbNUwZew==", "$type" : "04" } }, "txnNumber" : { "$numberLong" : "1" }, "$clusterTime" : { "clusterTime" : { "$timestamp" : { "t" : 1644674769, "i" : 1 } }, "signature" : { "hash" : { "$binary" : "V2BxK73kUbBbObd5o2q3NgbcSXk=", "$type" : "00" }, "keyId" : { "$numberLong" : "7062257678780727301" } } }, "$db" : "audit-project" } }, "result" : 0 }
We can witness the inserted document, in bold, inside the args:{} JSON block.
Additionally, the database and collection names are logged in the ns:{} JSON block using the database.collection name convention, as is our IP, which has been replaced by XXX in this example.
- Since we are logging all operations in our cluster, we can audit and locate an innocuous command such as “read all documents from a collection,” as shown in the following example:
{ "atype" : "authCheck", "ts" : { "$date" : "2022-02-12T14:12:50.773+00:00" }, "uuid" : { "$binary" : "2jmqHHr3SoirJJ1/KwHk+Q==", "$type" : "04" }, "local" : { "ip" : "192.168.248.220", "port" : 27017 }, "remote" : { "ip" : "XXX", "port" : 60764 }, "users" : [ { "user" : "admin", "db" : "admin" } ], "roles" : [ { "role" : "readWriteAnyDatabase", "db" : "admin" } ], "param" : { "command" : "find", "ns" : "audit-project.contract_signees", "args" : { "find" : "contract_signees", "filter" : {}, "apiVersion" : "1", "lsid" : { "id" : { "$binary" : "rib46IESTA6HDFCbNUwZew==", "$type" : "04" } }, "$clusterTime" : { "clusterTime" : { "$timestamp" : { "t" : 1644675168, "i" : 12 } }, "signature" : { "hash" : { "$binary" : "vqfrqgLaEJYczWBXED73lp/sXjE=", "$type" : "00" }, "keyId" : { "$numberLong" : "7062257678780727301" } } }, "$db" : "audit-project" } }, "result" : 0 }
The preceding audit log line refers to a db.getSiblingDB(“audit-project”).contract_signees.find({}) command.
Note
We use getSiblingDB([database-name]) to denote the database name. If we execute use audit-project to connect to the audit-project database, then we can skip the getSiblingDB(“audit-project”) part of the command. The command would then be simplified to db.contract_signees.find({}).
- We can also download audit logs via the REST API using the following command:
curl --user '[public_key]:[private_key]' --digest
--header 'Accept: application/gzip'
--request GET "https://cloud.mongodb.com/api/atlas/v1.0/groups/[project_ID]/clusters/[hostname]/logs/[mongodb.gz || mongos.gz || mongosqld.gz || mongodb-audit-log.gz || mongos-audit-log.gz]" --output [local_filename]
This will download the audit log locally for processing. Additionally, we can set startDate and endDate in the params to download incrementally. Minimum logs granularity is 5 minutes, and that’s the recommended polling interval to download logs.
Note
group and {GROUP-ID} are both synonymous with the project ID. The project ID is a unique non-human friendly string (an example value is 620173c921b1ab3ee3e8e610) that MongoDB assigns to each project. To find the value, we can go to our project’s home page and then to ... | Project Settings, as shown in the following screenshot:
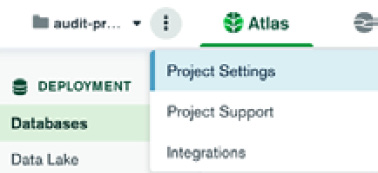
Figure 4.6 – The Project Settings option
- Finally, we can review the database access history from the MongoDB Atlas GUI.
Click on the ellipsis button that is on the right-hand side of our project’s home page, and then click on View Database Access History, as shown in the following screenshot:

Figure 4.7 – Viewing the database
Clicking on the View Database Access History option will get us to a page where we can review audit access requests for the past 7 days by scrolling through them.
Important Note
This page only shows a small subset of all audit logs – the ones that correspond to database access. We need to refer to the Audit logging access section and either download logs or fetch them via the REST API if we need to review all of the operations in the database.
This page is intended as a high-level overview page and not as a substitute for all the other options that we have for accessing and processing audit logs.
Summary
In this chapter, we interrogated the differences between logging and auditing.
Following that, we discussed how to set up auditing, both on-premises using MongoDB Enterprise Edition and in the MongoDB Atlas cloud environment.
Finally, we brought all of the preceding elements together in a case study that uses auditing in the MongoDB Atlas cloud to store, download, and process the audit logs.
We learned how to set up and configure auditing, where it’s useful, and how we can store, download, and process the audit logs.
In the next chapter, we will dive deeper into CRUD using three of the most popular languages for web development: Ruby, Python, and PHP.