
In this example, we will connect the BlinkM to the Raspberry Pi. A BlinkM is an RGB LED that can be connected to your Raspberry Pi via the I2C interface. It is possible to execute light scripts using the port. The connections to the BlinkM are similar to that of the 7-segment backpack.
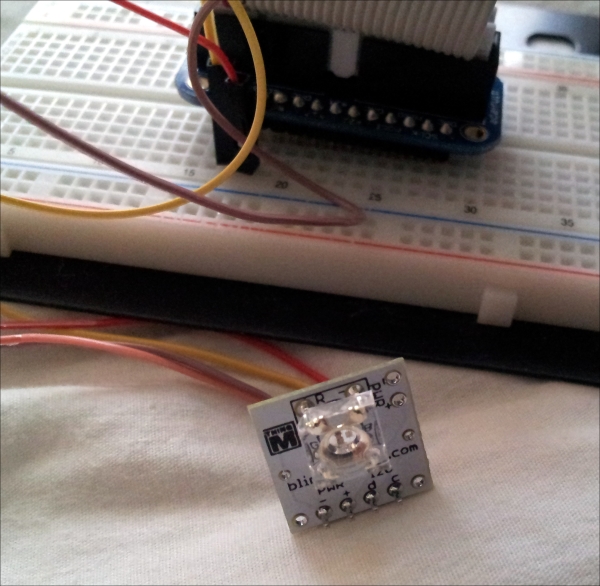
BlinkM connected to the Cobbler
Note
It is important to pay attention while connecting devices to the GPIO header of the Raspberry Pi. If there are devices that draw a lot of current from the GPIO pins, it may reset the Pi or permanently damage it in the event of a short circuit. It is assumed that you are familiar with basic electronics and capable of handling such devices.
Similar to the previous experiment, we need to determine the bus to which the device is connected using the i2cdetect command. As shown in the following screenshot, the device is connected to bus 1 and the device address is 0x09:
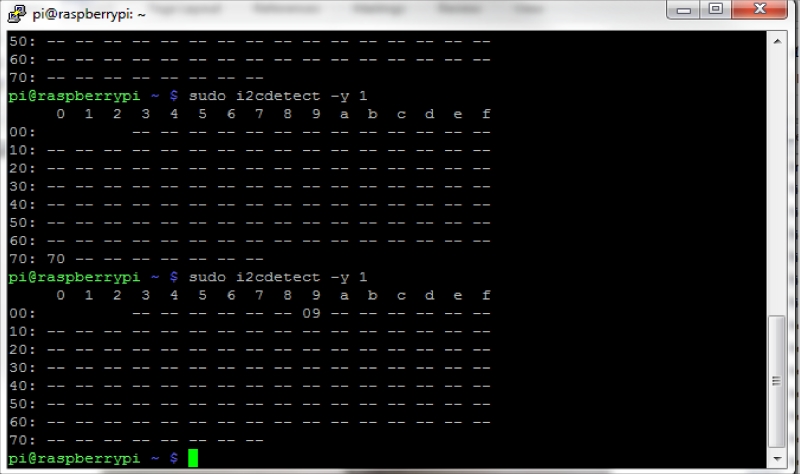
Blinkm connected to bus 1
- The BlinkM datasheet (thingm.com/fileadmin/thingm/downloads/BlinkM_datasheet.pdf) provides step-by-step information to execute the light scripts.
- A list of scripts available on the BlinkM is shown in the following screenshot:
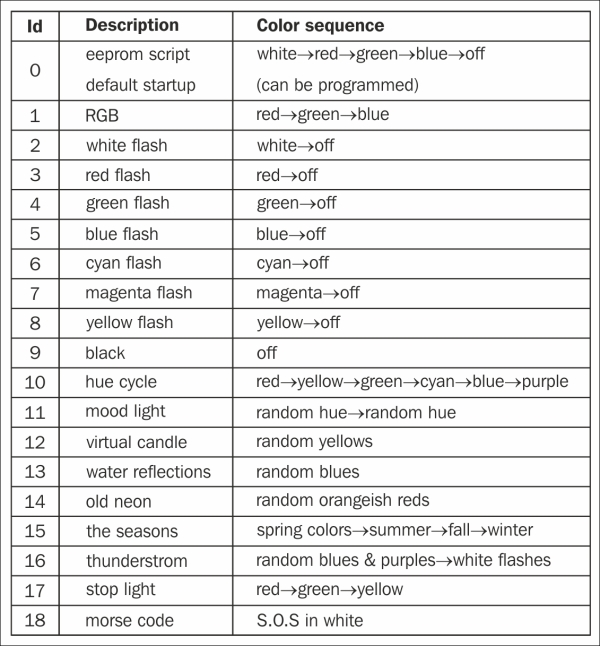
A list of scripts available on the BlinkM
- Let's see the code to execute a light script (for example, script number 6) on the BlinkM using the Adafruit WebIDE interface. In order to execute a script forever, the datasheet mentions that the following characters should be written at the I2C device address in the following sequence:
'p',<script no>,0,0. Let's discuss how to execute this using a Python script on the Raspberry Pi interfaced with the BlinkM LED. The Python script of this example is calledPlay_blinkm.py:- The
Play_blinkm.pyfile can be executed by creating a new file in the repository that was created when you signed up for a Bitbucket account. When the file is saved, the changes are saved to your Bitbucket account. The code for this is given as follows:#!/usr/bin/python #python-smbus import smbus #create i2c object bus = smbus.SMBus(1) #refer to datasheet for script sequence #Play script by writing 0x70 or p on the bus bus.write_byte(0x09,0x70) #play script no:6 bus.write_byte(0x09,0x06) #play the script infinitely bus.write_byte(0x09,0x00) bus.write_byte(0x09,0x00)
- The first line of this code is called shebang. It indicates that the script has to be executed using Python.
- We need to import
python-smbusto execute the light script:import smbus
- We need to create an object for I2C communication. We need to write the control script via bus
1. This is done by the following line of code:bus = smbus.SMBus(1)
- In order to play a script (script number 6 in this case) forever, we write
'p',<script no>,0,0on the I2C bus as follows:bus.write_byte(0x09,0x70) bus.write_byte(0x09,0x06) bus.write_byte(0x09,0x00) bus.write_byte(0x09,0x00)
- The
- This would cause the BlinkM to execute script number 6 as long as the device is powered and until another instruction has been issued to the device through the I2C interface.
- Now, it is possible to debug our program by executing it step by step. This helps identify any problems with the program. Let's review some options to debug a program. We can launch the program for troubleshooting/debugging by clicking on Debug.

The Adafruit WebIDE toolbar
- This opens up two consoles, Debug Output and Debug Variables (shown in the following screenshot). The window Debug Output prints any output of the program. If we included any print statements in our program, the output is displayed in this window. This window can be used to view any results, ensure that a particular callback function was executed, or determine whether the program execution got past a particular line of the program.
- The Debug Variables window displays the state of variables as the program is being executed. Both the windows are helpful in determining whether a Python script was written as intended.
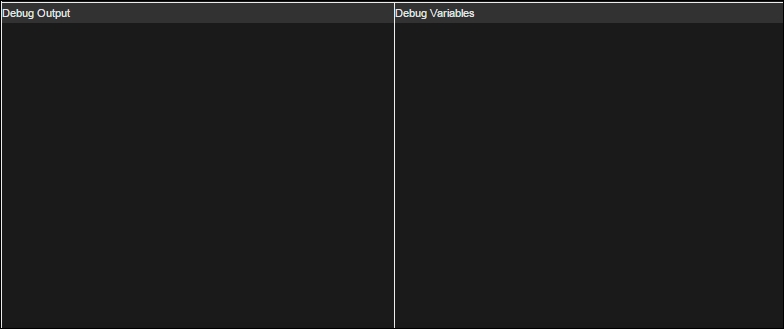
Debug terminals
- When we start debugging a Python script, the toolbar at the top presents us with two options, namely Step Over and Step In, as shown in the following screenshot:

The Adafruit debug toolbar
- In this example, it is possible to test the execution of commands by stepping through each line of the script. This is really useful when devices (for example, a pressure sensor) are not providing the intended output to identify the root cause.