
Systems biomedical science
Abstract:
Cells seldom live in isolation. They constantly interact with ambient cells and the environment. Many conventional studies have focused on particular molecular activities taking place within cells, which are cultured in artificial environments, so the rich interaction between the cells and their natural environment is unexplored. To acquire a more complete picture, systematic investigation of all cellular activities in different environmental settings would be valuable. With three distinct omics (genomics, transcriptomics and proteomics), we will see how new insights into human biology can be approached by systematic hypothesis generation and panoramic, multi-scale data filtering, integration and modeling. Systems biomedical science is an iteration of bottom-up and top-down investigations. Individual systems are simulated jointly for their emergent collective behavior. Case studies include whole cell modeling, synchronization and phase locking models of cell cycles, essential genes for the normal operation of cell cycles, and the hourglass model for embryonic development in many species.
5.1 Introduction
Since the dawn of history, the continuing pursuit of medical knowledge has created modern medicine, comprising an arsenal of diagnostic and treatment methods against many diseases. Looking back, tremendous advances in medical technology have been made. Looking ahead, many illnesses still remain poorly treated or even untreatable; to name a few, the acquired immune deficiency syndrome (AIDS) and many late-stage cancers. The limitations of modern medicine reflect our still incomplete and fragmented understanding of human biology, physiology, pathology and pharmacology, as well as the interaction with resident and environment microbes. Extending the frontier of knowledge not only requires time, but also a new way of thinking, which is the main topic of this chapter.
Conventional studies have three major problems:
1. Over simplification: scientists often pursue simple systems with few types of molecules (or genes). Albeit existent, the effect of these molecules on the whole physical system may be trivial.
2. Isolation: many biomedical studies are conducted using cell lines or laboratory animals under strictly controlled experimental conditions. This may not represent real biological behaviors.
3. Narrow range: a human study such as the phase-three clinical trial may demonstrate the drug effect and safety in a fixed dose, on patients of a particular age range or ethnic origins. This is akin to examining a cross-section of the entire universe of possibility, or a tip of the iceberg. Conclusions obtained this way often cannot be generalized in a straightforward manner, unless all the other scenarios have been meticulously examined.
The history of biomedical discovery is thus analogous to a group of blind people trying to describe an elephant based on their limited contact experiences.
Complexity and non-linearity are two major hurdles hindering a full comprehension of human biology. Non-linearity means that the joint effect of two elements exceeds or deviates from the linear combination of individual effects in isolation. Real biological systems are often nonlinear, with multiple layers of information tangled together in a complex way. We are more familiar with the linear, logical reasoning of cause and effect, which has shown its strengths in previous studies. Yet, simple cause and effect relationships only exist in small, isolated systems involving only a few types of molecules.
Thus, a major direction of future biomedical science is in viewing the larger picture and relaxing the restrictions posted by conventional thinking. We have seen an unprecedented opportunity to systematically explore the molecular basis of human biology by high throughput “omics” technologies. Naturally, deep data of multiple biological conditions contribute to the broad applicability of the derived empirical rules, with one caveat that novel insights are buried in the deluge of data. To decrease the overload of information, adaptive bottom-up and top-down processes become inevitable. Allowing the data to speak for themselves, the nonlinear connection of biological entities and phenotypes may gradually arise from seemingly chaotic data, therefore rendering novel insights.
Systems biomedical science (SBMS) represents a new way of investigation. Rather than focusing on oversimplified, isolated and narrow mechanisms, SBMS features adaptive exploration of complex issues from multiple angles. A panoramic view is enabled by a systematic interpretation of a broad spectrum of data. The goal is to reveal novel, terse, universal, high-quality and general rules for future empirical validation. This way, biomedical science can ascend to the next level. Genomics, transcriptomics and proteomics technology all have their individual strengths and limitations. In Chapters 2 to 4 we have explored how to conduct a joint analysis from multiple types of data (i.e. systems level analysis). This chapter will further formalize systems level analysis involving multiple systems.
5.1.1 Systems: Across conventional boundaries
The term “system” is prevailingly used in the field of engineering, referring to a set of connected and confined mechanical components which can operate together. A system usually has a defined boundary, with inputs and outputs from and to the environment. In SBMS, a system has two definitions:
1. a multifunctional biological entity; and
2. a collection of the same type of entities, which can interact with each other.
In such a framework, an iterative definition is allowed that one system may comprise other (sub) systems. This is suitable for the modeling of the human body, which comprises hierarchical layers of biological entities: the molecular, cellular, tissue, organ and physiological layers. A layer (which is a system by definition 2) has multiple composition entities (which are also systems by definition 1), each with complex interactions with other entities in the same layer. For example, a tissue (a layer) comprises many cells (biological entities). SBMS addresses a collection of individual systems interacting together. Composite entities have shared property as well as their individuality. For example, cells of the same type all have cell cycles, each with a slightly different frequency and phase. A layer is featured by the collective behavior of composite entities. The organization of layers enables the investigation to be first focused on one single layer, thereby reducing the difficulties in understanding the complex integral at once. For example, a phenotype (i.e. a disease) often manifests characteristics (symptoms) in multiple layers. Ultimately, SMBS requires working across conventional boundaries and layer definitions.
5.1.2 A two way approach of top-down plus adaptive bottom-up
We define SBMS as the activity and result of adaptive bottom-up and top-down investigations. Empirical data represent the bottom layer, offering the source material for reasoning. The bottom-up approach is to gradually stitch together pieces of heterogeneous data and composition entity models with increasing abstraction and generalization, until a global integral is achieved. It is important to let the data speak for themselves, with the help of adaptive computational models, and observe carefully the non-linear, collective effects emerging from the interaction of systems. This is nicely addressed by the classic essay “More is Different” by the physicist P.W. Anderson (1972).
Thus, a purely “automatic”, bottom-up approach has three limitations:
1. It cannot make an extrapolation of data beyond its original scope, and an interpolation within the data resolution. A higher level “abstraction” and “generalization” requires human inference and domain knowledge.
2. The genomic data of various levels are usually very noisy within which the true biological signals are buried. Data filtering and integration are required to isolate the true picture from background noise (Ideker et al., 2011). Adequate filtering and integration depend on domain knowledge on the characteristics (strengths and limitations) of the data, as well as on the underlying biological effect.
3. Human biology is complex and the enumeration of molecular interactions in different time and place is infinite.
Hence, a high-level conceptual framework is critical to put the diverse data into perspective. As mentioned in Chapter 1, general or specific challenges during biomedical investigations can often be ascribed to inverse problems, requiring top-down assumptions and conceptual frameworks to reach solutions.
5.2 Cell level technology and resources at a glance
Cell-level technologies are critical for deep phenotyping, an important augmentation to molecular-level assays, which excel at deep genotyping. The combination of both offers a powerful technique to render a global picture. Cell-level assays are often based on antibodies. Flow cytometry and time-lapse microscopy are two examples. Flow cytometry can perform cell sorting, to sort and count cells suspended in liquids according to their surface markers (i.e. cell membrane proteins). It is widely used in immune related topics, which need to analyze cells with or without particular surface markers such as CD4 and CD8. Time-lapse microscopy refers to the technique of stacking sequential images of multiple sampling points in time into a fast video (Beltman et al., 2009). It offers a valuable time component. Cells are usually stained with fluorescent tags targeting the protein of interest. The fluorescent signals in the image stack can be analyzed computationally.
5.2.1 Essential genes for cell cycles by time-lapsed microscopy
The control of the phase transition of cell cycles is performed by genes such as cyclins and cyclin-dependent kinases. However, they are not the only players. To find all cell cycle genes systematically, Neumann et al. (2010) employed a RNA interference method to knock down the known 21,000 protein coding genes one by one, and observe the cell behavior for two days using time-l apse microscopy. Human Hela cells were employed for this experiment. The histone 2B proteins were tagged with green fluorescent proteins to show the chromosomes. Computational image analysis was employed to classify various abnormalities of cell cycles. About 500 to 1000 genes were identified as the critical genes related to cell cycle functions. The data represent a valuable source of information, which has been made available on the Mitocheck website.
5.3 Conceptual frameworks from top-down
The top-down approach is the effective use of domain knowledge, organized in the form of conceptual frameworks, to direct research, to make abstractions and inferences, and also to guide data filtering and analysis. The importance of the conceptual framework escalates as the number of systems increases. Linnaeus’s catalog of species is an example of a conceptual framework in biodiversity studies. In biomedical studies, conceptual frameworks on molecular mechanism and human physiology and pathology are particularly important to put fragmented knowledge into perspective, thereby revealing the essence of matter. Examples of conceptual frameworks include the Th1–Th2 balance for human immunology, the natural history of hepatitis B infection, and the hallmarks of cancer introduced below. Needless to say, the conceptual framework needs to be consistent with observation and empirical data. Furthermore, all conceptual frameworks have exceptions.
5.3.1 Hallmarks of cancer: a conceptual framework
The hallmarks of cancer are an excellent example of a conceptual framework. It was first conceptualized (Hanahan and Weinberg, 2000) by six major hallmarks, then further augmented into ten hallmarks based on accumulating evidence (Hanahan and Weinberg, 2011). The six major hallmarks are:
2. growth suppressor inhibition;
6. invasion and metastasis (Hanahan and Weinberg, 2000).
These hallmarks are largely caused by the endogenous molecular machinery of cells activated in the wrong place at the wrong time. These hallmarks also present in the progressive stages of the disease. The first hallmark is caused by oncogenic EGFR and Her2, which abnormally induce proliferative signals, then activate two downstream pathways, one with the PI3K, Akt and PKB genes and the other with the RAS and MAPK genes. These oncogenes sustain a mitogenic, proliferative signaling in the cancer cells, accompanied by the malfunction of the endogenous inhibitory signals, such as PTEN, along the same route. The second hallmark is caused by malfunctions of endogenous tumor suppressor genes, such as RB and TP53. The third hallmark is caused by malfunctions of genes in the intrinsic and extrinsic apoptosis pathways. The fourth hallmark is closely related to attrition of the telomere (the two ends of chromosomes), which is caused by the fast proliferation of cancer cells. This can cause chromosome end-to-end junction, a mechanism for cancer to acquire more growth promoting mutations. As the disease progresses, telomerase becomes over-expressed, which elongates the length of the telomere, enabling it to continue replication infinitely. Two more hallmarks, genome instability and inflammation, were further proposed to be two underlying contributors of cancer (Hanahan and Weinberg, 2011). The reprogramming of energy metabolism and the evading of immune destruction were further considered as two emerging hallmarks (Hanahan and Weinberg, 2011).
The hallmarks of cancer offer invaluable guidance for future cancer-related research. Chapter 2 reported that a vast amount of somatic mutations has been found recently in tumor tissues. The mutations have complex patterns that vary among cancer types, disease stages, and even individual patients. This poses a serious challenge for distinguishing driver mutations (which play major roles in various stages of the disease) from passenger mutations. Furthermore, we may easily get lost in the large number of mutations and overlook important clues to useful knowledge. A conceptual framework can categorize the detected mutations into hallmarks, representing various stages of disease progression.
This conceptual framework was a result of prior top-down and bottom-up investigations. The individual evidence was accumulated empirically bottom-up and gradually connected into an integral. The global framework was gradually conceived top-down. The established conceptual framework offers both a functional scale and a timescale for the comprehension and treatment of this complex disease. The stages of cancer are now signified by distinctive hallmarks (Hanahan and Weinberg, 2011). The advanced stage of cancer usually manifests as the hallmark of metastasis, which often makes the disease intractable. Advanced cancerous cells can metastasize from one site to another, either through the bloodstream or through the lymph system. Cancer cells need to alter the surface property so as to enhance its invasion capability. Also, the metastatic cell needs to overcome an exotic, aquatic micro-environment with different osmotic pressure, when they enter the bloodstream. This could be a moment when these cells are vulnerable to attack if they are not yet prepared for such an environment. As a result, from a systematic point of view, metastatic cells are good therapeutic targets for late stage cancer.
5.4 Systems construction from bottom-up and top-down
5.4.1 SBMS data preprocessing: Integrators and filters
As was introduced briefly in Chapter 3, data filtering and integration are important analysis skills for modern omics data (Ideker et al., 2011). The integrators and filters are common signal processors in the engineering field. Here, it means the effective use of domain knowledge to filter the data of unnecessary complexity and to integrate data from heterogeneous sources.
5.4.2 Physiological and disease modeling
To fully characterize a system, two layers of information are required:
1. the system’s static architecture in terms of the topology of networks;
2. the dynamical and collaborative behavior of the composition entities.
Mathematical equations are often used to describe quantitatively the internal and external characteristics of the systems. The closeness of predicted values to real values can be used to gauge whether a mathematical model adequately captures the essence of a biological system (Hartwell et al., 1999). Isolating the system from environmental effects, mathematically equivalent to setting all external variables to 0, is a common trick to focus only on the internal activities for easier comprehension. However, this approach may lose authenticity in the modeling of many biological systems, which are highly entangled with each other and manifest collective behaviors. Only a full appreciation of all layers can illustrate the complete picture of a complex system.
To model human physiology in health and disease and reveal important internal, unobserved variables is a major goal of SBMS. Such attempts are exemplified by the projects of Physiome and CancerSys, which model multiple organs such as the heart and liver.
It has been known that the sizes and numbers of first diagnosed primary and metastatic tumors inversely correlate with the patients’ survival time. In theory, the value of the genomic mutation rate and of the metastasis rate determines the survival time. The two values cannot be directly measured, so they need to be estimated by observable parameters such as tumor sizes and growth rates. Considering a diseased person as a system, the genomic (metastatic) mutation rate and the metastasis rate are two internal variables of this system. A recent report by Haeno et al. (2012) showed the modeling of the cancer metastasis by a series of observable and internal parameters. The clinical data of 228 pancreatic cancer patients were used; 101 of them had autopsies, which offered critical numbers and sizes of metastatic sites. The models were then used to depict the survival distribution of an independent cohort (Figure 5.1).
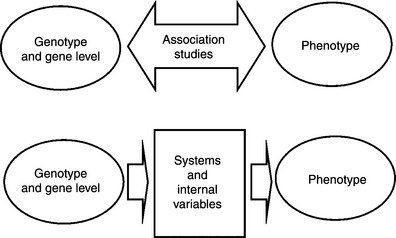
Figure 5.1 A schematic diagram of SBMS compared with association studies. Top: the association studies intend to find genes whose genotype or expression levels are associated with clinical phenotypes. Bottom: SBMS also intend to explain the clinical phenotypes, with observable genotypes and gene levels and internal variables estimated by systems modeling
5.4.3 Modeling and simulation of collective behavior
Apart from the modeling illustrated in the previous section, bottom-up modeling and simulation is useful for depicting the collective behavior of multiple systems in various spatial and temporal scales. A group of systems may manifest self-organizing capabilities. In an abstract illustration, a system is often depicted by a box with input and output signals (external variables) depicted by external arrows pointing toward and away from the boxes. Systems also have internal variables. The systems can also be modeled as depicted in the following pseudo code:
5.4.4 Static characteristics of a system
In a confined system, the relationship between the composition entities can be represented as networks. Networks can be represented by two mathematically equivalent tools, the adjacent matrices and graphs (Barabási and Oltvai, 2004). An adjacent matrix is a square matrix where the rows and columns both represent the composition entities. The entries of the matrix could be binary, representing either connected (1) or unconnected (0). They could also be quantitative to represent the strength of connection, and the adjacent matrix is called the “weighted” matrix.
The topological properties of a network can be characterized by the various distributions of the node (the vertex) and the link (the edge), including:
Degree distribution
A degree (denoted as k) refers to the number of links associated with a node. The degree distribution, or histogram, is the counts of nodes with respect to various degrees N(k). A degree distribution can also be shown as P(k), where the percentage of nodes is shown instead of the counts of nodes, simply by dividing all the counts with the total number of nodes in the network.
Average clustering coefficient
An average clustering coefficient C(k) indicates how tightly the nodes are linked to each other, for nodes with degrees k. For any given node, the clustering coefficient is the number of true links among its adjacent nodes, divided by the number of all possible pairwise links within a subset of nodes (Barabási and Oltvai, 2004).
The topological properties can characterize a biological network. The first typical network is a random network, where nodes are randomly joined by links.
The degree distribution P(k) of a random network usually follows a Poisson distribution. However, a scale-free network has the property that P(k) follows the power law approximately, where the logged P(k) linearly decreases as the logged degree (k) increases, manifesting as a straight line on a log-l og plot. A hierarchical network is a special type of scale-free network commonly found in biological networks, where both P(k) and C(k) follows a power law.
5.4.5 Dynamic characteristics of a system
A living cell can switch between homeostasis states and transient states. Homeostasis states are essential for regular activities of the biological system. The transient states are often triggered by various extracellular stimuli such as endocrine hormones. A sequence of transient cell signaling and gene expression characterizes the transition states. It is thus essential to capture both the homeostatic and dynamic states of the cells in addition to the global topology of the network. The dynamic simulation known as flux analysis can be conducted in both the continuous and discrete domains with various degrees of granularity, most of which requires high-quality data with high time and space resolution for authentic modeling.
Differential equations are major tools of continuous domain simulation, where the concentration of particular receptors, ligands, enzymes or metabolites is modeled by the equations at various spatial and temporal scales. The use of simultaneous equations can capture the collective behavior of the composition entities. However, this approach usually results in too many equations to strenuously capture various interactions of composition entities behind the biomedical phenomena. Solving these equations is computationally expensive. One strategy to avoid the complexity of the whole system is to simulate the behavior of network motifs, such as various feedforward and feedback loops (Mangan and Alon, 2003; Burrill and Silver, 2010). It has been shown that the feedback motif can generate important biological properties such as the bistable (0 and 1) states (Farrell, 2008). Furthermore, a differential network strategy was proposed to focus the simulation of network behavior on the genes which show difference (obtained from contrast-level analysis) rather than simulating the entire set of entities (Peer and Hacohen, 2011).
One other approach is to employ higher level models when the collective behavior of systems is modeled. These systems (i.e. cells) are distinct entities but they share similar properties (i.e. a similar frequency of cell cycles). For example, the combination of Pott’s model and Metropolis algorithm have been used to simulate cell sorting (Graner and Glazier, 2011), morphogenesis (Izaquirre et al., 2004), the behavior of malignant tumors (Pennacchietti et al., 2003) and the Tamoxifen treatment failure of cancer (Plank and Sleeman, 2003). The employment of Kuramoto models and their variants has been used to model the synchronization of cell cycles of unicellular phytoplankton organisms (Massie et al., 2010). This is a good example of emergence of collaborative behaviors from simple rules, particularly as synchronization is a prevailing characteristic of many biological systems.
Other choices of tools include discrete domain simulation such as petri nets and cellular automata, which can present the dynamic behavior with certain degrees of abstraction. Cellular automata are based on a spatiotemporal discrete lattice, therefore suitable for modeling of spatial information. The analysis of collective behavior of multiple self-organizing systems has been investigated under the framework of swarm intelligence.
Occasionally, two or more different types of cells are modeled. The attack of immune cells on tumor cells, and the counter-attack, require both cells to be modeled in order to illustrate the complex interaction.
Multi-scale simulations have been attempted to elucidate the multi-scale nature of biomedical phenomena, in such a way that a coarser scale simulates cell–cell interactions, while the other scale simulates molecular activities within cells. Abstract data structures, such as the quadtree structure of multiple layers, are 2-D spatial grids. Activities on the two scales may take place at different paces (timescales).
Recent evidence suggests that even in meticulously controlled experimental conditions in a laboratory, a degree of randomness and variation (or noise) was still observed (Raj et al., 2010). Noise has been perceived as one driving force of a biological phenomenon (Eldar and Elowitz, 2010), therefore, in addition to the simulation using deterministic equations and modeling techniques, we may add a stochastic component to authentically present a biological fact.
5.4.6 Cell simulation frameworks
The E cell and virtual cell focus on the molecular and biochemical level within cells, addressing the dynamics of signal transduction, regulatory and metabolic networks. The sub-cell compartmental model is constructed and integrated gradually, so as to simulate a particular facet of cells. The Epitheliome project is an example of tissue-level simulation, aiming to depict the epithelial cell growth and the social behavior of cells in culture. The different scales of simulation can shed light on different aspects of life.
5.5 Specific directions of systems biomedical science
5.5.1 Human microbiome, metagenomics and viral host interactions
The first example of SBMS is to investigate the human genome and microbiome together to understand their interactions on human health status. Our body is intimately influenced by external and internal environments with many residential microbial organisms. Counting virus, bacteria, archaea and fungi all together, approximately 100 trillion microorganisms live inside the human body with a total of 100-fold more than humans (Ley et al., 2006; Qin et al., 2010; Arumugam et al., 2011). They are commensal, neutral or even pathogenic to human health, and the effects are mostly elusive. Evidence shows that inflammatory diseases, such as Crohn’s disease and ulcerative colitis, are caused by pathogenic host and microbial interactions (Virgin and Todd, 2011). Crohn’s disease is a consequence of concurrent risk factors on host gene variants, viral infections, toxins and commensal bacteria (Cadwell et al., 2010). It is thus very important to put microbial organisms into perspective, with about the same weight as the human genome.
Metagenomics is the concurrent analysis of multiple genomes. One typical example is the use of NGS for the study of multiple organisms in a specific field environment such as sea water and ground soil. This approach would also be very useful for biomedical study on the interactions of pathogens, residential microbials and the human body. This approach has already rendered insights into, for example, the gut microbiome by ways of analyzing human fecal samples (Arumugam et al., 2011; Qin et al., 2010). In contrast to traditional capillary sequencing, where cell isolation and culture are important steps in the protocol, the metagenomic approach directly collects samples, conducts shotgun sequencing of all organisms simultaneously, and then analyzes the gene contents (and abundance) as a whole. Often the first goal is to get a snapshot of the entire gene pool, followed by the assembly of individual genomes as the second goal. Tools and database resources are in great demand in this fast moving field.
Infectious diseases remain major challenges to human health. Genomic information of pathogens such as the virus or bacteria are valuable for the understanding of their interaction with the host. Assays on the pathogen genome can help us to identify the sub-strain of pathogens. Many viral and bacterial mutations are also shown to be responsible for drug resistance. This genomic information could contribute to better management of pathogen induced diseases. For example, many mutations in the pre-S or pre-core regions of the hepatitis B viral genome have been shown to be positively associated to the occurrence of host liver fibrosis/cirrhosis and even liver cancer. Mutations in the S protein may cause resistance to the antiviral drug Lamivudine. Hence, the detection of these mutations could represent a change of medication for better therapeutic effects.
5.5.2 Molecular model of embryo development
The development of an embryo (i.e. ontogeny) and the evolution of species (i.e. phylogeny) are two separate fields of study, which share ambiguous yet intricate connections. It has long been observed that during a special period of animal embryonic development, called the “phylotypic” stage, the morphologies and anatomies of distinct species appear very similar (Prudhomme and Gompel, 2010; Domazet-Lošo and Tautz, 2010; Kalinka et al., 2010). This morphological resemblance (and divergence) among species during embryonic development has been described by an hourglass analogy: the high resemblance (low variety) in the phylotypic stage is shown as the middle, narrow part of an hourglass; the high divergence in the beginning and late stage of embryonic development is shown as the wide parts. Such an analogy has remained a subjective, phenotypic description for years.
Molecular evidence for the hourglass model of development has only been established recently (Prudhomme and Gompel, 2010; Domazet-Lošo and Tautz, 2010; Kalinka et al., 2010). Domazet-Lošo and Tautz (2010) conducted a joint genome-wide DNA, RNA and protein level analysis across species, fitting into our definition of systems level analysis. It also featured a development scale time course analysis. First, transcriptomics profiles were measured during different stages of zebrafish development, including embryo, larva, juvenile to adult stages. This was done by quantitative measurements of all transcribed RNAs using Agilent microarrays every two hours, a very fine-grained series of time points.
Second, a phylogeny of 14 evolutionary stages was constructed, starting from the unicellular organism to the zebrafish. Each stage was represented by full genomic (DNA) sequences of one or more species supplemented by the RNA level expressed sequence tag (EST) data. The main purpose of this phylogeny is to provide a time index corresponding to the stages, where 1 represents the first stage of the origin of cell, and 14 represents the last stage of the zebrafish.
Third, the time index of each gene of the zebrafish was traced back, based on protein sequence homology to earlier species in phylogeny. The revised time index represents the first emergence of a gene in phylogeny. The smaller the index, the earlier the emergence of this gene in time.
Fourth, the authors defined a phylogenetic time index for each embryo developmental stage, called the transcriptome age index (TAI). It is basically a weighted average of time index of all genes by their expression levels. When plotting the TAI with respect to the developmental stages, the curve actually resembles the hourglass model, with the valley of the curve occurring at the embryonic segmentation stage (~ 23 hours after fertilization). This shows that the phylotypic stage expresses the oldest gene set, conserved across species, to possibly dictate the body plan of development.
It is interesting that the authors stopped here after the joint analysis of DNA, RNA and protein information. One way to continue this project is to conduct the module level annotation of the genes in the phylotypic stage by enrichment analysis (Section 3.4 in Chapter 3). In this way, they could further confirm whether the genes at this stage actually play pivotal roles for body plans of development, inspired by the success of the molecular hourglass model.
5.5.3 Diseases grouping, subtyping and interactions
Optimum medical intervention relies on a systematic approach, featuring a balanced consideration of all human physiology, pathology and the molecular basis of disease. This is a basic requirement a physician needs to make a treatment decision based on the current best knowledge. Nevertheless, systems level consideration still has room for improvement, primarily due to insufficient knowledge. For example, several diabetic drugs on the market are designed to stimulate the patients’ pancreas to secrete more insulin, thereby increasing the absorption and utilization of blood sugar by muscle and liver cells. However, over-stimulation of the pancreas may result in an elevated risk of pancreatic cancer in the long term (Currie et al., 2009). For Type 2 diabetes patients, whose main problem is the reduced sensitivity of muscle and liver cells to insulin (i.e. insulin resistance), then insulin stimulating drugs may not be adequate. Rather, insulin sensitizers may be a better class of drugs for these particular patients by targeting the real problem.
Conventionally, a disease is often investigated as an isolated system with its distinct diagnosis and treatment strategies. Meanwhile, it has long been observed that many diseases have shared etiology and risk factors, which may reflect their tangled underlying mechanisms. Epidemiological data shows that obesity elevates the risk of diabetes, which in turn elevates the risk of vascular complications such as nephropathy, retinopathy, diabetic foot, and most worrisome, coronary artery disease or heart attack. These diseases, together with other clustered symptoms such as hypertension, has been discussed under the general conceptual framework of metabolic syndrome (Reaven, 1988, 1993, 2005; Taniguchi et al., 2006). Insulin resistance is hypothesized as a shared etiology of phenotypes ascribed to metabolic syndrome, providing insight into the whole picture. Adding to this complexity is the fact that there are diabetes patients who are not obese and there are cardiovascular patients who have no trace of diabetes. Thus, a subtyping of conventional disease definition may also be required.
Box 5.1 Useful bioinformatics tools and resources for systems biomedical science
A Data Visualization with graphs
Cytoscape is a free software platform dedicated to network analysis and visualization. The basis of the platform offers a convenient way to construct networks and graphs. On top of the base, many plug-in applications have been constructed, offering a spectrum of toolkits such as BiNGO and PiNGO for graphical gene ontology annotation.
The prevention of a disease and the medical care of patients also require the whole picture of disease subtypes and their interactions. Disease grouping and subtyping can be sustained by molecular evidences. For example, mutations in the low density lipoprotein receptor (LDLR) gene may elevate the risks of both the familial hypercholesterolemia and coronary atherosclerotic heart disease, the former of which is thought to be a rare, familial disease while the latter the common complex disease (Lupski et al., 2011). There is new thinking on globally pictured “disease systems”, which either divides a conventional disease into many subtypes, or merges many diseases into a larger system (Virgin and Todd, 2011).
5.6 Case studies
5.6.1 The omics of one person predicts the onset of T2D
Chen et al. (2012) have explored the idea of prospectively collecting extensive time course, various omics data from a single person, Snyder, who is also the senior author of the published work. A spectrum of genomics, transcriptomics, proteomics and metabolomics was collected together with basic physiological parameters (i.e. weight) and biochemistry measurements (i.e. HbalC).
5.6.2 The phase-locking model of cell cycles
Cell cycles are endogenous, rhythmic processes of living cells. By going through a cycle, a cell divides into two daughter cells. A cell cycle comprises distinct phases, Gl, S, G2 and M, where the S phase represents the process of chromosomal duplication and the M phase represents cell division. G1 and G2 are intermediate steps toward S and M, respectively. The progression of the cell cycle has long been depicted as one large mechanistic ratchet model, where a rigid control and checkpoints of the progression of phases are in place, because the next phase cannot be activated until the previous phase is fully completed. However, this perception has not been fully validated.
Lu and Cross (2010) proposed an alternative model where the cell cycle is a synchronization of multiple molecular cycles, which are gradually emerging independently in evolution history. Synchronization is achieved by the phase-locking of these cycles, manifesting a coherent state-switching behavior. To demonstrate this concept, Lu and Cross designed a series of experiments and de-coupled the molecular links between different molecular cycles in yeast cells. Each molecular cycle then demonstrated a unique cycling frequency and became out of phase with the main cycle.
The phase-locking model offers a conceptual level insight on how the system of a cell operates mechanically. In the future, we may be able to classify genes into modules according to molecular cycles, and identify genes as “hinges” based on their molecular roles in the synchronization of two molecular cycles.
5.7 Take home messages
![]() Advancement of biomedical science requires thinking outside the box and crossing conventional boundaries.
Advancement of biomedical science requires thinking outside the box and crossing conventional boundaries.
![]() Internal variables of a modeling system can be used to indicate internal states, thereby inferring a dynamic phenotype.
Internal variables of a modeling system can be used to indicate internal states, thereby inferring a dynamic phenotype.
![]() Conceptual frameworks such as the hallmarks of cancer can offer a top-down panoramic view of the problems and also guide data analysis.
Conceptual frameworks such as the hallmarks of cancer can offer a top-down panoramic view of the problems and also guide data analysis.
![]() Adaptive models, such as agent based modeling or swarm intelligence, can be used to simulate emerging effects from bottom-up.
Adaptive models, such as agent based modeling or swarm intelligence, can be used to simulate emerging effects from bottom-up.
![]() Filters and integrators are useful for distilling valuable knowledge from a deluge of data.
Filters and integrators are useful for distilling valuable knowledge from a deluge of data.
5.8 References
Anderson, P.W. More is different. Science, New Series. 1972; 177(4047):393–396.
Arumugam, M., Raes, J., Pelletier, E., et al. Enterotypes of the human gut microbiome. Nature. 2011; 473(7346):174–180.
Barabási, A.L., Oltvai, Z.N. Network biology: understanding the cell’s functional organization. Nat. Rev. Genet. 2004; 5(2):101–113.
Beltman, J.B., Marée, A.F., de Boer, R.J. Analysing immune cell migration. Nat. Rev. Immunol. 2009; 9(11):789–798.
Burrill, D.R., Silver, P.A. Making cellular memories. Cell. 2010; 140:13–18.
Cadwell, K., et al. Virus-plus-susceptibility gene interaction determines Crohn’s disease gene Atg16L1 phenotypes in intestine. Cell. 2010; 141(7):1135–1145.
Chen, R., Mias, G.I., Li-Pook-Than, J., et al. Personal omics profiling reveals dynamic molecular and medical phenotypes. Cell. 2012; 148(6):1293–1307.
Currie, C.J., Poole, C.D., Gale, E.A. The influence of glucose-lowering therapies on cancer risk in Type 2 diabetes. Diabetologia. 2009; 52(9):1766–1777.
Domazet-Lošo, T., Tautz, D. A phylogenetically based transcriptome age index mirrors ontogenetic divergence patterns. Nature. 2010; 468(7325):815–818.
Eldar, A., Elowitz, M.B. Functional roles for noise in genetic circuits. Nature. 2010; 467(7312):167–173.
Ferrell, J.E., Jr. Feedback regulation of opposing enzymes generates robust, all-or-none bistable responses. Curr. Biol. 2008; 18(6):R244–R245.
Graner, F., Glazier, J.A. Simulation of biological cell sorting using a two-dimensional extended Potts model. Phys. Rev. Lett. 2011; 86:4492–4495.
Haeno, H., Gonen, M., Davis, M.B., Herman, J.M., Iacobuzio-Donahue, C.A., Michor, F. Computational modeling of pancreatic cancer reveals kinetics of metastasis suggesting optimum treatment strategies. Cell. 2012; 148(1–2):362–375.
Hanahan, D., Weinberg, R.A. The hallmarks of cancer. Cell. 2000; 100:57–70.
Hanahan, D., Weinberg, R.A. Hallmarks of cancer: The next generation. Cell. 2011; 144:646–674.
Hartwell, L.H., Hopfield, J.J., Leibler, S., Murray, A.W. From molecular to modular cell biology. Nature. 1999; 402:C47–C52.
Ideker, T., Dutkowski, J., Leroy Hood, L. Boosting signal-to-noise in complex biology: Prior knowledge is power. Cell. 2011; 144:860–863.
Izaquirre, J.A., Chaturvedi, R., Huang, C., et al. CompuCell, a multimodel framework for simulation of morphogenesis. Bioinformatics. 2004; 20(7):1129–1137.
Kalinka, A.T., Varga, K.M., Gerrard, D.T., Preibisch, S., Corcoran, D.L., et al. Gene expression divergence recapitulates the developmental hourglass model. Nature. 2010; 468(7325):811–814.
Ley, R.E., Peterson, D.A., Gordon, J.I. Ecological and evolutionary forces shaping microbial diversity in the human intestine. Cell. 2006; 124(4):837–848.
Lu, Y., Cross, F.R. Periodic cyclin-Cdk activity entrains an autonomous Cdc14 release oscillator. Cell. 2010; 141(2):268–279.
Lupski, J.R., Belmont, J.W., Boerwinkle, E., Gibbs, R.A. Clan genomics and the complex architecture of human disease. Cell. 2011; 147(1):32–43.
Mangan, S., Alon, U. Structure and function of the feed-forward loop network motif. Proc. Natl. Acad. Sci. USA. 2003; 100(21):11980–11985.
Massie, T.M., Blasius, B., Weithoff, G., Gaedke, U., Fussmann, G.F. Cycles, phase synchronization, and entrainment in single-species phytoplankton populations. Proc. Natl. Acad. Sci. USA. 2010; 107(9):4236–4241.
Neumann, B., Walter, T., Hériché, J.K., et al. Phenotypic profiling of the human genome by time-lapse microscopy reveals cell division genes. Nature. 2010; 464(7289):721–727.
Peer, D., Hacohen, N. Principles and strategies for developing network models in cancer. Cell. 2011; 144:864–873.
Pennacchietti, S., et al. Hypoxia promotes invasive growth by transcriptional activation of the met protooncogene. Cancer Cell. 2003; 3:347–361.
Plank, M.J., Sleeman, B.D. A reinforced random walk model of tumour angiogenesis and anti-angiogenic strategies. Math. Med. Biol. 2003; 20(2):135–181.
Prudhomme, B., Gompel, N. Evolutionary biology: Genomic hourglass. Nature. 2010; 468(7325):768–769.
Qin, J., Li, R., Raes, J., et al. A human gut microbial gene catalogue established by metagenomic sequencing. Nature. 2010; 464(7285):59–65.
Raj, A., Rifkin, S.A., Andersen, E., et al. Variability in gene expression underlies incomplete penetrance. Nature. 2010; 463(7283):913–918.
Reaven, G.M. Banting Lecture 1988. Role of insulin resistance in human disease. Diabetes. 1988; 37(12):1595–1607.
Reaven, G.M. Role of insulin resistance in human disease (syndrome X): An expanded definition. Annu. Rev. Med. 1993; 44:121–131.
Reaven, G.M. The metabolic syndrome: requiescat in pace. Clin. Chem. 2005; 51(6):931–938.
Taniguchi, C.M., Emanuelli, B., Kahn, C.R. Critical nodes in signalling pathways: insights into insulin action. Nat. Rev. Mol. Cel. Biol. 2006; 7:85–96.
Virgin, H.W., Todd, J.A. Metagenomics and personalized medicine. Cell. 2011; 147(1):44–56.