Chapter 3
The Allocation of Resources
The first two chapters in this book have looked at economic behaviour from the viewpoints of consumer and producer in turn. We have yet to consider the ways in which the decisions of households and businesses affect each other. But before we get to grips with this subject there is one fundamental matter to deal with. Indeed, it is so central to the nature of economics that many introductory textbooks start with it.
Scarcity
So far, we have identified a number of characteristics of goods and services which affect economic decision-taking, but we have not yet dealt with one fundamental property that a good must possess before an economist will pay attention to it. This is the quality of scarcity.
An economist might be interested, for example, in how much petrol is sucked into a car's engine, but not in how much air is drawn in with it. He might want to know how much people enjoy a swim in the local pool, but not how much they enjoy a dip in the sea. Why? The oxygen in the air is quite as important to the working of a motor car engine as is petrol. And the most obvious differences between swimming pools and the sea are things like salt content, chlorine and waves, which do not sound like critical economic matters.
The explanation is simple enough. Petrol and swimming pools have a prime characteristic in common which distinguishes them from air and sea water, and which is in no way related to their physical properties. It is this. Petrol and swimming pools are not available in sufficient quantities to enable people to have all that they want of them. In other words, they are not abundant, like air and sea water, but are, in contrast, 'scarce', and it is necessary to make a choice of how much of each of them is to be produced.
Economists are interested only in the production and consumption of goods and services which are scarce or, to be precise, of goods and services which are produced by factors of production which are themselves scarce. The reason why it is the scarcity of factors, rather than of goods, that is basically important is that there would be little difficulty in producing enough of any one good for everybody to have as much of it as he wanted. Although video-recorders are scarce enough, there would really be no great difficulty in providing every family in Britain with half a dozen of them. And although lager is scarce and water is not, the economy could produce enough lager to supply all the drinking needs of the nation if this was what was really wanted.
Opportunity Cost
There is, naturally, a catch to all this. If we gave everyone in the country six video-recorders or enough lager to bath in, we would have to do without other things that we value. To make video-recorders, labour, machinery, steel, and other raw materials are necessary; but these factors of production are also required for the manufacture of many other goods and services that societies want. That is to say, the factors themselves are scarce. We do not have enough labour or capital to make as much of everything which we want, at the same time. If we use our factors to make a video-recorder, we sacrifice the chance to use them for another purpose. There is a real cost involved in employing any scarce factors of production for a particular use. Economists call this opportunity cost, to stress the fundamental lost opportunity which occurs when a production decision involving a scarce factor is made. This concept is central to economics.
Economic goods, then, are defined as those which are produced by at least one scarce factor of production, but the scarcity of the factor is not absolute. It is relative to the value which people place upon it. In the case of water, for example, there is so much more of it falling as rain in Britain than people want that it is an international joke. But in India and California, water is by no means abundant and, even in Britain, water is not freely available in ample quantities to every home. Scarce factors of production are needed to make provision of adequate supplies for domestic purposes. Moreover, a material like rubber, which is at present scarce, need not always remain so in the economic sense of being scarce relative to demand. If, for example, rubber was shown to emit certain rays which caused fatal heart disease the demand might drop to zero and it would no longer be considered by economists to be scarce.
Household Choice
Opportunity cost, or real cost as it is sometimes called, has applications at the individual or household level. Every good or service with a price greater than zero has a real cost which is simply the other goods or services that could be purchased with the same money. It is useful to depict the choice facing the consumer diagrammatically.

Figure 3.1 The opportunity cost of restaurant meals.
Suppose a consumer has, say, £30 a month to spend on meals in restaurants and visits to the cinema. If we know that the average cost of a restaurant meal is £6 and that the price of a cinema ticket is £2, we can represent the alternative ways in which the individual can spend his £30 on the two services as a budget line. In Figure 3.1 this is the line RC. The vertical axis of the diagram measures numbers of restaurant meals and the horizontal axis, numbers of cinema tickets. All the points on the budget line represent combinations of the two services available to the consumer for £30. Indeed the line RC is sometimes referred to as a consumption possibility curve, a tag which perhaps rather more aptly portrays its meaning.
The budget line intersects the vertical axis at R which has the value 5, because this is the maximum number of restaurant meals the consumer could buy if he did not go to the cinema at all. RC cuts the horizontal axis at C, showing that the consumer could alternatively buy fifteen cinema tickets at £2 each if he never went out for a meal during the month. Along the line between R and Care other available combinations, such as A, which represents two restaurant meals and nine cinema tickets - also costing £30.
The opportunity cost of restaurant meals in real terms is the number of cinema tickets the consumer goes without every time he eats at a restaurant. It can be judged from the slope of the budget line and it is here, in fact, three cinema tickets. This follows from the fact that the price of a restaurant meal is three times that of a cinema ticket. A steeper budget line, say, RC' in Figure 3.2, means that tickets cost £3 each (while the price of a meal remained at £6). The consumer could still buy five meals out, but only ten cinema tickets, on the assumption that he spent the whole £30 on these two goods. The opportunity cost

Figure 3.2 A rise in the price of cinema tickets.
of a restaurant meal, indicated by the slope of the budget line RC', is two cinema tickets. This follows from the fact that meals now cost twice as much as tickets. Note, however, that the opportunity cost is given in real terms, that is, one meal costs two cinema tickets.
For formal completeness, we should add that a change in the amount of money the consumer has available to spend on the two goods is shown by a movement of the whole budget line. The shift will be to a new line parallel to the original so long as no change occurs in the relative prices of the goods or services. For example, a rise in income which allows the consumer to allocate £36 instead of £30 on restaurant meals and cinemas, while their prices remain unchanged at £6 and £2, would shift RC to R"C" in Figure 3.3, that is, 'north-east' away from the origin. A fall in the budget allocation would shift the budget line in the opposite direction, still parallel to RC but nearer the origin of the graph. (Can you draw it?)
The Production Frontier
The discussion of the previous section was designed to show that the idea of opportunity cost was relevant to consuming households. It was to some extent a diversion from the more general theme of scarcity and economic goods. We now return to look at this fundamental concept from the wider angle of national production.
One approach to this question is through the realisation that there is a gap between the wants which people have and the resources which are available for their satisfaction. We can develop this idea and obtain some important conclusions by considering a simplified economy,

Figure 3.3 A rise in consumer's income (relative prices unchanged).
where decisions are to be taken on what to produce over the coming period of time, say, a year. In our economy, we include several factors of production but only two goods which are produced by them. The nature of the goods is irrelevant. To think of an economy subsisting on only two products is so clearly unreasonable that there is no point in pretending that they are realistic. Let us call them, therefore, spaghetti and overcoats.
Imagine, then, that all resources are used to produce either spaghetti or overcoats, or a combination of the two. Consider, further, that we know how much of these goods could be produced per year if resources were employed as efficiently as possible. Say that 1,000 overcoats could be produced if there was no need for spaghetti; 500 (tonnes) of spaghetti if no one wanted overcoats; or that any of the following combinations of the two goods could be produce: 750 overcoats and 125 spaghetti, 500 overcoats and 250 spaghetti or 250 overcoats and 375 spaghetti.
All these production (or output) possibilities can be set out in the form of a table (Table 3.1), which may be described as a production possibility schedule.
Output possibilities can be represented graphically in a manner which is not dissimilar from that used in Figure 3.1 to show consumption possibilities open to a household. If we measure overcoats on the vertical axis and spaghetti on the horizontal axis we can plot each point on the graph (Figure 3.4).
In Figure 3.4, point A shows output when all resources are devoted to overcoats (1,000). Point E shows that 500 spaghetti can be produced when no resources are used for overcoat production. Point C shows the maximum possible output if resources are divided equally between the
Table 3.1 Possible output combinations per week

two goods, so that 500 overcoats and 250 spaghetti are available, and so on. This diagram emphasises the fact that the real opportunity cost of producing more of one good is the reduction in output of the other. If we join together points A to E and assume that all intermediate positions along AE represent combinations of spaghetti and overcoats which can be produced (for example, 50 spaghetti and 900 overcoats; 200 spaghetti and 600 overcoats, and so on we have, in fact, a line which represents all the production possibilities which are open to society. This line is called a production frontier, or sometimes a production possibility curve or a transformation curve. It has two features to which we must draw attention.
- The production frontier represents only the maximum combinations of the two goods which could be produced if resources are all fully employed and organised as efficiently as possible. Output combinations such as T are unattainable and although any combination

Figure 3.4 A production frontier exhibiting constant opportunity costs.
- of goods within the space between the line AE and the origin 0 is possible, all would involve some waste of resources. At S, for example, 250 overcoats and 250 spaghetti would be produced. This must either be an inefficient use of resources or indicate that some are simply lying idle, since we know that if only 250 overcoats were produced, there would be enough resources to produce, not 250 tons of spaghetti, but 375. Alternatively, if only 250 spaghetti were produced, there would be enough resources left for 500 overcoats. In other words C or D are better combinations of output than S.
- 2. The opportunity cost of either good can be judged from the slope of the production frontier. The principle involved here is the same as for the budget line in Figure 3.1. It is important enough to explain again.
Consider first the figures in Table 3.1. They tell us the numerical value of opportunity cost. We can describe this cost in either of two ways. If we think of using resources for spaghetti production rather than for overcoats the opportunity cost of 500 spaghetti in terms of overcoats given up is 1,000 overcoats. Or, on average, the cost of 1 tonne of spaghetti is 2 overcoats. Alternatively, if we look at the cost of overcoat production in terms of spaghetti given up, 1,000 overcoats cost 500 spaghetti; or, on average 1 overcoat means the loss of ½ tonne of spaghetti.
Now that we know the numerical value of the opportunity cost, let us return to the diagram and find its graphical expression. Imagine all resources are used in overcoat production, that is, the economy is at point A in Figure 3.4. Suppose, now, it is decided to start producing 50 spaghetti at the point on the production frontier below A corresponding to an output of 900 overcoats and 50 spaghetti. The cost of doing so is the reduction in overcoat production implied in the move, which we know to be 100 overcoats. Or, on average, the cost of each tonne of spaghetti is 2 overcoats. Moreover, as we proceed down the production frontier, using all our resources with maximum efficiency, we shall always have the same opportunity cost facing us - 1 tonne more spaghetti always costs 2 overcoats.
The reason why the slope of the line describes the opportunity cost should now be clear. It may be further clarified in Figure 3.5 where a second production frontier AF has been added. On the new curve, we assume that the economy is able to produce the same number of overcoats as before, but only half as many tonnes of spaghetti. If now we again contemplate moving resources from 100 overcoats to spaghetti production, we shall get not 50 tonnes of spaghetti, but only 25. That is to say, the opportunity cost of 25 spaghetti is now 100 overcoats. If we still want 50 spaghetti, we shall have to give up 200 overcoats that is 1 spaghetti costs 4 overcoats on average, and the line AF is twice as steep as AE.
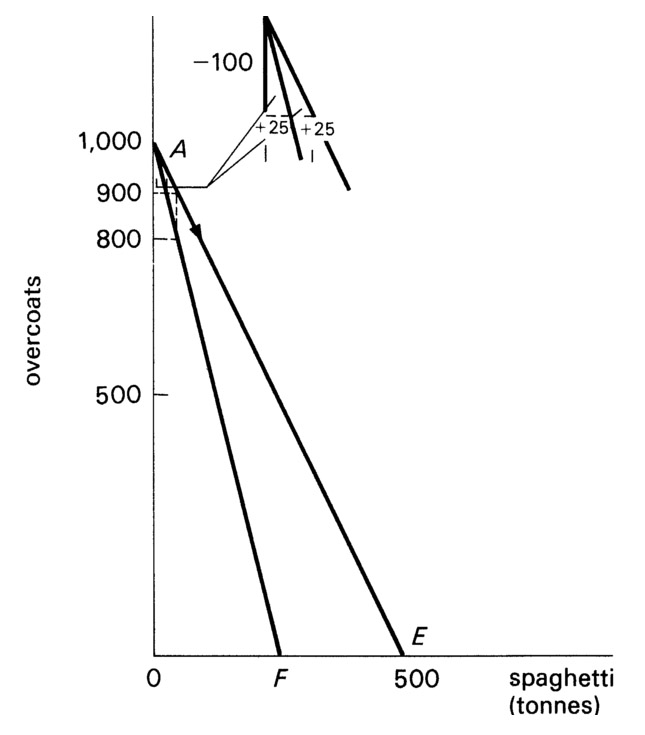
Figure 3.5 Production frontiers AE and AF. The latter exhibits higher opportunity costs of spaghetti in terms of overcoats.
Cost Conditions
It is necessary to consider that three rather important and different cost conditions are typically encountered.
(1) Constant costs
In the examples used so far, the cost of spaghetti in terms of overcoats is not affected by the amount of either good being produced. In other words, we have been assuming what are called constant costs. This was illustrated geometrically in Figures 3.4 and 3.5 by the fact that the production frontiers are straight lines. The cost of producing one more of either good in terms of the other does not change as we move along AE, or along AF. There is a proportional (or linear) relationship between them.
(2) Increasing costs
Constant costs are not found in all economic situations. They imply that the resources employed in the production of one good can be combined in the production of another good with equal ease and efficiency, regardless of how much of either is being produced. Such a situation occurs if all resources are, as we shall see, neutral as between differing uses. But this is not very likely. One reason is that although the two goods can be made by exactly the same resources (labour and land, for example), each factor of production is probably not equally efficient at producing spaghetti and overcoats. Men work in both lines of output, but their skills are not the same in each. So when resources have to be transferred from, say, spaghetti to overcoat production, it is natural to expect that the men first released will be those who are least skilled at spaghetti production. Then, as more and more resources are moved over, it becomes increasingly necessary to transfer the efficient spaghetti workers to overcoat production. The cost of producing an additional overcoat tends to rise, involving the loss of more and more spaghetti. The farther the economy moves 'north-west' along E'A' in Figure 3.6, the more the cost of overcoats, in terms of spaghetti, increases.
This may be seen quite easily from the graph, where OA' has been divided into equal units (G'J' = J'K'= K'M' = W'T' = Z'A', and so on). Start at E', with all resources in spaghetti production, and move towards A' in 'jumps' representing equal inceases in overcoat production. The cost of doing so, in terms of forgone spaghetti, rises all the time, from E'G' to H'J' to L'K', and so on, until eventually it reaches S'T' and W'Z', as the last units of resources leave the industry and the spaghetti mills close down.
There is a second reason for expecting cost to increase as resources move from one output to another, which has nothing to do with
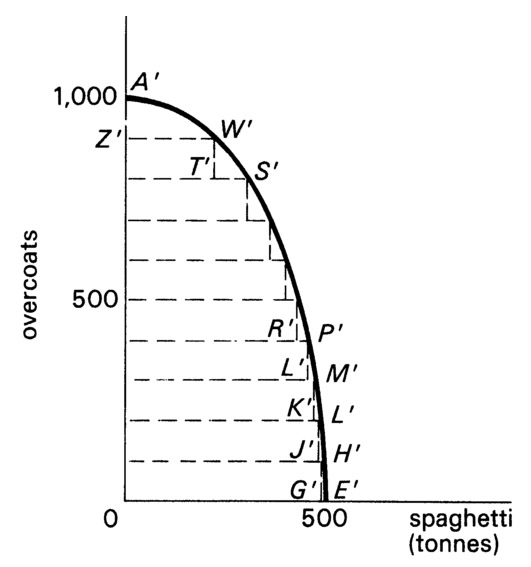
Figure 3.6 Production frontier curve exhibiting increasing opportunity costs.
acquired or innate differential skills of the labour force or of any other factor of production. It is concerned with the proportions in which factors of production are combined with each other. To demonstrate this, let us assume that some combinations of factors are better than others; that spaghetti, for instance, can be produced most efficiently with a relatively large amount of land, while overcoat production is cheaper with relatively large numbers of workers.
Consider again what happens as we move from E' up towards A' increasing overcoat production. At first, all resources are producing spaghetti and the first factors released are likely to be largely labour, since these are relatively abundant in spaghetti production. All to the good, of course, for the overcoat producers. A lot of labour is what they need, not a lot of land. Worse, however, is to follow as more overcoat production is wanted and we move farther up E'A'. Precisely because a relatively large amount of labour was released to start with, there is less available now. Instead, as the transfer of resources continues to the end, relatively larger and larger amounts of land inevitably become available. Lowering output of spaghetti means, therefore, that fewer and fewer overcoats can be made with the newly acquired factors. Certainly, total overcoat production rises, but the opportunity cost of one extra overcoat, in terms of spaghetti given up, also rises.
We shall return to this question again in Chapter 5, where the idea of diminishing returns to a factor of production will be more fully explained. We may be satisfied now with the realisation that a production frontier, which represents rising real opportunity costs of each good in terms of the other as production increases, is not uncommon. We recognise its shape as a curve, convex to the origin, as in Figure 3.6.
(3) Decreasing costs
The third and final category of cost conditions is the opposite of that of the previous section. Decreasing costs obtain whenever the real cost of producing additional units of a good or service call for less resources to be given up elsewhere. They are associated with industries where economies of large-scale production are present. We saw in Chapter 2 that such conditions tend to be associated with the existence of highly specialised capital equipment, the use of which is justified by a large volume of output.
The shape of a production frontier exhibiting decreasing costs is like that in Figure 3.7, concave to the origin. Once again OA" is divided into equal units. Starting at E", where all resources are devoted to spaghetti, and moving up along the production frontier, as overcoat production is increased the real cost in terms of spaghetti sacrificed falls. G"E" is greater than J "H", which is greater than K"L", which is greater than N"M", and so on.

Figure 3.7 Production frontier exhibiting decreasing opportunity costs.
‘The Economic Problem’
The technical matters dealt with in the last few pages were designed to clarify the meaning of the term scarcity in its economic sense. They must not be allowed to blind us to the fundamental issue. It is worth restating the general principle, which is that so long as there is a shortage of goods and services relative to the demand for them, there must inevitably be problems of choice. Households must choose how to spend their limited incomes, and businesses must choose what factors of production they should buy. Economics is essentially concerned with problems of choice. Indeed, the subject has even been dubbed the 'science of choice'. When people talk of the existence of 'the economic problem', they are referring to the way in which an economy, or a person, chooses to allocate scarce resources among the competing uses to which they may be put.
Economic problems exist both for the individual and for society as a whole. In each case the notion of scarcity must be regarded in the relative sense to which attention was drawn earlier. Table 1.1 in Chapter 1 (page 6), for example, demonstrates that the gap between resources and needs is not the same for households in different income classes. For those with incomes of less than £46 a week in 1977, there could hardly have been enough of many goods and services to satisfy quite low requirements. But even households with £123 or more coming in per week faced the problem of choice. If an extra £1 was available next week, what would they do with it? More clothing would 'cost' less entertainment, or fewer other goods. Any decision involves a real cost so long as the household does not have a large enough income to buy as much of everything as it wishes and to save as much as it wants for the future.
The Affluent Society
Present-day Britain has sometimes been called an affluent society; the USA more frequently so, because income per head is higher there. Does this mean that the economic problem has begun to disappear?
We only have to think about the fact that the world is going to run out of known fossil fuels of oil, coal and gas to give an unqualified negative answer to the question. It is true that rising incomes have made many problems of choice less urgent than they were a hundred years ago, or than they are today in countries like India, where millions of people may not have enough food. But, although there are a handful of multi-millionaires who have so much that they cannot be thought of as facing any personal economic problems, for any nation as a whole and for the vast majority of people in it the economic problem still exists, though in a perhaps less pressing modern form. Although teenage factory workers with relatively high incomes may sometimes seem to have nearly everything they want, they would usually like more. The range of choice they set themselves, like everyone else, is determined by their means. A man only starts to think of buying a yacht, for example, if his income is great enough to make it a real possibility.
Problems of Choice
Problems of choice can take many forms. We may illustrate their general nature with three examples.
(1) Leisure as a Scarce Commodity
Everyone, even a millionaire, is faced with the economic problem of how best to spend the twenty-four hours of the day. Ignoring, for the sake of simplicity, man's need for sleep, the choice can be portrayed as fundamentally one between work and leisure. In so far as work results in output, the cost of more goods and services is the leisure that has to be given up in order to produce them. Figure 3.8 illustrates the alternatives available: OB (i.e. twenty-four hours) of leisure and no goods; OA goods and no leisure; and all the combinations of leisure and goods implied by the line AB. This is a kind of budget line and is drawn as a straight one, implying that one hour's work always brings a reward of the same number of goods; If, more realistically, there were diminishing returns to work, AB would be convex to the origin, like A' E' in Figure 3.6 (page 41).
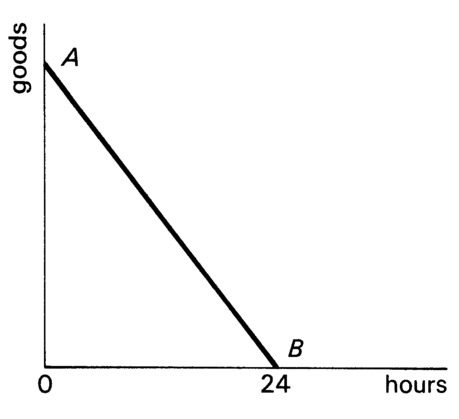
Figure 3.8 The opportunity cost of goods in terms of leisure sacrificed.
Social Versus Private Wants
The existence of scarcity in an affluent society is also demonstrated by what are known as public goods. These are things like roads, prisons and welfare services, which (for reasons to be considered later) are often provided by the state. They are said to satisfy social as distinguished from private wants, which an individual satisfies for himself by buying food, clothing, and so on, in the market place.
Opinions differ as to what goods and services should be supplied by the government and what the individual should be left to buy for himself. An American, John K. Galbraith,1 was one of the first economists to argue that the US economy was underproviding for social wants, such as schools, at the expense of private wants, such as automobiles. Galbraith's arguments have been criticised, but there is no room for doubt about the fact that social and private wants compete. The more resources are used to make cars and video-recorders, the less are available for state education, national health services and defence. Figure 3.9 illustrates the choice between a typical private good (video-recorders) and a public good (prisons).
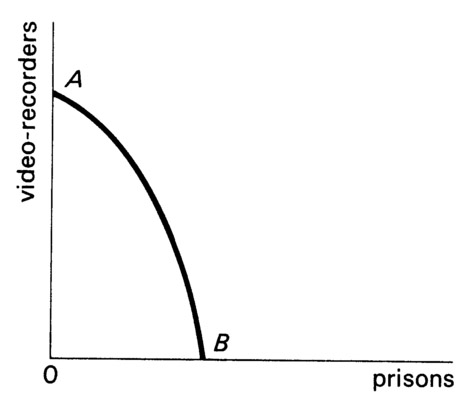
Figure 3.9 The opportunity cost of private goods in terms of public goods.

Figure 3.10 An increase in productivity shifts the production possibility curve to the right.
Economic Growth
A production possibility curve for an economy is drawn to represent the nature of a particular set of choices during a given period of time, such as a year. It reflects the underlying state of technology at that time, as well as the available resources. Any change in either matter would result in a shift of the production possibility curve.
In Figure 3.10 the original situation of Figure 3.6 (page 41) is repeated in curve AE. Curves BC and DC, on the other hand, represent situations in a later year, when it becomes possible to produce more of both goods than before, because of improved technology, population growth, the acquisition of new natural resources, or some other change. The difference between BC and DC is that, in the latter, increased productivity is proportionately the same in both spaghetti and overcoats; BC, on the other hand, implies that the change increased the supply of those factors of production which are relatively more important in spaghetti than in overcoat production.
Outward shifting of a production possibility curve might be due to the fact that, in some previous year, the economy decided to devote resources to building up its stock of capital goods. This, we know, must have had a real cost in terms of fewer consumption goods in the earlier period. (See Figure 3.11.) Here, however, the nature of the opportunity cost must be interpreted with a little more care. In so far as the additional capital shifts the production possibility curve to the northwest away from the origin, the cost of forgone consumption at the time the capital is being built up is, partly at least, offset by the extra consumer goods that can later be made available. Indeed, one of the most important problems of choice facing an economy concerns the
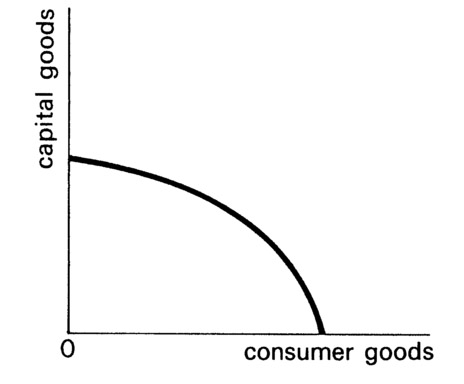
Figure 3.11 The opportunity cost of capital goods is the consumer goods that must temporarily be sacrificed.
rate at which it is prepared to forgo present consumption in order to have more to consume in the future. Holding down consumption to increase investment is likely to raise the rate of growth that an economy can enjoy.
Solving Problems of Choice
The first part of this chapter has been confined to describing the problems that scarcity of resources, relative to wants, raises in an economy. The last lap in our introductory overview is concerned with the ways in which the kind of society we live in solves these problems. We know by now that the problems are what to produce, how much to produce and how to producce it.
Consider the first two questions. They ask how society should use its scarce resources. How many overcoats, video-recorders, schools, prisons? How much spaghetti, clothing, Christmas pudding and marmalade? The list is enormous, for it should include everything that society is capable of producing with its limited resources.
It must be admitted at once that there is no single answer to the question of how a society should decide to allocate its scarce factors of production. However, it is usual to distinguish three broad kinds of solution. Societies which rely substantially on one or other of them are known as traditional, command or market economies.
(1) Traditional Economies
In a self-sufficient society the decision of what to produce may be made by tradition. A man hunts because his father hunted before him. A girl cooks because that is what her mother did. Each family unit is virtually self-sufficient, and that is an end to it.
In modern industrialised or semi-industrialised economies, tradition may still play a part in the making of production decisions. But the specialisation of modern production methods demands that more complex techniques be employed. Families are no longer self-sufficient, and some form of exchange — whereby computer programmers, for example, can buy the output of farm workers — is needed. Modern societies have evolved a highly specialised institution to perform this function. It is through the medium of money that factors can receive rewards for their services, and buy such goods and services as they happen to want. We discuss this in Chapter 8.
(2) Command Economies
In complex modem economies tradition plays a relatively minor role in resource allocation. Two different solutions to the economic problem are found. The distinction between them is basically whether decisions are centralised or decentralised. Command economies are those where resource allocation is concentrated in, for example, a central planning agency (which may employ input-output techniques as described earlier in Chapter 2, pages 23-26). Countries such as the Soviet Union and others in Eastern Europe tend to make many economic decisions in this way. So did Britain in wartime. There are important political considerations involved here. However, as far are we, as economists, are concerned it does not matter whether the agency is democratically elected, a benevolent dictatorship, or even a tyrannical despot. As long as the decision on what to produce is taken centrally, the economy is known as command, and we can ignore the political pros and cons.
(3) Market Economies
Britain is not a command economy at the present time although some decisions are taken by the government when expenditure on public goods, such as defence and a large part of education and health, is involved. But the bulk of decisions about what to produce in Britain are not taken by the government at all. As we know from Chapter 2, decisions about the production of goods and services are decentralised to a large extent and taken by the business sector of the economy, though they are also influenced by the decisions of individuals as consumers of goods and services.
For the private sector of the economy, where video-recorders and overcoats are produced, there is no commanding authority. Instead, a form of social institution has evolved which allows producers and consumers to get in touch with one another. This institution is simply a market, and the communication that buyers and sellers have with each other is a monetary one, through the medium of what is known as the price mechanism.
The Price Mechanism
A market in economics is no more than a place or organisation whereby producers, or sellers, of a good get in touch with those who may want to buy what they are offering for sale. Goods are not, however, given away but are bought and sold, and it is possible to regard the movements in their prices as acting as signalling devices which indicate whether too much or too little of each good or service is being produced.
The price mechanism works through the operation of what are known as the forces of supply and demand. We shall devote the whole of the next chapter to some technical aspects of supply-demand analysis. It is possible at this stage, however, to explain the general principles which lie behind the way in which the price mechanism allocates resources.
Consider, for example, the market for the single commodity, say, tomatoes, during a given period of time, say, a week. On one side of the market there are the potential tomato consumers; on the other side are the sellers of tomatoes.
Suppose that the sellers offer their stock for sale at a price which, if they sell it all, will cover their costs plus a modest profit. At this price, however, it does not follow that the quantity that consumers wish to buy will necessarily be exactly the right amount to clear the market. If it is not, then the price must be either too high or too low. If it is too high there will be an excess of supply over demand. And, if all producers are to dispose of their tomatoes before they perish, some of them will have to lower the price. And once price has fallen in one part of the market, it is difficult for any single producer to charge a higher one. Competition among sellers tends to bring the price down for all.
A different situation occurs if price is too low, in the sense that households wish to buy more at this price than sellers are prepared to sell. In other words, there is an excess of demand over supply. The effect in this case is the exact opposite of that described in the previous paragraph. Now it is the buyers who are in competion with each other. There are not enough tomatoes for everyone who wants to buy them. Some sellers will catch on and find that they can sell their stocks even if they raise the price. As before, once price has risen in a part of the market, other sellers may soon follow suit. Competition among consumers for a limited quantity tends to raise market price.
There is, therefore, a tendency for price to move up and down in the market to bring about an equality between the quantity of tomatoes that sellers want to sell and that which consumers wish to purchase. In other words, the price mechanism tends to equate supply and demand. When the wishes of sellers and purchasers in the market happen to be the same, then price is said to be at an equilibrium level. Supply and demand are equal.
Prices as Signals
The key to understanding the process by which market economies allocate resources is to recognise that price has a 'signalling' function for those on both the supply and demand sides of the market. This may clearly be seen when the market has been in equilibrium and some external change disturbs it. The argument is not basically affected by whether the initial change comes from the demand side, or from the supply side as, for example when costs of production alter after a new machine is introduced. Let us, however, examine the effects of a change which originates on the demand side.
We know from our brief look at household expenditure patterns in Chapter 1 that demand is likely to be influenced by several factors such as income, tastes and family size. Let us suppose that the size of families among consumers increases. How would this affect the price of tomatoes and the quantity bought and sold? Figure 1.2 (on page 9) suggests that the proportion of income spent on food rises with size of family. So let us assume that the rise in average family size implies an increase in the demand for tomatoes, in the sense that households wish to purchase larger quantities at each and every price, including that which until now has been the equilibrium price in the market. In these circumstances, there is an excess of demand over supply and this tends to produce a rise in price, which acts as a signal both to sellers and to buyers. The higher price acts as a rationing device choking off some of the new demand: only those who value tomatoes highly will be prepared to pay more for them, and price will move towards a new, higher, equilibrium.
The rise in price may have a second signalling effect, however. Provided that there has been no change in the production costs of tomatoes, we should expect that sellers would increase the quantity they wish to sell. If they were making a profit before, they would make a larger one with a higher price, and thus other producers — of cucumbers, for example — might be tempted to switch production to tomatoes. So in the end, when the market has finally settled at a new equilibrium, we may find that the increase in demand, working through the signal of changing price, has brought about an increase in supply to meet it.
Consumer Sovereignty
The allocation of resources brought about by a decentralised market system reflects household demands, which are, in turn, affected by consumer tastes. This feature of the price mechanism has led to its being described as achieving consumer sovereignty. Moreover, the simplicity and low operating cost of the market mechanism compared with central planning administrations can be very appealing. More than two hundred years ago the economist Adam Smith described the system as the 'invisible hand' which guides resources into their best uses, as indicated by the preferences of consumers for different products relative to costs of production. The motive force which is said to bring about this state of affairs is that of self-interest. The wishes of consumers and producers become harmonised through the price mechanism precisely because each side of the market seeks to look after its own interests.
This is, perhaps, most obvious on the demand side. If the price of a good changes, people will tend to buy different quantities of it, because its opportunity cost relative to other goods has altered. By allocating expenditure differently from before, consumers are most likely to get the maximum satisfaction out of their total income.
Less obvious may be the fact that the independent attempt by each producer to maximise his profits can also be in the interest of consumers. If demand increases and price rises in consequence, the incentive of higher profits may be what brings forth a matching increase in supply. Little wonder that some nineteeth-century philosophers studying these matters were enthusiastic supporters of a freely working price mechanism for equating the wishes of self-seeking producers and consumers. They could see that prices act as signals on a track between buyers and sellers — rationing limited supplies among those prepared to pay most for them, and stimulating changes in supply in the light of changing conditions. The so-called laissez-faire philosophy of noninterference by the government in the working of the economy flourished on this kind of argument.
Market Failure
Unfortunately the market system does not work quite as well as its supporters would wish. Explicitly, it can fail to achieve an allocation of resources which best meets society's goals on a number of counts. We shall have to wait until we have nearly finished this book for a full discussion of the causes and implication of market failure.
However, we can already indicate briefly the major reasons for failure. They are perhaps best appreciated at this stage if it is understood that the market mechanism acts efficiently only when certain conditions relating to the market and to the economy obtain. Six such conditions may be distinguished.
- Markets must be efficient in the sense that buyers and sellers must be well informed about prices, costs and other relevant market facts. Supply and demand must also respond reasonably quickly to price changes.
- There must be effective competition on both sides of the market so that price changes whenever changes in the conditions of supply or demand occur, as when tastes change or new production techniques are discovered.
- Buyers and sellers must aim at maximisation of satisfaction and of profits. Consumers must know what they want and be prepared to back their desires with hard cash. They must not be forced through advertising or other means by producers to buy goods which will not give them the satisfaction they except. Producers, likewise, must know what goods are the most profitable to produce.
- The distribution of income and wealth between persons must be regarded as in some sense satisfactory, or 'optimal'. The importance of this assumption can be understood if the pricing system is seen as reflecting consumer wants, expressed in the prices that people are prepared to pay for different goods and services. The price mechanism is rather like an electoral system with money for votes. Consumers 'vote' for products by spending money on goods that please them. Popular goods will be those on which consumers want to spend relatively large sums of money. However, people's demand for goods depends, as we know, on their incomes. The rich tend to buy Aston Martins, lobsters and luxury penthouses. Lower-income groups tend to demand Fords, cockles and small semi-detached houses. Inevitably, the distribution of income affects the pattern of national output. A society where the distribution is very uneven will 'vote' for different things than an egalitarian one. How are we to choose between them? The answer is that we cannot do so on economic grounds alone. All we can say is that the forces of supply and demand, operating within a given distribution, produce a certain composition of output. We can only accept the resulting pattern of goods and services as the best if we are prepared to accept the distribution of income as the best also.
- The only goods and services must be those which benefit individuals as individuals. This condition excludes public goods, like roads and defence, which benefit the community in a wider sense. It also excludes consumption or production of a kind which involves spillover effects on outsiders, for example, pollution.
- The social, legal and institutional framework within which the pricing system operates must be regarded as generally satisfactory. The market operates in a social setting, not in a vacuum. Laws and customs relating to such matters as private property, the family and the freedom, rights and responsibilities of the individual may all affect the manner in which markets work. Society may not be content to see, for instance, traffic in drugs, sex or other activities deemed undesirable. It may be inhibited by custom or outlawed by legislation.
A Verdict on the Market Mechanism
It is clear that all the ideal conditions listed in the previous section do not exist in the British economy. Does that mean that we should necessarily reject the price mechanism for the allocation of resources? The answer is surely no. But it must be recognised that the market system is less than perfect. Some things might be, and are, done to make it function more efficiently. We can only judge whether it is an appropriate machinery if it is compared with other systems, such as central planning, which, too, has advantages and disadvantages. The final verdict requires that the pros and cons of all systems are weighed in the balance. This cannot be done without bringing political considerations into the arena — a matter beyond the scope of this book. We shall, however, return to discuss the efficiency of the market system in Chapter 10.
Factor Markets
The discussion of the mechanism by which price allocates resources has so far concentrated on the markets for goods and services - that is, with the question of what goods to produce and how much of each of them. We have largely ignored the question to which attention was directed in the chapter on production, of how a given output should be produced, or how businesses should combine productive factors in the process.
We know that the choice of factor combinations depends partly upon their prices, which are themselves affected by conditions in the factor markets. Supply and demand considerations in fact apply in the markets for goods and services. There is a supply and a demand for labour of different types, and these influence levels of wages.
There is a final point to make. In so far as factor markets influence factor rewards - wages, rent, interest and profits — they effect our incomes as persons. They will also influence the distribution of income and wealth. We argued earlier that we cannot judge whether the market system works well or not in general without deciding also whether the distribution of income is in some sense good or acceptable. Income distribution affects the allocation of resources and it directly controls the amounts of goods and services that individuals in the community can buy. It follows, therefore, that we must include factor markets in the assessment of the efficiency of the price mechanism with which we ended the last section.
Other Markets
We may end this chapter by mentioning the existence of markets other than for goods and services and for factors of production. There are, for instance, markets where the lending and borrowing of money and financial assets takes place, and others where dealers in foreign currencies engage in trading. The same basic principles of supply and demand apply to all these markets, though each possesses certain special characteristics.
All markets provide the framework within which the price mechanism operates to answer the questions with which we have been concerned — what? how much? and how? — as well as others such as who shall enjoy the benefits of the goods which are produced? when shall they be consumed, now or later? and where should they be produced (Cardiff or London)? To understand how these questions are answered we need to know more about the nature of supply and demand, and to this end we turn to the next chapter.
Note: Chapter 3
1 J.K. Galbraith, The Affluent Society (Hamish Hamilton, 1958; Penguin, 1962).