10 Economic freedom and economic growth and development
Introduction
The focus of this chapter is to critically evaluate the hypothesis that economic freedom is a significant causal variable in the determination of real per capita income. Economic freedom is broadly defined and relates most closely to the proxies typically used for economic freedom in empirical studies. Although I do find that economic freedom is a necessary condition to achieve high and higher levels of per capita income; this is largely in terms of threshold effects or critical values as opposed to persistent marginal effects. In other words, more and more economic freedom does not appear to yield higher levels of per capita income. Moreover, I find that the use of aggregate measures of economic freedom can generate misleading results given that they comprise different sub- indexes that do not always correlate in a similar fashion with per capita income.
Of particular importance, the evidence suggests secure private property rights is a most significant positive causal variable, whereas the hypothesis that labor regulation and big government are bad for the realization of higher levels of real per capita income finds little empirical validation. Traditional statistical methods plus graphical analyses are used in this study.
In some of the recent applied literature on economic growth and development, where institutional variables are given some consideration in the modeling process, a key independent variable is what is broadly referred to as economic freedom. This variable is considered to be a proxy measure for secure private property rights, where the latter is critically important to the New Institutional Economics (NIE) along the lines pioneered by North (1990) and Olson (1996, 2000). A key argument put forth in NIE is that such rights provide the incentives for individual agents to behave in a fashion wherein the private and social rates of return are equalized. This minimizes the incentives for agents to engage in rent- seeking behavior thereby encouraging behavior that would maximize per capita growth.
Similar points have been articulated much earlier (and largely ignored) by Hayek who argued for the establishment of an environment where decentralized planning can take place though individual agency thus making optimal use of one the scarcest of resources necessary to the organization and functioning of economic life—knowledge. Secure private property rights facilitates independent economic agents making allocative decisions in a world of continuously moving disequilibria and imperfect information given extant and changing relative product and factor prices (Hayek 1967, p. 198; see also Pipes 2000).
Implicit in some of the NIE literature is the hypothesis that competitive markets force efficient institutional change in terms of ideal configurations of property rights and, more generally, economic freedom. The more competitive are the markets, the more efficient will be the economy, ceteris paribus (see Parente and Prescott (2000) for detailed and explicit narrative on this point; see also Leibenstein (1966)). Needless to say, making an economy more competitive is, in itself, a function of institutional change. But given the state of competitiveness, the more secure are private property rights, the more efficient will be the economy. Thus, for the NIE, it is of considerable analytical importance to include a proxy for private property rights as an independent variable, irrespective of market structure, when testing for the importance of institutional variables for growth and development.
In terms of theory and the causation, the NIE and econometricians testing the hypothesis that secure private property rights are critical, it is suggested that not only is this variable (and economic freedom writ large) a necessary condition for sustained per capita growth and economic development, but that the higher is the extent of secure property rights, the higher should be the level of real per capita income and per capita growth. It is implied that there is both a threshold effect and a marginal effect, where the latter is not subject to diminishing returns. In fact, the standard econometric analyses do not test for threshold effects and focus on the marginal effects (slope coefficients) and pay most heed to statistical significance, which has nothing to do with either of these effects or with economic significance (Ziliak and McCloskey 2004; see also Altman 2005c).
Economic Freedom Index
Although secure private property rights is at the core of the NEI and the early Hayek, a typical and popular measure of economic freedom, the Fraser Institute’s Economic Freedom Index (EFI), part of its Freedom of the World project (Fraser Institute 2007) is an amalgam of indexes, only one component of which is a proxy for property rights.1 The same is true of the Index of Economic Freedom (IEF ) produced by the Heritage Foundation (Heritage Foundation 2007). These indexes are deemed to be helpful in constructing a causal story with regards to the relationship between how the level of economic freedom affects the level of per capita income. But given the nature of the aggregate index, EFI cannot be used to test for the importance of secure private property rights per se. Nor can the IEF. Any identical aggregate index number across countries or for a given country over a set of years can have a different economic meaning if this aggregate index number is made up of different index numbers for its component parts. The index for secure private property rights might be either falling or rising as the aggregate index number for economic freedom increases or diminishes.
Given its practical importance for research, I focus on the Fraser Institute’s EFI. But I also provide some comparative estimates derived from the Heritage Foundation’s database. The EFI comprises sub- indexes for the following variables (the Heritage Foundation’s IEF is similarly constructed, but includes an additional index measuring the extent of corruption):
- Size of government: expenditures, taxes, and enterprises (incorporating: general government consumption spending as a percentage of total consumption; transfers and subsidies as a percentage of GDP; government enterprises and investment; and top marginal income and payroll tax rates).
- Legal structure and security of property rights (incorporating: judicial independence; impartial courts; protection of property rights; military interference in rule of law and the political process; integrity of the legal system; legal enforcement of contracts; and regulatory restrictions on the sale of real property).
- Access to sound money (incorporating: money growth; standard deviation of inflation; inflation: most recent year; and freedom to own foreign currency bank accounts).
- Freedom to trade internationally (incorporating: taxes on international trade; revenue from taxes on international trade as a percentage of exports and imports; mean tariff rate; standard deviation of tariff rates; non- tariff trade barriers; compliance cost of importing and exporting; size of the trade sector relative to expected; black- market exchange rates; international capital market controls; foreign ownership/investment restrictions; and capital controls).
- Regulation of credit, labor, and business ((i) credit market regulations comprising: ownership of banks; foreign bank competition; private sector credit; interest rate; controls/negative real interest rates; (ii) labor market regulations comprising: minimum wages; hiring and firing regulations; centralized collective bargaining; mandated cost of hiring; mandated cost of dismissing; conscription; and (iii) business regulations comprising: price controls; administrative requirements; bureaucracy costs; starting a business; extra payments/bribes; licencing restrictions; cost of tax compliance).
As a footnote to the empirical narrative below, it is important to observe that the Fraser Institute’s and the Heritage Foundation’s perspective on the necessarily negative effects of minimum wages, unions, safety nets, and government (points 1 and 5 above), although very much part of the conventional economic wisdom is not universally adhered to. Labor market flexibility need not imply “cheap” and weak labor. For example, Baumol et al. (2007) write:
the importance of flexible labor markets cannot be overstated: if entrepreneurs cannot attract new labor, they cannot grow, nor will they want to grow if labor rules are overly restrictive (especially if rules limit the ability of firms to fire nonperforming workers or shed workers they no longer need).
(p. 7)
Labor market flexibility is related to the capacity of entrepreneurs to adopt changes that allow their corporations to flourish—they can’t be forced to maintain workers if so doing will cause their firms long term harm. Baumol et al. (2007, p. 91) also maintain that a social safety net can be positive for the economy since it reduces the extent to which workers can be expected to resist entrepreneurial innovations which can be devastating to individual workers in the absence of a safety net. A safety net therefore has both efficiency and social justice dimensions attached to it. Moreover, Lindert (1996a, 1996b) shows that state expenditure, so often inveighed against by many mainstream economists, need not negatively affect the economy. Its impact can even be quite positive. Much depends, as common sense would lead us to expect, on how funds are spent. Moreover, for the seeds of economic freedom to take root often requires government investment in public goods. In addition, there is a theoretical literature which suggests that cheap and weak labor can negatively impact on labor productivity and technological change whilst better-rewarded workers can have the opposite effect (Altman 1992b, 1998, 2003a, 2004b, 2004a, 2004b, 2005b, 2007; see also Chapters 2, 3, and 8).2
Economic freedom and GDP
Basic empirical results
The empirical relationship between the EFI and its component indexes, and real per capita GDP (PCGDP) and per capita growth, is discussed in relation to Table 10.1 and Charts 10.1 to 10.15. Table 10.1 presents estimates for correlation and slope coefficients. The charts provide a more revealing analysis of the relationship between economic freedom and PCGDP, which goes beyond the mere average relationships specified by regression analysis. It is here that threshold effects are discussed. I also speak to the possible importance of governance to the determination of PCGDP levels (Chart 10.16). It is assumed that either levels or growth rates of per capita GDP is the dependent variable. All data are derived from the databases of the United Nations’ Human Development Report (2006a), the Fraser Institute’s Economic Freedom index (2007), the Heritage Foundation’s Index of Economic Freedom database (2007), and the World Bank’s governance (Kaufmann et al. 2007) databases. All charts employ the Fraser Institute data for economic freedom. Real PCGDP estimates are for 2004 in 2004 United States purchasing power parity equivalents. The sample size of 133 countries (Table 10.a.1) was determined by the EFI database and its compatibility with the Human Development Report data on PCGDP and per annum PCGDP growth rates. I use annual real GDP per capita growth rates for the 1990–2004 period and rely on the 2004 economic freedom estimates. Using the available data for the pervious few years would not affect my results.
Some have questioned economists’ focus on the determination of per capita GDP. But the conventional wisdom perceives that this variable is an important proxy for socio- economic well-being. Some scholars argue that the Human

Development Index (HDI), developed through the auspices of the United Nations, is a truer representation of well- being than PCGDP. The HDI is an unweighted index of PCGDP, life expectancy, and education, where these component index numbers are scaled back at an increasing rate as one moves toward the top of the scale. However, the correlation (R2) between PCGDP and the HDI ranking for 177 countries is 0.92. Chart 10.1 illustrates the tight relationship between these two variables. Clearly, per capita income matters substantively for a country’s HDI ranking.3 This is especially the case if a nation is to move beyond the bottom 60 ranked economies, for whom this wide range of low rankings is consistent a narrow range of low PCGDPs. It is therefore possible to move up the bottom steps of the ladder of low ranked countries with a given low level of per capita income largely through government policy making more effective use of scarce resources toward improvements in education and health; but beyond this per capita income must increase for socio- economic well- being to improve. And, it is hypothesized by many scholars that extending the breath and scope of economic freedom is vital to achieve this end.
From Table 10.1 it is evident that there is a tight statistical relationship between economic freedom and PCGDP—an R2 of 0.76. This is not, however, the case with all of the core components of the EFI. Sound Money and Treedom to Trade score in the high 0.50s whereas Economic Regulations, in the low 0.50s; but the Size of Government is a negative 0.05. Also a key sub- component of economic regulation, Labor Market Regulations scores an R2 of only 0.23. The tightest fit is between PCGDP and the Legal Structure and Protection of Property Rights, with an R2 of 0.82, where the latter variable is the de facto core of the NIE’s and of the early Hayek’s causal hypothesis positively relating economic freedom to growth and development. The slope coefficients for linear regressions of PCGDP as a function of the EFI and its components are mainly large. For the EFI, there is a slope value of almost $8,000. Every one point increase in the EFI, which ranges from 0–10, statistically yields a $8,000 increase in PCGDP.
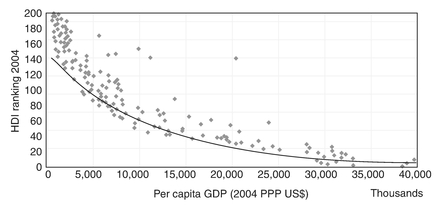
Chart 10.1 HDI and per capita GDP.
For economic growth and the EFI the R2 is much lower at 0.36 and at a similar level for its sub- components except for Economic Regulations, which is at 0.22 and Size of Government, at 0.05. Labor Market Regulation is only 0.03. Therefore, there is much more variation from the mean relationship when the dependent variable is economic growth. Nevertheless, it is clear that there exists the “expected” positive relationship between growth and economic freedom. The slope coefficient is almost 1.0; a one point increase in the EFI is correlated with a 0.9 increase in the annual growth rate. Such growth would increase PCGDP by about 9 percent in ten years. But once again the relationship between Labor Regulations and economic freedom and Size of Government and economic freedom is a trivial one. The Heritage Foundation’s data yield similar results, but with even stronger negative results for government variables. Finally, both the Heritage Foundation’s Corruption Index and the World Bank’s Corporate Governance Index, which incorporates corruption, are very strongly and positively correlated with PCGDP, with large slope coefficients. This suggests that economic freedom itself, no matter how important, requires good corporate governance, if economic freedom is to facilitate sustained growth (Kaufmann 2003, 2005, 2007; Kaufmann et al. 2008).
With regards to the slope coefficients that, for the EFI (and for the IEF), are economically significant for both PCGDP and growth, one must be wary about easily projecting, in a linear fashion, from changes in the EFI to changes in PCGDP. Graphical analysis suggests otherwise. It is also important to note that if one relates PCGDP to the marked increase in the EFI from 1990 to 2004, the R2 is negative 0.33 for a percentage change and negative 0.31 for an absolute change in economic freedom. The R2 is negative 0.88 and 0.08 respectively for per capita growth rates. This tests the hypothesis that changes in economic freedom drives differences in PCGDP with a time lag. These basic results at least suggest that, on average, increasing the extent of economic freedom, in terms of the EFI, was not economically important during this time frame wherein much per capita growth actually took place. It also points to the possible importance of thresholds of economic freedom that must be realized for higher levels of per capita GDP to be realized.
Threshold effects
The thresholds effects are more analytically nuanced than the traditionally discussed coefficients. The threshold effect refers to the threshold value of the independent variable (such as economic freedom) which, when exceeded, yields a zero marginal effect on the dependent variable (such as per capita GDP). Thus, in terms of a revealed statistical relationship, once one realizes the threshold value, further increases in the independent variable do not appear necessary to increasing the value of the dependent variable. What the graphed data on the charts suggest is that particular thresholds of economic freedom need be passed for a wide array of per capita GDPs and growth rates to be achieved. The marginal effects intimated by the slope coefficients do not seem to be all that important. Moreover, the value of the correlation coefficient (R2) indicates the importance of each threshold value for achieving higher levels of income and growth. The higher the R2, the greater the number of thresholds that need be passed—the more linearity there is in the statistical relationship between the dependent and independent variables.
The EFI is scaled 0 to 10, with 10 representing the most economic freedom, where 10 is hypothesized to be the ideal by some scholars. With regards to the aggregate EFI and PCGDP (Chart 10.2), an EFI of 5 to 6 is consistent with a PCGDP of between $5,000 and $10,000. Between $10,000 and $15,000 correlates with an EFI of close to 7, while an EFI of between 7 and 8 correlates with PCGNPs greater than $15,000. Going above 8 is not required to generate ever higher levels of per capita income. Moreover, achieving an EFI of between 7 and 8 is also consistent with very low PCGDPs. Therefore, certain levels of economic freedom might be necessary to achieve particular levels of per capita income, but they are far from sufficient. This latter basic finding holds true for each of the EFI sub-indexes.
In terms of Legal Structure and the Protection of Property Rights (Chart 10.3), an EFI sub-index of 4 to 5 is associated with a PCGDP of between $5,000 and $10,000, while an EFI of 5 to 6 correlates with a PCGDP of between $10,000 and $15,000, although a few countries achieve per capita incomes that are even higher. An EFI of 6 to 7 correlates best to PCGDPs of between $15,000 and $30,000. Higher per capita incomes require even greater protection of property rights and a more conducive legal system. Unlike the other sub- indexes, the property rights sub- index is characterized by some statistical linearities between itself and the level of per capita income.
Economic Regulation (Chart 10.4) between 5 and 6 is most closely correlated with a PCGDP of $5,000 to $10,000. Between 6 and 7, per capita income spans to close to $30,000, but can also reach to well below $5,000. PCGDPs exceeding $30,000 is associated with an EFI sub-index of 7 to 8.

Chart 10.2 Economic freedom and per capita GDP.
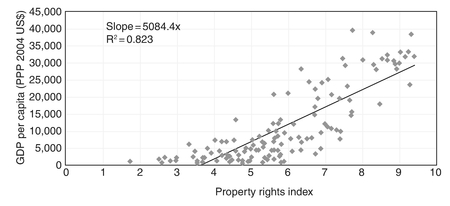
Chart 10.3 Property rights and per capita GDP.

Chart 10.4 Regulations and per capita GDP.
However for the Labor Regulations (Chart 10.5) component of the Economic Regulation sub- index, index numbers of between 4 and 5 are consistent with PCGDPs approaching $30,000, and between 5 and 6 correlate with the highest of per capita incomes. Apparently less and less labor regulation does not purchase ever higher levels of per capita income. At the same time even a minimum threshold of labor market deregulation is consistent both with very low and with very high levels of PCGDP.
An index number of 6 for the Sound Money (Chart 10.6) sub- index is the threshold for achieving between $5,000 and $10,000 PCGDP. However, one has to jump to a sub-index number of 8 to 9 to realize a PCGDP of $10,000 to $35,000. Moreover, most economies achieving PCGDPs above $20,000 are characterized by a Sound Money EFI of 9 to 10. The evidence suggests that it is
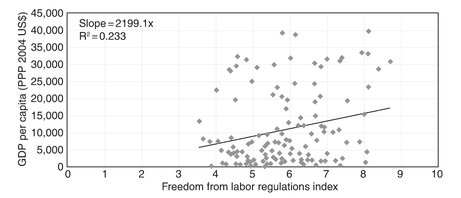
Chart 10.5 Labor regulations and per capita GDP.
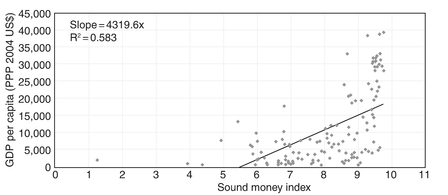
Chart 10.6 Sound money and per capita GDP.
unlikely that high per capita incomes can be achieved without realizing high thresholds for Sound Money.
The Big Government (Chart 10.7) sub- index tells another tale. A sub- index of 4 to 5 is consistent with an array of PCGDPs ranging from the very low to close to $40,000. In addition, low to very high (indicating small government) subindex numbers are all consistent with PCGDPS of $5,000 or less. For the Freedom to Trade (Chart 10.8) sub-index a threshold of 5 to 6 is consistent with per capita incomes of $5,000 to $10,000. Index numbers of 6 to 7 are consistent with PCGDPs of $10,000 and above, albeit many more countries are characterized by PCGDPs above $15,000 with index numbers of 7 to 8.
Turning one’s attention to per capita growth (Chart 10.9), an EFI of less than 5 is only consistent with negative growth rates. Index numbers of 5 to 6 correlate

Chart 10.7 Government size and per capita GDP.
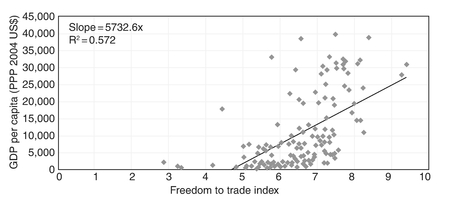
Chart 10.8 Freedom to trade and per capita GDP.
with growth rates up to 2 percent per annum. Above 6, one has a wide range of growth rates from the very low to the very high. Therefore, 5 is a critical threshold for significant economic growth, where a 2 percent annual growth rate yields a 22 percent increase in per capita income over ten years. EFIs well below 10 correlate with growth rates ranging up to 12 percent, albeit most of the very high growth rates economies are at about 4 percent, where the latter yields a 48 percent increase in PCGDP over ten years.
In terms of Property Rights (Chart 10.10) sub-index, 4 (approximately) is a threshold for positive growth. Between 4 and 5 correlates with negative to high positive growth rates. Also, as this sub- index increases there are fewer economies with very low and negative growth rates. Nevertheless, growth rates of between 2 and 4 percent (which are actually quite high historically speaking), are consistent with sub-index numbers of 5 and above.
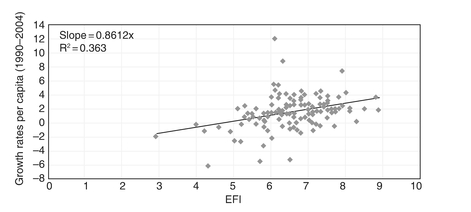
Chart 10.9 Economic freedom and growth.

Chart 10.10 Property rights and growth.
Economic Regulation (Chart 10.11) sub- index numbers of 4 to 5 are consistent with negative to just above 2 percent growth rates. But sub- index numbers of 5 to 6 correlate with negative to even higher positive growth rates, ranging to about 6 percent. Reducing economic regulation per se (increasing the sub- index number) does not appear to yield more growth. With regards to the Labor Regulations (Chart 10.12) component of this sub- index, index numbers of 4 to 5 correlate with negative to positive 4 percent growth rates. A relatively low threshold need be met with regards to Labor Regulation to achieve fairly high rates of economic growth. Sub- index numbers of between 5 and 6 are consistent with growth rates ranging from the negative to well over 8 percent. As is true with the other EFIs, realizing a threshold value is not sufficient to generate a particular rate of growth.

Chart 10.11 Economic regulations and growth.
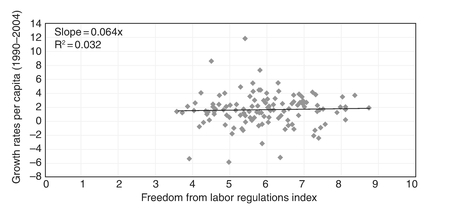
Chart 10.12 Labor market regulations and growth.
A Sound Money (Chart 10.13) sub- index number of 6 to 7 correlates best with growth rates ranging from the negative to about 6 percent. Increasing this sub- index number does little (statistically speaking) to generate more growth.
A Government Size (Chart 10.14) sub- index number of about 3.5 is consistent with growth rates ranging to about 2 percent. To locate many economies with growth rates above the 2 percent rate requires subindex numbers of 5 to 6. Also, between 4 and 5, one finds many more economies with growth rates ranging up to 2 percent. One does not require (statistically speaking) smaller and smaller government to correlate with high rates of growth.
With regards to Freedom to Trade (Chart 10.15), sub- index numbers of 5 to 6 correlate with growth rates ranging from the negative to about 4 percent. Lesser sub- index numbers correlate only with negative growth economies—with one
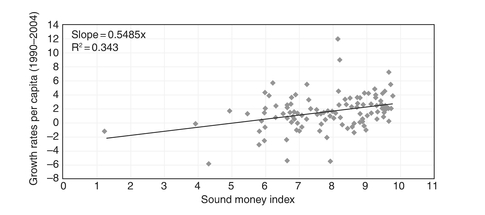
Chart 10.13 Sound money and growth.

Chart 10.14 Government size and growth.
exception, that of a near zero growth economy. Sub- index numbers of 6 to 7 are associated with even higher growth rates. Once again, achieving a threshold index number appears to be necessary but not sufficient to generate the higher rates of economic growth.
Finally, it is revealing to refer to Chart 10.16, where the World Bank’s corporate governance index (CGI) is graphed against PCGDP. The former includes measures for illegal and legal corruption, public sector ethics, and judicial/legal effectiveness. The CGI is scaled from 0 to 100, with 100 being the best.
A CGI of 20 to 30 is associated with $5,000 to $15,000 of PCGDP; $15,000 to $20,000 with a CGI of 30 to 40; $20,000 to $25,000 with a CGI of 40 to 50; and above $25,000 with a CGI of greater than 60. Most high income economies
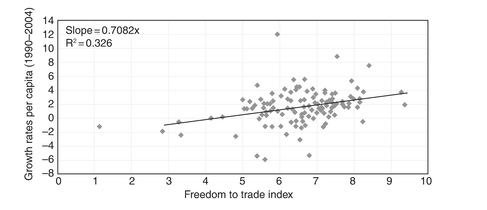
Chart 10.15 Freedom to trade and growth.
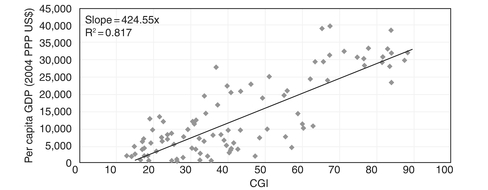
Chart 10.16 Corporate governance and per capita GDP.
are correlated with CGI numbers above 70, where one also finds no low income economies. There are some linearities associated with the CGI and PCGDP. Improving corporate governance, on the margin, appears to make a substantive difference. But, typically, achieving a particular level of corporate governance, does not guarantee the realization of a particular level of PCGDP. Needless to say, corporate governance appears to be of some importance in the determination of PCGDP. It is not at all clear that economic freedom without good corporate governance (in terms of appropriate thresholds) will suffice to facilitate the realization of high levels of per capita income.
Conclusion
At a most general level the evidence supports the hypothesis that Economic Freedom, as embodied in the Fraser Institute’s EFI, is economically important to the determination of per capita income. As the conventional wisdom would have it, there exists relatively large correlation coefficients with the “right” sign and relatively large and substantive slope coefficients linking per capita income, per capita growth, and economic freedom. This is especially true of the EFI’s subindexes relating to property rights and sound money. There is much less support, if any, that labor market regulation and big government, as defined by the Fraser Institute as well as by the Heritage Foundation, apart from extreme levels, negatively impact per capita income. Indeed, this is consistent with research suggesting that free market economies benefit from properly administered quality doses of Big Government and Labor Regulation. It is also consistent with the view that economic efficiency and technological change is positively affected by higher wages and related to this, greater doses of labor rights. Graphical analysis suggests that what is most important is the threshold values or minimum values of economic freedom (and that of its components) to realize particular levels of per capita income and growth. These values are typically moderate and far from the maximum value 10, with exception of Sound Money. The evidence supports the hypothesis that once these thresholds are met, further increases to economic freedom (or its components) do not appear necessary for the realization of further increases in per capita income and growth. There are clear exceptions to this. One is with regards to private property—affirming the long held Hayekian view of its vital import for economic growth.
For more economies to move forward, typically different thresholds must be realized for the different sub-indexes of economic freedom. Yet, reaching and even surpassing such thresholds is shown not to be sufficient to realize higher levels of per capita income and growth. Therefore, although economic freedom is important to grow an economy, pursuing marginal increases in economic freedom past the threshold will not do the trick, especially if attention is directed to the wrong components. The level of economic freedom per se does not indicate if a particular economy has its economic freedom mix just right. It also seems to be the case that different economies at different and perhaps even at the same stage of development might require somewhat different mixes of the ingredients for economic freedom.4 The estimates presented here are only suggestive of the thresholds values that need be met, in terms of economic freedom index numbers and their components. Moreover, for economies to grow, other variables (such as good corporate governance) must also be in place. And, the Economic Freedom Index, by its very nature, provides no information on whether these other necessary pieces in the growth puzzle are present and appropriately positioned.
Appendix
