
Chapter 10. System Security Engineering
I once heard that Yahoo has full-time employees who are responsible for replacing failed hard drives in its 50,000+ servers. If the average hard drive lasts for two years, then Yahoo has to replace roughly 69 hard drives per day! System security engineering in cybersecurity is about building and evaluating systems to be dependable in the face of adversaries and errors. Building a secure system is ideally about taking an unambiguous policy, formally validating the hardware design and implementation, formally validating the software, and generating scads of documentation. Such a system, despite precise, formalized elegance, is not usable. Therefore, we have to compromise on pieces of this idealized development and engineering process. For every compromise there comes some risk, and the security engineer must try to drive down that risk, recognizing that it can never reach zero. Science can help you analyze the options and figure out how to mitigate them.
Understanding security requirements at the system level—the big picture—requires cross-disciplinary skills and tools. Security engineers should consider economics, psychology, and ethics in addition to information technology. Examples of broad systems of this nature include enterprise networks, electronic voting solutions, and online web services. You probably don’t have to think about system security for anything the size of Facebook, but the principles of system-level security are just as important for basic client-server applications and small business computer networks. As a system-level risk, security engineering takes on different kinds of scientific experimentation. In this chapter, we will look at those differences. You will also learn the powerful analysis technique of regression analysis, how to evaluate system security through the lens of moving target defense, and a walk-through experiment to defend against unintentional insider threats.
Scientific experimentation should not be an answer to the statement “I don’t know how to design a system.” Instead, science in this domain is useful for testing hypotheses about how the system will react and for helping to measure the security impact of your engineering choices, and therefore provides insights about how to improve system-level security. Say you are responsible for deploying public key infrastructure (PKI) in your enterprise. As the infosec professional, you should understand, test, and document what attackers could do from various vantage points in your network such as man-in-the-middle attacks or phishing, how you could effectively monitor the PKI deployment, and how human users might affect the system in situations like high load.
There are many research questions in security engineering that apply to new and existing solutions. You may ask specific questions, like “does this system maintain its integrity under specific stressors?” Well-designed experiments can answer such questions. You may also ask, “does the composition of components increase the attack surface of the system?” You could certainly design experiments that launch a suite of attacks against the system and measure the system’s response. You may want to help answer questions that nobody has solved to date, like how to measure attack surfaces using experimentation.
The research problems in system security engineering are both technical and non-technical. For example, it is difficult to manage evaluations because tools for measuring security protections for different parts of the system are so different. Measurements of security in cryptographic algorithms cannot be easily compared to measurements of security in human usability. How could we improve the Common Criteria, which many regard as pointlessly bureaucratic? Research is needed to make these evaluations compatible and cohesive. Other disciplines, such as economics, have tools for understanding risk even with incomplete information. Cybersecurity still has much to learn from these other disciplines.
An Example Scientific Experiment in System Security Engineering
For an example of scientific experimentation in system engineering, see the paper “An Epidemiological Study of Malware Encounters in a Large Enterprise” by Yen et al.2 In the abstract below you can see that this study attempted to answer research questions about patterns of malware encounters, including “How did the malware infiltrate network perimeter?” and “Can we predict which users will encounter malware?” Elsewhere in the paper we learn that the authors analyzed McAfee antivirus logs from 85,000+ hosts in a multinational enterprise over four months. Among the findings were that malware rates varied widely across countries, that employees were three times more likely to be infected outside the enterprise network (e.g., at home), and that malware encounters were highest among people with technical jobs. Using regression (described in “Regression Analysis”), the researchers built a classifier (an algorithm that maps input to a category) that could successfully identify hosts at high risk for malware. Note that this study used the epidemiological method—the science of patterns, causes, and effects (often of medical diseases)—and that there was no stated hypothesis or controlled experiment.
Abstract from a system security engineering experimentWe present an epidemiological study of malware encounters in a large, multinational enterprise. Our datasets allow us to observe or infer not only malware presence on enterprise computers, but also malware entry points, network locations of the computers (i.e., inside the enterprise network or outside) when the malware were encountered, and for some web-based malware encounters, web activities that gave rise to them. By coupling this data with demographic information for each host’s primary user, such as his or her job title and level in the management hierarchy, we are able to paint a reasonably comprehensive picture of malware encounters for this enterprise. We use this analysis to build a logistic regression model for inferring the risk of hosts encountering malware; those ranked highly by our model have a greater than three times higher rate of encountering malware than the base rate. We also discuss where our study confirms or refutes other studies and guidance that our results suggest.
Let’s look at how you could conduct a study in your own network similar to the epidemiological study above. Your hypothesis could be that people with the title “Vice President” have a higher rate of infection. Here’s an approach:
Gather antivirus alerts for the enterprise. If you run McAfee ePolicy Orchestrator, export the Threat Event Log by querying the
EPOEventstable and exporting as a CSV file named infections.csv. Here is a query to select the victim’s hostname, username, IP address, threat name (e.g., W32/Conficker.worm), and threat type (e.g., “worm”).SELECT [TargetHostName], [TargetUserName], dbo.RSDFN_ConvertIntToIPString (TargetIPV4), [ThreatName] [ThreatType] FROM [dbo].[EPOEvents]
You should get a CSV file with contents like this:
workstation5,dykstra,10.5.1.4,W32/Conficker.worm,Worm
workstation5,dykstra,10.5.1.4,Downloader.gen.a,Trojan
workstation32,smith,10.17.0.2,W32/Conficker.worm,Worm
...
Gather usernames and titles. In Active Directory for Windows, you can retrieve all accounts and save them to username_titles.csv with this PowerShell command:
get-aduser -SizeLimit 0 -Properties Title,SamAccountName
|Export-Csv username_titles.csv
You should get a CSV file with contents like this:
Senior Researcher,dykstra
CEO,smith
Programmer,alice
...
Now combine the two files based on common usernames. In Linux, use this command:
# Compare the usernames: 2nd field in username_titles.csv and 2nd field
#    in infections.csv
# If there's a match, print the second field in username_titles.csv
#    (SamAccountName) and the fifth field in infections.csv (ThreatType)

awk 'NR==FNR{username_titles[$2]=$1;next}{print username_titles[$2]",
             "$5;}' FS="," username_titles.csv infections.csv
You should get output like this:
Senior Researcher,Worm
Senior Researcher,Trojan
CEO,Worm
...
You could extend this example using IP addresses to compare infections inside the enterprise network to those outside. In the next section, we will learn how to do regression analysis, which you could also apply to this example.
Regression Analysis
Regression analysis is one of the most widely used data analysis techniques for estimating the relationships among variables. In particular, regression is used to predict the future values of the dependent variable. Regression is a mathematical model represented by equations, and exact relationships do not exist in regression analysis. There are many types of regression analysis that differ in the types of variables used in the equations of the model. You are most likely to encounter linear regression, which uses one independent variable to explain or predict the outcome of one dependent variable. The relationship between the variables is typically in the form of a straight “best fit” line (for linear regression) that best approximates all the individual data points. Regression analysis is a very broad and complex topic only skimmed here to let you understand the basic concept.
Note
The formula for converting between Fahrenheit and Celsius is an exact relationship (F = (9/5)C + 32). Unlike regression, the relationship is known exactly so there is no need to model the relationship.
British statistician George Box famously said that “essentially, all models are wrong, but some are useful.”3 The truth in this statement comes from the fact that models are simplifications and approximations of reality that often ignore important factors (e.g., friction, gravity, etc.). However, models are still useful for understanding our complex world and making predictions. Regression analysis is useful in practical cybersecurity because predictions can inform our choices about how to build, deploy, or configure cybersecurity solutions.
Statistical software such as MATLAB and R make regression analysis approachable for nonexperts. The output of the software will include coefficients for the regression equation. The strength of the model is expressed in these correlation coefficients, which explain how much of the predicted value can be explained by the regression formula. Generally ranging from 0 to 1, a value of 0 indicates no predictive power, 0.1−0.3 weak prediction, 0.4−0.6 moderate prediction, and 0.7−1 strong prediction. The following example has a correlation of 0.68, or moderate predictive ability. Purely scientific studies often strive for values of .9 or above, but 0.68 may be good enough to influence the system design.
Suppose you were developing a cloud-based smartphone security app and wanted to know how to balance battery consumption with your app’s activity on the device. Your hypothesis is that bandwidth usage is a significant factor correlated with battery usage. You collect some sample data from people similar to your target audience, like that in Table 10-1.
You can graph the data in R using the lm (linear model) and
plot commands, along with a “best fit” line, as follows
(see Figure 10-1):
# Load the data from a CSV file
mydata <- read.csv("data.txt", header=TRUE)

# Create a scatterplot of bandwidth versus battery discharge
plot(mydata$bandwidth,mydata$battery)

# Calculate the coefficients of regression model
fit <- lm(mydata$battery~mydata$bandwidth)

# Use the coefficients to draw the Line of Best Fit
abline(fit)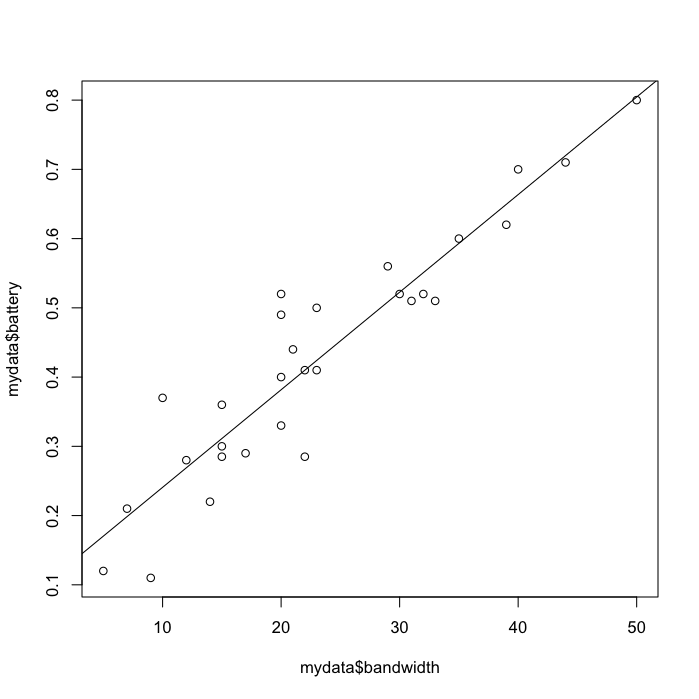
Figure 10-1. Regression scatterplot of actual battery/bandwidth values and the Line of Best Fit showing the calculated approximate values from the regression model
You also want to test that other factors (CPU utilization, WiFi
state, I/O idle rate) are not as significantly correlated with battery
usage. The cor command calculates the correlations between all variable pairs as
follows:
# Compute the correlation coefficient between bandwidth and battery discharge
> cor(mydata$bandwidth,mydata$battery)
[1] 0.681595

# Compute a correlation matrix for all variables
> cor(mydata)
                  CPU       wifi          IO   bandwidth     battery
CPU        1.00000000 -0.4373735  0.65467277  0.36014650  0.08320651
wifi      -0.43737346  1.0000000 -0.80266372  0.28494970  0.22539850
IO         0.65467277 -0.8026637  1.00000000 -0.04450642 -0.15041226
bandwidth  0.36014650  0.2849497 -0.04450642  1.00000000  0.68159530
battery 0.08320651 0.2253985 -0.15041226 0.68159530 1.00000000| cpu_utilization (%) | wifi_state (on, off) | io_idle (%) | bandwidth (kb/s) | battery_discharge |
|---|---|---|---|---|
| 0.2 | 0 | 0.008 | 0 | 0.36 |
| 0.3 | 1 | 0.001 | 20 | 0.52 |
| 0.1 | 0 | 0.17 | 10 | 0.37 |
| 0.2 | 1 | 0.06 | 20 | 0.40 |
| 0.4 | 1 | 0 | 100 | 0.66 |
After the regression analysis is complete, cross-validation is used to check the model by assessing how the results will generalize to an independent dataset. This is necessary because models sometimes incorrectly estimate how accurately a predictive model will perform in practice. Cross-validation is performed in rounds, where each round consists of partitioning a dataset into subsets, performing the analysis on one subset (the training set), and validating the analysis on the other subset (the validation set). Ten-fold cross-validation is common, where the data is partitioned into 10 subsets, cross-validation is performed 10 times, and in each round nine samples are used for the training set and one sample is used as the validation set.
You can perform 10-fold cross-validation in R using the DAAG package as follows:
# 10-Fold Cross-Validation for Linear Regression
# df = a data frame
# m = number of folds (rounds)
library(DAAG)
cv.lm(df=mydata, fit, m=10)
As you can see, regression is a complicated topic but becomes easier to do with modern tools. It is an important and powerful concept that plays a part in many scientific discoveries. As you consider your own cybersecurity experiments, remember that regression can help analyze the relationships among variables.
Moving Target Defense
In a blog post several years ago, Netflix revealed that it had a Chaos Monkey.4 The Netflix infrastructure runs in the cloud, and the Chaos Monkey was a program that terminated random virtual machine instances in its infrastructure. Why? Because it believed that “the best defense against major unexpected failures is to fail often.” By failing often, Netflix forces its applications to be resilient to the chaos.
Moving Target Defense (MTD) is the concept of routine change in a system or environment to increase uncertainty and apparent complexity for potential attackers. It can also reduce attackers’ window of opportunity and increase the costs of their attack efforts because, from their perspective, their targets change “randomly” over time. MTD is typically used for Internet-facing hosts rather than internal to a network, but this is not required. Examples of MTD include network configuration randomization and address space randomization. Many IT environments today remain static for years, giving adversaries time to learn and attack the system. For example, your web server may have been at the same IP address running the same version of Apache for many years. MTD introduces the element of surprise, such as changing the web server’s IP address in an unpredictable way. Chaos Monkey is an example of MTD because a virtual machine could be terminated at any time.
MTD makes the bold assumption that perfect security is unattainable in practice. Given that starting point, and the assumption that all systems are compromised, MTD focuses on enabling the continued safe operation in a compromised environment and having systems that are defensible rather than perfectly secure. As a complex system, MTD offers an opportunity for cybersecurity science. There are interesting hypotheses to test in selecting and deploying moving target defenses in your environment. Does the use of diversity limit spreading attacks? Is there any measurable difference in spread rates when using static environments versus dynamic diversity? What experiments would you want to run to convince your management that MTD was a wise choice?
One cost of deploying MTD is the overhead of managing and executing the moves, making complex systems intentionally more complex. Not only must the system itself be able to implement regular changes, but so must those who interact with that system. If you change the IP address of your web server every day, the network defense team and intrusion detection systems must be aware of what the current, legitimate IP address is at any given time. Decision-makers appreciate analysis that shows that the anticipated cost and risk of not deploying MTD are greater than the anticipated cost and risk of adopting and implementing a change.
Risk assessments tend to evaluate the environment at a single moment in time. As a result, they would fail to adequately capture the risk of a static target over time, or the benefit of change. Think back to earlier in the chapter about the algorithm to predict which machines in an enterprise were likely to encounter malware. Now think like an attacker: if the attacker knows that you have some way to predict the vulnerable users or machines, she will try to fool your algorithm and attack users or machines that break the algorithm’s regular rules. In this common attacker-defender cat-and-mouse game, you can imagine that changing even one variable in the environment could lower the risk of an otherwise vulnerable machine: changing machine IP addresses, deploying different web browsers, or randomly running full-disk malware scans on machines that return to the enterprise after connecting remotely. A well-designed experiment studying a small pilot MTD deployment would let you measure whether or not users encounter more or less malware after implementing MTD.
Case Study: Defending Against Unintentional Insider Threats
In this section, we will walk through a hypothetical scientific experiment related to one important aspect of system security engineering: insider threats. This experiment explores the risk of unintentional insider threat in a corporate setting. Though they can be just as damaging as intentional insiders who deliberately and maliciously intend to cause harm, unintentional insiders are those employees who accidentally or inadvertently expose the business to risk, often without even knowing it.
Note
Insider threat is a widely acknowledged and serious security concern for many businesses. The CERT Insider Threat Center at Carnegie Mellon University has been studying the topic, and released a report in 2013 describing “unintentional insider threat” as insider actions or inactions without malicious intent which cause harm or increase the probability of harm.5
The goal of this experiment is to determine if unintentional insiders could harm your particular enterprise, and make the case for specific remediations to better protect the network. Say you work at a financial services company with 500 employees spread across three locations: Boston, Denver, and Tokyo. The company handles sensitive financial information and any data breaches would cause significant harm to clients and your company. You don’t know how often unprotected sensitive information leaves the company on employee devices, so you’re interested in whether data loss prevention (DLP) technology could help mitigate this risk. You form a hypothesis as follows:
Data loss prevention software would protect the enterprise by discovering 90% of outgoing email messages containing unprotected sensitive company data.
This hypothesis is a bit different from some other case studies that were presented. The hypothesis seeks to understand the benefit of taking an action: adding DLP to the environment. The tests will help demonstrate whether this action will result in the hypothesized outcomes. This is clearly a very narrow, technology-focused question that ignores the benefits of other mitigations to insider threat, including complementary approaches such as user education and awareness.
Tip
“One size fits all” approaches to insider threats may be inappropriate even inside a single company or organization. For example, you may wish to tailor solutions to certain individuals or business units such as stock traders in a financial services company. High risk tolerance is desirable and valued in some circumstances, so insider threat education and awareness strategies should avoid inappropriately stifling the employees in those circumstances.
To measure the benefit of DLP, you will need a control group of users who do not use it. However, you will need ground-truth data about what sensitive information those users are storing and transmitting that might have been identified by DLP. There are at least three options: construct an artificial emulated environment where you monitor simulated real-world activity, use questionnaires with a representative sample of real-world employees of self-reported activity, or review users’ real-world activity yourself (e.g., looking at email on the mail server—with or without their knowledge). Assume you pick the last option, to review the email of 10 users on the mail server for one week without notifying them.6 You discover that 30% of messages contain sensitive company data.
Now you want to evaluate a commercial DLP solution. After installing and configuring the software to detect your sensitive information, you need to gather data. As with the control group, you have choices about where and how to collect data. In this case, it would be wise to measure how the DLP software works for the same users and same email data as you manually examined. This approach enables you to definitively identify true positives (DLP correctly identified sensitive data), false positives (DLP incorrectly identified sensitive data), and false negatives (DLP missed sensitive data). At the end of the week, you find that DLP found that 28% of messages contained sensitive company data, with 2% false negatives and 0% false positives. Clearly, you have confirmed the hypothesis that DLP can discover 90% of the sensitive data in email for this small sample.
Note that we have detected sensitive data in outgoing email but we have not determined whether the sender’s intent was malicious or an unintentional risk. Intent is difficult to measure. While you could alert the email sender that his message contains sensitive data and ask him if he wants to proceed, this is unlikely to dissuade malicious insiders. Some DLP solutions allow you to automatically route emails with sensitive data to an email gateway that will automatically encrypt the message. You may be able to construct a follow-on experiment that measures the percentage of messages violating a policy of only sending encrypted emails to known, verified recipients.
How to Find More Information
Scientific results in security engineering appear in all kinds of cybersecurity solutions, even if they remain hidden from most users. A recent job opening at Google for Information Security Engineer included the responsibility to “conduct research to identify new attack vectors against Google’s products and services” and one for a Product Security Engineer at Facebook said: “You will be relied upon to provide engineering and product teams with the security expertise necessary to make confident product decisions. Come help us make life hard for the bad guys.” Advances and scientific results are shared with the public at conferences such as the IEEE/IFIP International Conference on Dependable Systems and Networks (DSN) and the Network and Distributed System Security Symposium (NDSS). There is an annual Workshop on Moving Target Defense in conjunction with the ACM Conference on Computer and Communications Security (CCS).
Conclusion
System security engineering requires cybersecurity science that uses cross-disciplinary skills and tools. The key concepts and takeaways from this chapter are:
Science in this domain is useful for testing hypotheses about how the system will react and for helping to measure the security impact of your engineering choices, providing insights about how to improve system-level security.
Regression analysis is a widely used data analysis technique for estimating the relationships among variables. Regression is used to predict the future values of the dependent variable.
Moving target defense is a concept of routine change in a system or environment to reduce attackers’ window of opportunity because, from their perspective, their targets change “randomly” over time.
In a hypothetical case study, we evaluated the hypothesis that data loss prevention software would protect an enterprise by discovering outgoing email messages containing sensitive company data.
References
Ross Anderson. Security Engineering: A Guide to Building Dependable Distributed Systems (Indianapolis, IN: Wiley, 2008)
Richard Cook. How Complex Systems Fail (1998)
John Fox and Sanford Weisberg. An R Companion to Applied Regression, Second Edition (Thousand Oaks, CA: Sage, 2011)
Jay Jacobs and Bob Rudis. Data-Driven Security: Analysis, Visualization and Dashboards (Indianapolis, IN: Wiley, 2014)
Thomas P. Ryan. Modern Regression Methods, 2nd Edition (Indianapolis, IN: Wiley, 2009)
Adam Shostack. Threat Modeling: Designing for Security (Indianapolis, IN: Wiley, 2014)
1 J. H. Saltzer and M. D. Schroeder. “The protection of information in computer systems,” Proceedings of the IEEE, vol. 63, no. 9, pp. 1278–1308, Sept. 1975.
2 T. Yen, V. Heorhiadi, A. Oprea, M. Reiter, A. Juels. “An Epidemiological Study of Malware Encounters in a Large Enterprise.” In ACM Conference on Computer and Communications Security, 2014.
3 George E. P. Box and Norman R. Draper. Empirical Model-Building and Response Surfaces (Wiley, 1987).
4 See also, the Chaos Monkey source code.
5 CERT Insider Threat Team. Unintentional Insider Threats: A Foundational Study. Software Engineering Institute, May 2013
6 Of course, this action is legal and consistent with the “Consent to Monitor” clause in your Employee Handbook, and approved by management and legal counsel.