
Chapter 6. Situational Awareness and Data Analytics
This chapter focuses on the application of science to cyber situational awareness, especially using big data. Awareness and understanding of what is happening on the network and in the IT environment is an important goal for infosec professionals because it allows us to confirm our security goals and quickly identify and respond to unanticipated and predetermined events. Yet, situational awareness is elusive. Our perception of cyber security is assembled from many data sources, not all of which are digital. If you want to know how IT is working in a hospital, you’re as likely to know of an outage from users as from an automated email alert.
Situational awareness can come from information that is trivial or extraordinarily complex. To be sure that your web server is up, an automated process could simply scan it every minute and alert an admin when the scan fails. These kinds of binary checks—is it up or down?—are quite useful. Slightly more sophisticated checks come from counting. For example, the firewall seems to be dropping 90% of outbound traffic—I wonder why? Despite their simplicity, both of these types of checks, binary and counting, may still benefit from scientific experimentation.
You almost certainly need no help getting enough data about your network. There is little debate about the explosive growth of data in recent years and into the future. Humans are creating more and more digital artifacts like pictures, videos, and text messages. We are also creating technology that generates more and more digital information, from smartphones to telescopes. “Detecting misuse is also one area where the application of modern data-science practices may shine…,” said the 2015 Verizon Data Breach Investigations Report. “All you need is data, features, and math.” In cybersecurity, we often focus on analyzing machine data like server logs, transaction logs, and network logs. Researchers such as Roy Maxion at Carnegie Mellon University are using scientific experiments to look at new data sources, like the timing of keystrokes, that might help provide new sources of situational awareness for questions including “How sure are we that Bob is the one using the computer?”
An Example Scientific Experiment in Situational Awareness
For an example of scientific experimentation in situational awareness, see the paper “NStreamAware: Real-Time Visual Analytics for Data Streams to Enhance Situational Awareness” by Fischer and Keim.1 In the following abstract, you can see a brief summary of a two-part software package that provides situational awareness using visualizations of summarized data streams. The implied hypothesis could be that “stream slices presented in a visual analytic application will enable a user to more effectively focus on relevant parts of the stream.” These developers evaluated their solution with two case studies, one to demonstrate its usefulness in detecting network security events in an operational network and another with publicly available data from the 2014 VAST Challenge.
One important consideration to tool development is that users will probably use it in ways you didn’t intend or foresee. The designers of NStreamAware showed two different use cases: network traffic and social media traffic. It is common and encouraged for researchers to think about use cases beyond the scope of the specific and intended use. By showing or describing the potential for extended uses of your scientific results or tools, you demonstrate the generality and usefulness of the solution. Some scientists call this “broader impact” to include benefits to other fields of science and technology.
Abstract from a situational awareness experimentThe analysis of data streams is important in many security-related domains to gain situational awareness. To provide monitoring and visual analysis of such data streams, we propose a system, called NStreamAware, that uses modern distributed processing technologies to analyze streams using stream slices, which are presented to analysts in a web-based visual analytics application, called NVisAware. Furthermore, we visually guide the user in the feature selection process to summarize the slices to focus on the most interesting parts of the stream based on introduced expert knowledge of the analyst. We show through case studies, how the system can be used to gain situational awareness and eventually enhance network security. Furthermore, we apply the system to a social media data stream to compete in an international challenge to evaluate the applicability of our approach to other domains.
The researchers describe their goal as an attempt to address the general problem of streaming data. “The challenge in this field is also to merge and aggregate heterogeneous high velocity data streams…,” they write. “The ultimate goal allows the analysts to actually get an idea what is going on in a data stream to gain situational awareness.” Others might have approached the problem by running analytics on a stored collection of data such as NetFlow records. In fact, it can seem confusing to figure out why a scientist took a particular approach or what led her to consider a certain hypothesis. As a researcher, I’ve learned that people are most excited about scientific results that apply to them, and that knowing what applies to them requires understanding their situation and challenges. Unexpected leaps in science can seemingly come from nowhere, but most scientific advances are incremental. As a practitioner, you have a unique advantage because you see and experience the work environment day-to-day. Your need to solve problems, combined with the curiosity to explore how or why things work, will produce a constant stream of testable hypotheses.
Want to get started with queries against large volumes of NetFlow? Here’s an approach that uses NetFlow records stored in a Hadoop Distributed File System, the popular framework for distributed storage, and queries with Apache Hive, software for querying datasets in distributed storage:
Add NetFlow records to HDFS.
[~] hadoop fs -mkdir /user/hadoop/data/netflow
[~] hadoop fs -put /netflow/* /user/hadoop/data/netflow
Create and populate a table in Hadoop using the data you just added.
[~] hive

hive> create external table netflow (date1 string, date2 string,
      sec string, srcip string, dstip string, srcport int,
      dstport int, protocol string) row format delimited
      fields terminated by ',' lines terminated by '
'
      stored as textfile location '/user/hadoop/data/netflow';
Query the table using Hive. Consider some experiments to compare the query times for using Hive compared to your current solution.
hive> select * from netflow where srcip='10.0.0.33' limit 1;
OK
2015-06-10 22:14:07 2015-06-10 22:14:08 0.000 10.0.0.33 10.0.0.255 138
138 UDP
Time taken: 0.052 seconds, Fetched: 1 row(s)
You can imagine the richness that would come by adding other data sources, such as firewall, IDS, antivirus, database logs, and industry-specific logs like wire transfers and credit data. This is exactly what Zions Bancorporation did by moving three terabytes of data a week to Hadoop and MapReduce, decreasing query time from 20 minutes or more down to about one minute.2
Experimental Results to Assist Human Network Defenders
The goal of cybersecurity tools is to help humans carry out a particular function. We build tools to help us do our jobs faster, more effectively, and more safely. Automation is key to keeping up with the task volume we would otherwise have to attend to, and we now trust automated systems to act—and sometimes make decisions—on our behalf. Different organizations, countries, and cultures have different tolerances about the type and scope of automated responses. One organization may ignore unauthorized login attempts to the corporate VPN server, another may automatically blacklist the offending IP address or even scan it back.
One example where data analytics can aid humans with situational awareness is risk analysis. Nuanced questions such as “How much cyber-related risk are we accepting today?” are nontraditional for most companies but are enabled by advances in data analytics and machine learning. Interset is a Canadian company with the tagline “The science of threat detection.” Interset sells a commercial solution that collects enterprise data and uses behavioral analytics for threat analysis. It writes in a whitepaper, “Big Data & Behavioral Analytics Applied to Security,” about the mathematical model for behavioral analytics that it developed and implemented, which aggregates data about activities, users, files, and methods. End users can consume the results from these analytics with visual illustrations like the one in Figure 6-1.
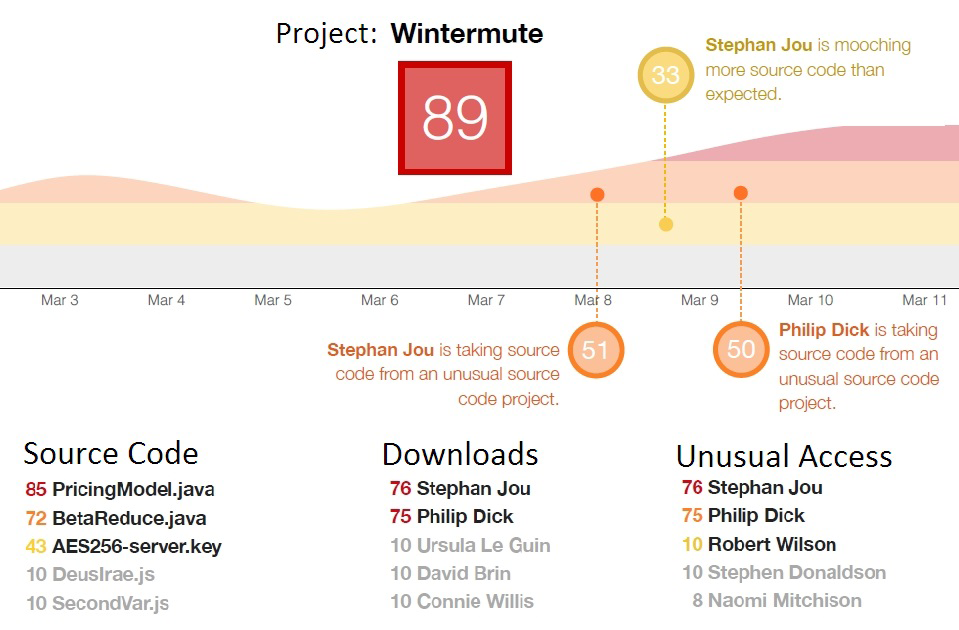
Figure 6-1. Interset visualization of risky behavior using behavioral analytics
Calculating cyber risk is complicated and not well understood today. You could conduct many scientific experiments to develop a risk equation that works for you. You might say “the more customer data we store in the database, the higher the risk that an attacker will try to steal the data.” There are a great number of variables that affect this hypothesis including user training and countermeasures protecting the data. It would be extraordinarily complex to evaluate all the influential variables, but you can evaluate individual ones. Interset considers four factors (user, activity, file and method) in its model for behavioral risk. Using a ground-truth realistic dataset (your real network is unadvised), you could design your own risk equation and experimentally test to see how well it works.
Cognitive psychology tells us that humans aren’t very good at judging probability or frequency of events. Given all the machines and users in your network, for example, which one is most likely to be attacked? Which one, if attacked, would cause the most downtime? The most financial impact? When Amazon.com went down in 2013, people speculated that they lost between $66,000−$120,000 per minute.
Drew Conway, author of Machine Learning for Hackers, describes data science as the intersection of hacking skills (e.g., file manipulation, algorithms), knowledge of math and statistics, and substantive expertise (Figure 6-2). While there is interesting science in each overlapping area, practical motivating questions and hypotheses come from substantive expertise, the grounding in the important real-world problems of a domain like cybersecurity. You don’t necessarily need to possess all of these skills yourself. A team of three people, each with one skill area, can collaborate and produce strong results. Say you are a subject matter expert in DNS security and want to study the use of domain generation algorithms (DGAs), dynamically calculated Internet domain names used in malware like Conficker instead of hardcoded, static URLs for command and control. If you were monitoring DNS queries leaving your network, could you determine which ones came from humans and which came from malware with DGA? With the help of a statistician and a programmer you could calculate the distribution of alphanumeric characters in each DNS query and try to detect and categorize human-looking and algorithmically generated domains. This situational awareness could help identify malware in your network or explain other sources of nontraditional DNS traffic.
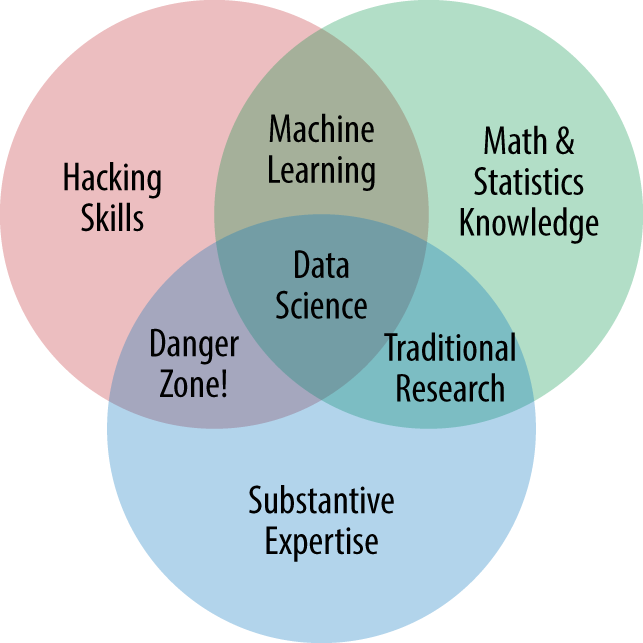
Figure 6-2. Drew Conway’s data science Venn diagram
No matter which combination of skills you possess for data science, machine learning is one of the broad fields you should be familiar with as you conduct tests and experiments for cybersecurity science. Machine learning offers features that nicely match the problems associated with situational awareness. The next section will summarize the important aspects of machine learning and how it might assist your scientific explorations.
Machine Learning and Data Mining for Network Monitoring
Machine learning is a scientific discipline, a multidisciplinary subfield of computer science, and a type of artificial intelligence. Speech recognition like Siri and Google now use an approach to machine learning (called neural networks) to enable machines to parse and understand human speech. In the past, computer scientists used static pattern-matching rules to parse data. Algorithms for machine learning, on the other hand, learn because their performance improves with experience without being explicitly reprogrammed. The more audio that a speech recognition algorithm processes, the more accurate it becomes. Machine learning is good at recognizing similar or variant things, not at identifying brand-new things. And remember, there is no one-size-fits-all machine learning solution, and the algorithms are only as good as the data they rely on.
Machine learning has many applications in cybersecurity solutions, from fraud detection to identifying high-risk employee behavior to intrusion detection and prevention. Here’s a specific use case. Twitter cares a lot about detecting and preventing fake accounts, compromised accounts, and spam. Twitter might think that one way to detect fake accounts is by the number of tweets the account sends, and it could use machine learning to test that hypothesis. However, machine learning might reveal unexpected features of fake accounts, such as the mean time between tweets.
The field of machine learning is much too broad and complex for more than concise coverage here, but hopefully in this simple introduction you will come to understand its place in cybersecurity science and situations when machine learning might benefit you. There are many different machine learning techniques, so it is important to understand the ideas behind the various techniques in order to know how and when to use them. There is even a science to machine learning itself, and it is important to accurately assess the performance of a technique in order to know how well or how badly it is working.
In Chapter 2 we first looked at exploratory data analysis and suggested that visually looking at data could offer insights. Clustering, one approach to machine learning, is one way to look at data and to see if some of the data points are more similar to each other (grouped together in a cluster) than others. Clustering is one technique of unsupervised learning. That is, you or the machine learning algorithm are trying to find structure in unlabeled data. For example, finding clusters of malware families using only the executable and no other metadata could be accomplished with clustering. Classification, on the other hand, is a supervised learning approach. This task involves the use of labeled training data to teach an algorithm how to classify new examples. This technique is frequently used in image recognition where you tell the algorithm “these are 100 pictures of human faces” and ask “do you think this other picture is a face?”
As an experiment, say you want to cluster 15,000 possibly infected IP addresses. Organizing malware into homogeneous clusters may be helpful to generate a faster response to new threats and a better understanding of malware activities, since homogeneity in a cluster can be linked to similarity. As a data point, each infected IP address has associated features, some of which will be useful and others not. Using a chi-square test for feature selection, a statistical test used to test the independence of two events, you narrow down to 15 relevant features. Then, using the k-means clustering algorithm you find five distinct clusters of similarity among the infected hosts. k-means is an extremely popular clustering algorithm that attempts to partition data points into some number of clusters (k of them) in which each data point belongs to the cluster with the nearest mean. The algorithm does this by picking points that have a good chance of being in different clusters, and then assigning the other data points to the closest cluster based on a calculation of the distance of that point to the center of the cluster.
Tip
Looking for sample data to experiment with machine learning? There are 320 datasets (including 91 in computer science/engineering) in the UC Irvine Machine Learning Repository.
One of the fastest ways to get started with machine learning is using R and the RStudio IDE. Despite a steep learning curve, R provides a free, high-quality environment for data analysis. In addition to a large number of functions, included features such as graphing are quite useful. Similar popular machine learning software includes Weka, Apache Mahout, and Apache Spark.
With the spread of cloud computing, machine learning is now available as a service! Azure Machine Learning and Amazon Machine Learning require little cost and expertise and offer enormous scalability. Both of these offerings guide users through questions that drive the process. Amazon Machine Learning currently supports three types of machine learning categories: binary classification, multiclass classification, and regression. Azure Machine Learning offers algorithms in regression, classification, clustering, and anomaly detection. Its algorithm cheat sheet can guide you through selecting the appropriate algorithm based on the kind of question or data you have (Figure 6-3).
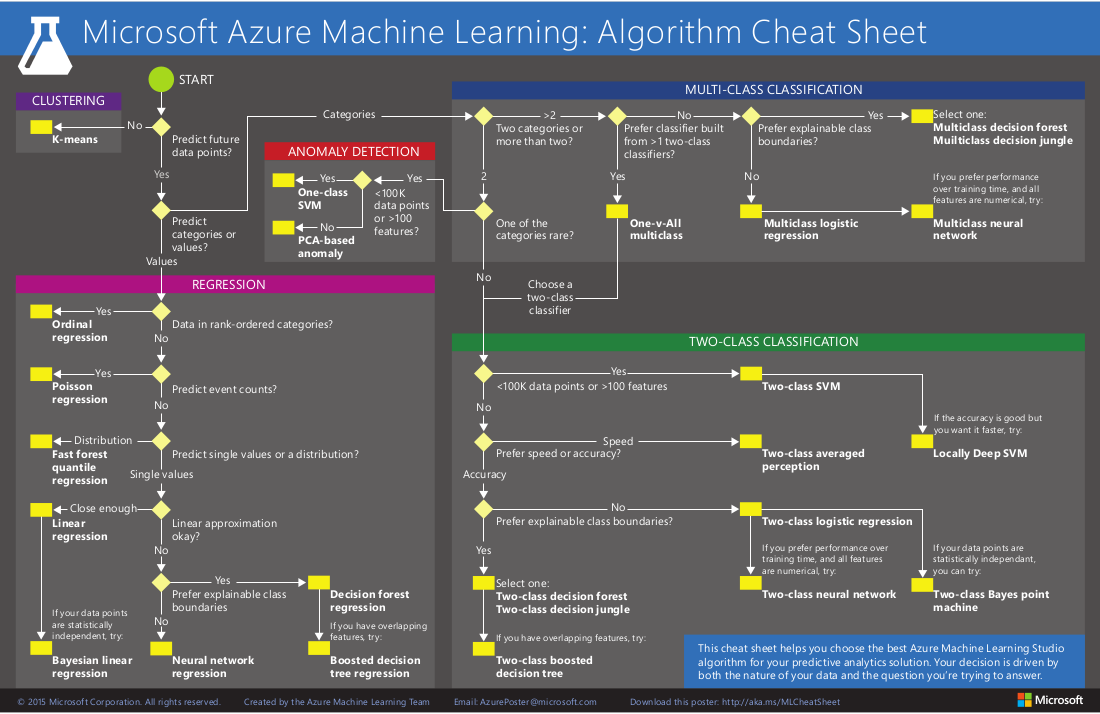
No one algorithm in machine learning is appropriate for all problems; the chosen algorithm has to fit the problem. In mathematical folklore are two so-called no free lunch theorems that state if an algorithm performs well on one problem (or class of problems), then it pays for that with degraded performance on the set of all other problems. The takeaway is that because no algorithm is better than all others, you need to use as much problem-specific knowledge as possible in selecting an algorithm.
Case Study: How Quickly Can You Find the Needle in the Haystack?
Malicious activity in a computer network is almost always like a needle in a haystack. The bad activity represents a very small percentage of total activity, and may even actively try to camouflage itself. A great deal of research, product development, and training have gone into this problem over time, and we have still not solved it. A 2010 DARPA test of six commercial security information and event management (SIEM) systems reported that no system could identify “low and slow” attacks, those with low activity volumes that occur slowly over time.3 In fact, attack detection that we could call finding needles was the “single weakest area evaluated.” How could you use scientific experimentation applied to network data to find more needles?
Say you use Nagios, the popular open source network monitoring program, for situational awareness of your moderately sized network and it generates 5,000 events per week. Many of those correspond to normal infrastructure events, and your administrators are overwhelmed and ignore or filter the notifications. What if you could add value to your security operations by adding analytics to learn to detect anomalies and uncover “low and slow” malicious activity? This sounds like an opportunity for a summer intern that you can mentor through the scientific discovery process!
A New Experiment
Consider a hypothetical experiment to explore adding data analytics to Nagios that would automatically learn and detect outliers. Your intuition is that the network performs in a generally regular manner, and that anomalies to the norm can be detected even if they occur “low and slow.” Here is a hypothesis:
Adding machine learning to Nagios will find more true positive anomalies than Nagios and human analysts alone.
In this experiment, we must show that machine learning, the dependent variable, increases the number of anomalies found. This kind of experiment is difficult to conduct on live networks because you do not definitively know how many anomalies there are. A better choice for this experiment is to simulate a live environment but use data for which we know the precise number of anomalies. In the control group are Nagios and human analysts, and we must measure how many anomalies they can discover.
Time is an interesting factor in this experiment. You need to bound the time given to the human analysts. However, the humans bring years of training and experience, and the machine learning algorithms require time and experience to learn what normal and anomalous activity looks like in the data. It seems only fair that the algorithm should be allowed some training time without incurring a penalty in the experiment.
There are many ways to add machine learning to Nagios. As a developer and designer, you’ll have to decide whether to use an algorithm that learns incrementally as new data streams by, or to periodically retrain the algorithm with a batch algorithm. Both are potentially interesting, and might yield experiments to compare the approaches. Your choice depends in part on how quickly you need new data to become part of your model, and how soon old data should become irrelevant to the model. These would also make for interesting experimental tests. Assume that you decide to implement an incremental algorithm and call the new solution NagiosML.
The execution of the experiment might go as follows. Five experienced network analysts are given one hour with Nagios and the test data and asked to identify the anomalies. Say there are 10 anomalies and the analysts find 7 on average. Then we train NagiosML with training data that contains 10 different anomalies. Once trained, five different network analysts are given an hour with NagiosML and the test data with which they also attempt to identify the anomalies. Say this time the analysts find eight on average but also two false positives. We have accepted the hypothesis as stated.
Nevertheless, the practical implications of the result are also important. The hypothesis did not ask to consider false positives, but in reality they cause added work to investigate. Users will have to decide whether finding an extra anomaly outweighs two false positives. You may also consider tweaking the algorithm and re-running the experiment to try to improve the detection rate and lower the error rate.
How to Find More Information
Advances and scientific results are shared at cybersecurity and visualization workshops and conferences. The first International Conference on Cyber Situational Awareness, Data Analytics, and Assessment (CyberSA) took place in 2015. Importantly, situational awareness is not limited to cybersecurity, and we have much to learn from other fields, from air traffic control to power plants to manufacturing systems.
Conclusion
This chapter covered cybersecurity science for situational awareness and data analysis. The key takeaways are:
Cybersecurity science can guide experiments that evaluate how well a solution is helping human network defenders achieve a particular goal.
It takes a combination of skills and expertise to conduct experiments in data science, and a collaborative team can produce strong results.
Machine learning is good at recognizing similar or variant things and has many applications in cybersecurity solutions, from fraud detection to identifying high-risk employee behavior to intrusion detection and prevention.
We set up an experiment to evaluate the hypothesis that adding machine learning to Nagios network monitoring software would find more true positive anomalies than Nagios and human analysts alone.
References
Richard Bejtlich. The Practice of Network Security Monitoring (San Francisco, CA: No Starch Press, 2013)
Michael Collins. Network Security Through Data Analysis: Building Situational Awareness (Boston, MA: O’Reilly, 2014)
Peter Harrington. Machine Learning in Action (Shelter Island, NY: Manning Publications, 2012)
Gareth James, Daniela Witten, Trevor Hastie, Robert Tibshirani. An Introduction to Statistical Learning: with Applications in R (Heidelberg: Springer, 2013)
Chris Sanders and Jason Smith. Applied Network Security Monitoring: Collection, Detection, and Analysis (Waltham, MA: Syngress, 2013)
Ian H. Witten, Eibe Frank, Mark A. Hall. Data Mining: Practical Machine Learning Tools and Techniques (Waltham, MA: Morgan Kaufmann, 2011)
1 Fabian Fischer and Daniel A. Keim. “NStreamAware: Real-Time Visual Analytics for Data Streams to Enhance Situational Awareness.” In Proceedings of the IEEE Conference on Visual Analytics Science and Technology (VAST), 2014.
2 Cloud Security Alliance (CSA) Big Data Working Group. Big Data Analytics for Security Intelligence, September 2013.
3 SPAWAR for DARPA/I2O. Independent Validation and Verification (IV&V) of Security Information and Event Management (SIEM) Systems: Final Report, 2010.