
Appendix A. Understanding Bad Science, Scientific Claims, and Marketing Hype
There is a pop song from the 1980s called “She Blinded Me with Science” that plays on the notion of deliberately hiding truth behind real or made-up science. In this book, I talked about the amazing benefits of science to everyday cybersecurity. Unfortunately, not every scientific claim that you see in the news or from vendors is as reputable as it should be. This appendix will look briefly at the ways in which people are misled, manipulated, or deceived by real or bogus science, scientific claims, and marketing trickery.
Scientific skepticism is a healthy practice of questioning scientific results and claims. In particular, it often means discerning whether the conclusions are the result of the scientific method and are supported by empirical research. This can be very challenging even in the best circumstances, and especially difficult when advertisers and marketers might be appealing to your emotions instead of rationality.
Vendors and marketers sometimes appeal to people’s scientific gullibility. As discussed early in the book, people respect and trust science. Unfortunately, people can also be over trusting and thus deceived by scientific claims if they don’t possess the experience, healthy suspicion, and rational thinking. One academic study actually found that people were swayed by advertisements with graphs and formulas just because they seemed scientific:1
The appearance of being scientific can increase persuasiveness. Even trivial cues can create such an appearance of a scientific basis. In our studies, including simple elements, such as graphs (Studies 1–2) or a chemical formula (Study 3), increased belief in a medication’s efficacy. This appears to be due to the association of such elements with science, rather than increased comprehensibility, use of visuals, or recall. Belief in science moderates the persuasive effect of graphs, such that people who have a greater belief in science are more affected by the presence of graphs (Study 2). Overall, the studies contribute to past research by demonstrating that even trivial elements can increase public persuasion despite their not truly indicating scientific expertise or objective support.
Graphics can help explain and clarify data, but don’t be swayed by visualizations alone. Cybersecurity “attack maps,” for example, might not show the quality data you’d expect. Instead, they may be populated by “beautifully animated yet unfiltered, unverified, non-prioritized event data that while visually compelling is worthless from a security perspective,” says one CEO of an Internet security company.2
Note
BAHFest, the Festival of Bad Ad-Hoc Hypotheses, which started in 2013 at MIT, is a satirical conference organized by evolutionary biologists for their own entertainment. Speakers present serious-sounding talks about bogus, made-up (but funny) scientific claims.
In the following sections, we will look at specific ways of communicating scientific results that you should be aware of as you evaluate cybersecurity products and services.
Dangers of Manipulative Graphics and Visualizations
Chapter 12 explored ways to create and scientifically evaluate visualizations. It also looked at a few cautionary notes, such as how color can carry cultural or symbolic significance. Graphics and visualizations are an important mechanism for communicating scientific results and complex data. Visual communication can supplement and sometimes simplify complex and dense text. Humans may even process visual information faster than text. But viewers beware, visualizations aren’t always what they seem.
Bad visualization choices can do more harm than good. Viewers are manipulated by bad visualizations because of mental shortcomings and perception, not necessarily because the visualization is incorrect. Look at Figure A-1. It is nearly impossible to distinguish the distinctions in size between the pie slices. The visualization here is probably unhelpful to most viewers.
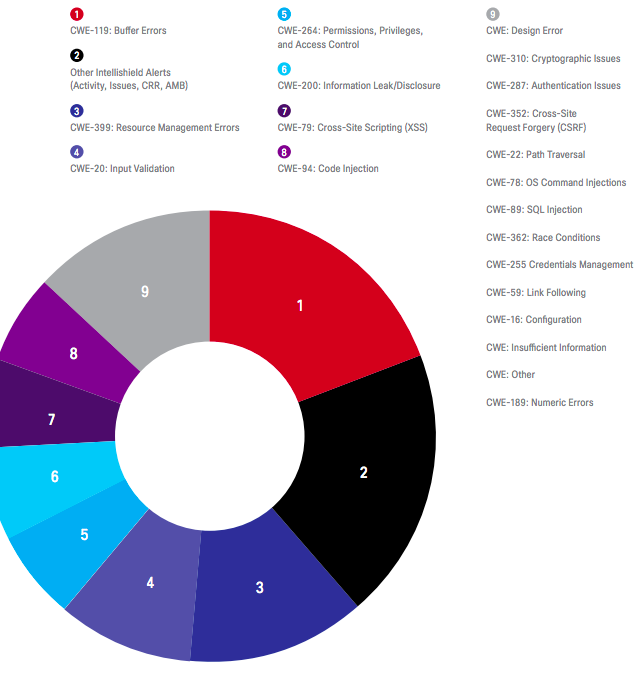
Figure A-1. An example of a bad pie chart
Figure A-2 illustrates other visualization choices. The pie charts on the left offer little visual aid because it is difficult to see any difference between them, even though they are displayed in such a way that the viewer is expected to compare them. The bar charts are easier to compare, though they lack axis labels, a key feature.
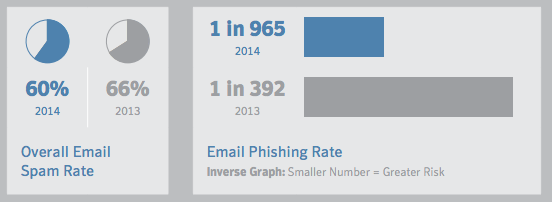
Figure A-2. An example of visually challenging visualizations
Some graphics are manipulative because of the data they omit. Look at Figure A-3. First, the image is supposed to support the claim that “Ad-Aware significantly outperforms our free peers.” That short statement uses two words, “significantly” and “peers,” that are not defined and which potentially affect the interpretation of the claim. The graphic shows two peers, for example. The viewer could assume (incorrectly) that there are no others missing from the comparison. The data in the visualization also raises questions. If 393 malware samples were tested, how were those files chosen? Were they randomly selected or hand-picked for easy detection by this product? What was the false positive rate? We are told how many files each product “missed,” presumably indicating false negatives, but the antivirus products could have also incorrectly identified many benign files as malicious. As you evaluate cybersecurity products and as you report data about your own products, be aware of what the conclusions and graphics are and aren’t telling you.
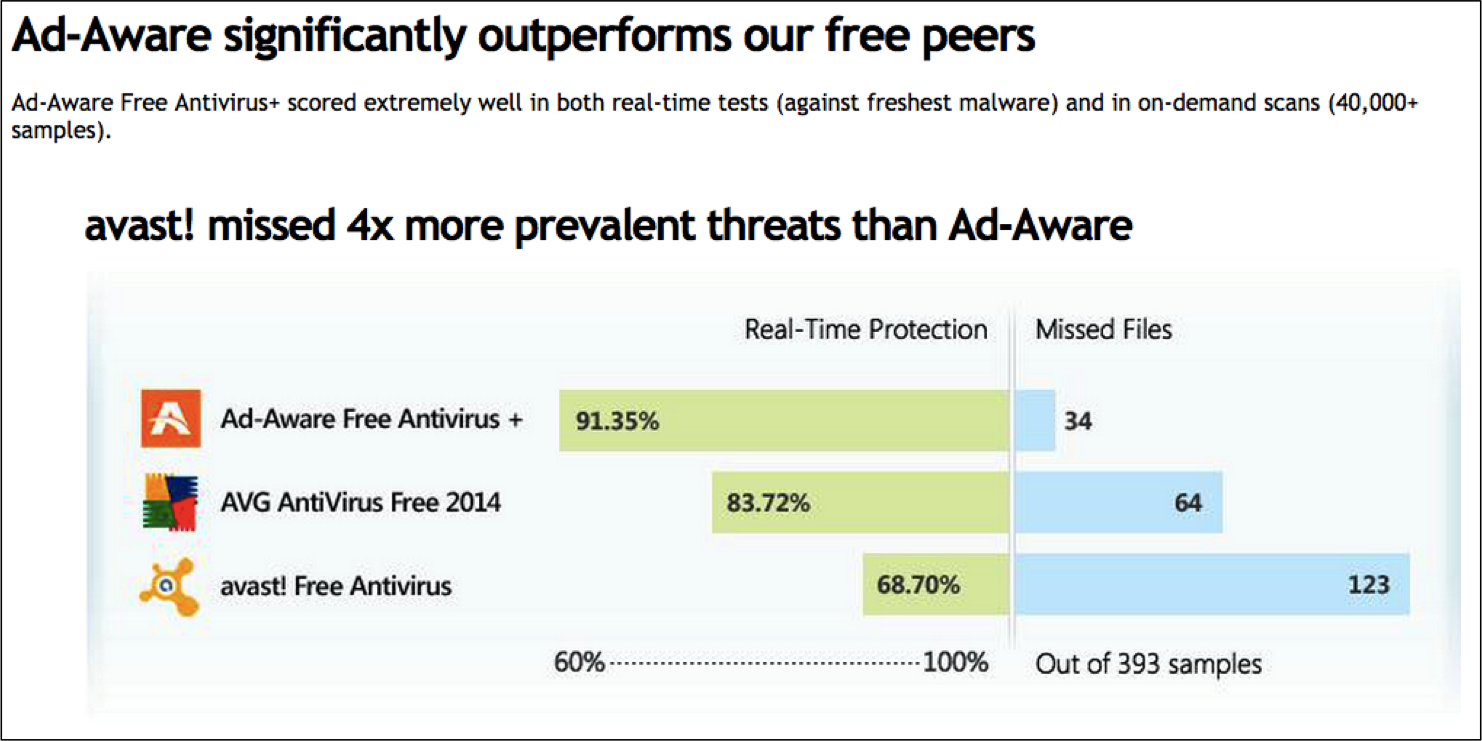
Figure A-3. Ad-Aware by Lavasoft in-house performance results
Recognizing and Understanding Scientific Claims
In 2004, Popular Science published an article documenting one writer’s encounters with science claims in a typical day. He counted 106, starting with his breakfast cereal box. You encounter a lot of scientific claims because advertising is everywhere and advertisers are in the business of making claims. Recognizing the positive spin that advertisers naturally seek is important when you have to make a decision about whether to use, buy, or believe that product. Having read this book, you are already ahead of the curve. According to the National Science Board’s 2002 study “Science and Engineering Indicators,” only one-third of Americans can “adequately explain what it means to study something scientifically.”
Scientific claims may be easy to recognize. Here are some examples:
Tests show that Product A can detect 97% of sophisticated malware.
Our forensic imaging software is twice as fast as competing products.
Company B’s fingerprint reader is 99.9% accurate.
Alice Corp. is better at detecting insider threats than Bob Corp.
Nine out of ten websites we scanned on the Internet are vulnerable to the XYZ attack.
Scientific claims tend to be obvious because they are being used to promote or sell a product or service.
One of the marketing phrases that immediately raises flags for me is when something is “scientifically proven.” This phrase is misguided because scientific conclusions are never absolutely certain. All empirical evidence has some margin of error, however small. Furthermore, scientific models don’t have to be 100% correct to be valid. It is dangerous to believe that the scientific truth we believe now cannot be updated with new evidence or new interpretations of the evidence.
There is a well-known book by Darrell Huff titled How to Lie with Statistics (1954) that documents ways in which numbers and statistics are sometimes presented to support a lie. As a trivial example, consider the ambiguous meaning of the word “average.” The description of a scientific result should use a precise mathematical word: mean, median, or mode. While all three describe the data truthfully, choosing one and calling it the “average” may be misleading. For example, someone might say “the average company lost $10 million due to cybersecurity compromises last year.” What does that mean? The answer depends greatly on the number of companies sampled and the distribution of the values. In Table A-1, the “average loss” could be reported as $750,000 (median), $1 million (mode), or $20 million (mean).
| Company | Financial Loss From Cyber Attacks in 2014 |
|---|---|
| Victim #1 | $0 |
| Victim #2 | $500,000 |
| Victim #3 | $500,000 |
| Victim #4 | $1,000,000 |
| Victim #5 | $1,000,000 |
| Victim #6 | $100,000,000 |
One company issues an often-quoted report on the global cost of data breaches. The report includes this poignant disclaimer of a reason to be skeptical of the results: “Our study draws upon a representative, non-statistical sample of U.S.-based entities experiencing a breach involving the loss or theft of customer or consumer records during the past 12 months. Statistical inferences, margins of error and confidence intervals cannot be applied to these data given that our sampling methods are not scientific [emphasis added].” There may be other reasons to trust this report, but prudent readers should make a calculated and cautious choice.
You should be especially skeptical about vendor-sponsored reports, since the vendor has a financial incentive to make its product look good. There may be vendors that you trust to report unbiased facts even if those facts don’t support the vendor. It is still wise to be cautious and ask yourself what, if anything, the vendor has to gain by the data. FireEye, a respected cybersecurity company, had this headline on its website: “FireEye NX Series Achieves 99% Detection Rate.”3 Below the headline it said “Third-party vendor, Delta Testing, tested a number of vendors using real-world advanced malware. Read the full report to find out the results.” If you clicked on the link and read the report cover-to-cover, you could find this disclaimer on the last page: “FireEye sponsored the execution of this test and chose the vendors selected.”4
Surveys are a fertile ground for abuse. Among the red flags you should watch for are surveys that fail to disclose the survey methodology, sample size, and margin of error. A survey found that a surprising 89% of infosec professionals think that DDoS attacks are the biggest threat to their company. Here is how selection bias might skew that statistic by making it larger than reality. You start by buying an email list from a reputable marketing firm. Your email to the list includes a link to the survey, with a note that respondents must be infosec professionals. You also promise that by completing the survey, the respondent will be entered for a chance to win a $50 gift card. When your survey is over, you may very well have gotten 89% of respondents who say that DDoS attacks are the top threat. However, there is a strong selection bias because the respondents were those who clicked on the email and self-selected as infosec professionals.
In his book and website Spurious Correlations, Tyler Vigen explores various scenarios in which data can be combined in surprising and often humorous ways. He says of himself, “…I do have a love for science and discovery and that’s all anyone should need.” The word “spurious” means fake, bogus, or fraudulent, and the charts on Vigen’s site intentionally illustrate such correlations. Consider, for example, Figure A-4, which charts actual US spending on science, space, and technology (as reported by the Office of Management and Budget) with suicides by hanging, strangulation, and suffocation (as reported by the Centers for Disease Control and Prevention). Because the graphs have a similar shape, it might appear that these unrelated statistics are correlated when in fact they are totally independent.
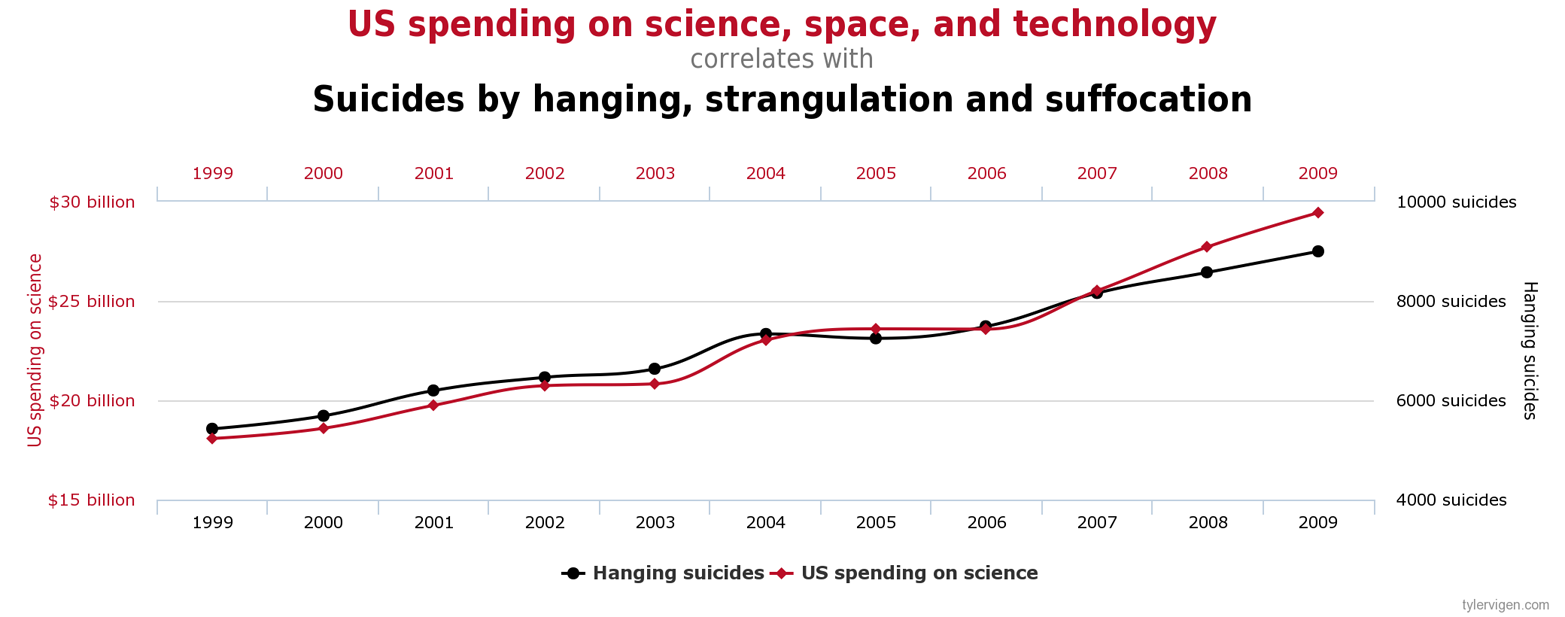
Figure A-4. A spurious correlation of two unrelated statistics
Vendor Marketing
“Attackers have significantly decreased the cost of obtaining sensitive track data.” How often do you see phrases like this one, which appeared in a vendor security report? What does significantly mean here? Marketing strategist David Meerman Scott calls this kind of language “gobbledygook,” including such phrases as “market leading,” “groundbreaking,” and “next generation.”
Look at the press release in Figure A-5. This article describes the results of an evaluation from NSS Labs, an independent security research company. One NSS slogan is “At NSS, we make security a science.” So far, so good. Fortinet describes the product that was tested as an “advanced persistent threats breach detection system” but takes liberty in saying that the product “achieves high rankings for APT threat detection” because NSS never claims that it tests advanced threats, only “real-world” traffic (Fortinet also does not define APT). It is good to see a false positive rate reported, but no false negative rate is given. We aren’t told how many, if any, nonmalicious events were incorrectly identified as malicious.
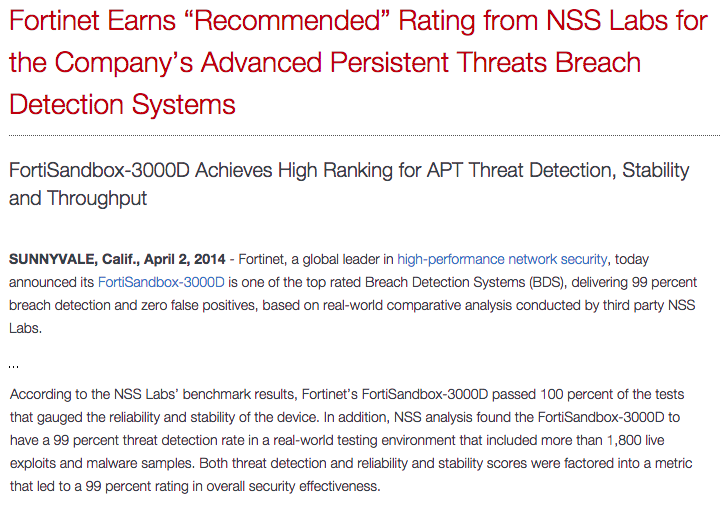
Figure A-5. A Fortinet press release
Let’s assume that salespeople are doing their best to communicate with you, that their use of ambiguous terms or lack of convincing evidence is innocent and isn’t intended to deceive you. The questions in the next section may help you dig deeper and get answers to help you evaluate the quality and trustworthiness of their products or research results. And in the unfortunate case where the salesperson is trying to hide the shortcomings of the product or research, these questions may also help reveal that situation.
Clarifying Questions for Salespeople, Researchers, and Developers
Your experience and expertise are valuable when learning and evaluating new technology. The first time you read about a new cybersecurity development or see a new product, chances are that your intuition will give you a sense for the value and utility of that result for you. As we’ve seen in this appendix, vendors, marketers, even researchers are trying to convince you of something. It can be helpful for you to have some clarifying questions ready which probe deeper through the sales pitch. Whether you’re chatting with colleagues, reading an academic paper, or talking with an exhibitor at a conference, these questions might help you decide for yourself whether the product or experimental results are valid.
Who did the work? Are there any conflicts of interest?
Who paid for the work and why was it done?
Did the experimentation or research follow the scientific method? Is it repeatable?
How were the experimental or evaluation dataset or test subjects chosen?
How large was the sample size? Was it truly representative?
What is the precision associated with the results, and does it support the implied degree of accuracy?
What are the factually supported conclusions, and what are the speculations?
What is the sampling error?
What was the developer or researcher looking for when the result was found? Was he or she biased by expectations?
What other studies have been done on this topic? Do they say the same thing? If they are different, why are they different?
Do the graphics and visualizations help convey meaningful information without manipulating the viewer?
Are adverbs like “significantly” and “substantially” describing the product or research sufficiently supported by evidence?
The product seems to be supported primarily by anecdotes and testimonials. What is the supporting evidence?
How did you arrive at causation for the correlated data/event?
Who are the authors of the study or literature? Are they credible experts in their field?
Do the results hinge on rare or extreme data that could be attributed to anomalies or non-normal conditions?
What is the confidence interval of the result?
Note
In the 1990s, numerous journals in medicine, psychology, and ecology underwent an editorial shift to requiring confidence intervals and discouraging sole reliance on statistical hypothesis testing (such as p values) because authors were routinely misusing and misinterpreting significance tests.5
Are the conclusions based on predictions extrapolated from different data than the actual data?
Are the results based on rare occurrences? What is the likelihood of the condition occurring?
Has the result been confirmed or replicated by multiple, independent sources?
Was there no effect, no effect detected, or a nonsignificant effect?
Even if the results are statistically significant, is the effect size so small that the result is unimportant?
For more red flags of bad science, see the Science or Not blog.
References
Hamid Ghanadan. Persuading Scientists: Marketing to the World’s Most Skeptical Audience (Nashville, TN: RockBench Publishing Corp, 2012)
Noah J. Goldstein, Steve J. Martin, and Robert B. Cialdini. Yes!: 50 Scientifically Proven Ways to Be Persuasive (New York, NY: Free Press, 2009)
Darrell Huff. How to Lie with Statistics (New York, NY: W. W. Norton & Company, 1954)
Alex Reinhart. Statistics Done Wrong: The Woefully Complete Guide, (San Francisco, CA: No Starch Press, 2015)
David Meerman Scott. The New Rules of Marketing & PR, Fourth Edition (Indianapolis, IN: Wiley, 2013)
Michael Shermer. Why People Believe Weird Things: Pseudoscience, Superstition, and Other Confusions of Our Time, (New York, NY: Holt Paperbacks, 2002)
1 Aner Tal and Brian Wansink. “Blinded with science: Trivial graphs and formulas increase ad persuasiveness and belief in product efficacy.” Public Understanding of Science (2014).
2 Paul Vixie, Internet Security Marketing: Buyer Beware.
3 FireEye, How Cyber Attacks Compromise Your Network, retrieved June 1, 2015.
4 Delta Testing, A New Approach to Assessing Advanced Threat Solutions, retrieved June 1, 2015.
5 F. Fidler, G. Cumming, M. Burgman, N. J. Thomason. Statistical reform in medicine, psychology and ecology, The Journal of Socio-Economics 33, 615–630 (2004).