
Chapter 19
Estimating Software Configuration Control and Change Management
Software projects change as rapidly as any product ever conceived by the human mind. Therefore, one of the major challenges of the software industry has been to manage change as efficiently as possible.
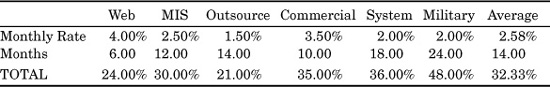
Estimating the work of change management is also important, not only because change management itself can be expensive, but because the rate of change of various software deliverables is a major factor in the accuracy of overall software cost and schedule estimation. Table 19.1 shows historical data on the monthly rates of change for requirements and the cumulative totals of change for six kinds of software projects:
As can be seen from Table 19.1, an average of almost one-third of the final features that are in software applications when they are delivered to clients were not defined in the initial set of requirements.
Every software project changes during development. But the rates of change vary widely from project to project, as do the set of artifacts that are created for the project. In general, estimating change management requires separate estimates for the following variable items:
![]() The set of artifacts (requirements, specifications, code, documents, tests, bugs, etc.)
The set of artifacts (requirements, specifications, code, documents, tests, bugs, etc.)
![]() The rates of change of each artifact
The rates of change of each artifact
![]() The way proposed changes are evaluated and accepted or rejected
The way proposed changes are evaluated and accepted or rejected
![]() The presence or absence of a formal change-control board
The presence or absence of a formal change-control board
![]() The way changes to various artifacts are stored and recorded
The way changes to various artifacts are stored and recorded
![]() The presence or absence of configuration audits
The presence or absence of configuration audits
TABLE 19.1 Monthly Rate of Changing Requirements for Six Application Types
(From end of requirements to start of coding phases)
![]() The tools available for building and controlling versions of the application
The tools available for building and controlling versions of the application
![]() The frequency with which new versions are built
The frequency with which new versions are built
Estimating change management is also a fairly difficult task, because of several unique characteristics of this activity:
![]() Not every software project uses formal change management methods.
Not every software project uses formal change management methods.
![]() Agile projects often use informal change-control methods.
Agile projects often use informal change-control methods.
![]() Not every software project has a change-control board.
Not every software project has a change-control board.
![]() For projects that have change-control boards, their sizes and memberships vary.
For projects that have change-control boards, their sizes and memberships vary.
![]() For projects that have change-control boards, their meetings are intermittent.
For projects that have change-control boards, their meetings are intermittent.
![]() Not every project uses configuration-control automation.
Not every project uses configuration-control automation.
![]() The automated configuration-control tools vary widely in capabilities.
The automated configuration-control tools vary widely in capabilities.
For example, military projects of almost any size usually include formal change management approaches because they are required by various military standards such as DoD 2167A and DoD 973. Military configuration management starts early, during the requirements phase. Once started, change control is continuous and includes intermittent audits of configuration status.
Civilian projects are less likely to utilize formal change management unless the corporation is certified using the ISO 9000–9004 standards or is climbing the SEI capability maturity model above level 2, where change management becomes a standard activity. Civilian configuration control typically starts later than military configuration control, and may support fewer artifacts. Indeed, some civilian projects use only rudimentary configuration control for the source code, and no formal methods at all for specifications, user documents, or other artifacts.
Civilian projects using the new Agile methods have very dynamic changing requirements. Because a client is part of the development team and requirements are worked out on the fly, the monthly rates of change for Agile projects is about 12 percent. Usually, the set of initial requirements for Agile projects define only between 15 and 30 percent of the final features that eventually are included. The other features are defined during subsequent iterations or sprints.
However, civilian systems and embedded software typically uses more thorough configuration control than does information systems software, and often follows formal change management standards, such as IEEE Standard 1042-1987 on software configuration management.
Thus, estimating the nature of change management activity requires a knowledge of the nature of the enterprise, the nature of the project, the size of the application in question, and the forms of change management methods to be utilized.
The Literature on Change Management
There is fairly extensive literature on software change management in both its civilian and military forms. For example, Tim Mikkelsen and Suzanne Pherigo of Hewlett-Packard have published an interesting primer entitled Practical Software Configuration Management (Prentice-Hall, 1997). There are also a number of older books on software configuration control, such as H. R. Berlack’s Software Configuration Management (John Wiley & Sons, 1992).
In addition to standalone books on software configuration control, the topic is also covered in chapters on general software engineering and management principles in such books as Fred Brooks’s classic The Mythical Man-Month (Addison-Wesley, 1974) and Roger Pressman’s Software Engineering—A Practitioner’s Approach (McGraw-Hill, 2005). Note that Roger Pressman’s book has gone through six editions, and each edition adds new material. The latest edition has new data on change management for Agile projects.
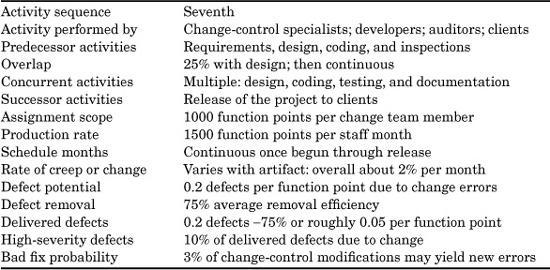
The nominal default values for estimating the activity of software change management or configuration control are shown in Table 19.2.
Once change management and configuration control begin for an application, some aspects of change management are daily events, such as updating records in response to repaired bugs.
Other aspects of change management are intermittent. For example, the change management board may meet at weekly, biweekly, or monthly intervals. The duration of each meeting can run from less than one hour to more than one day.
From time to time on large systems, there may be a configuration audit. Such audits are required for military software and are formal milestones. For civilian projects, configuration audits are not as common and are not as formal when they occur. Variable factors, such as the presence or absence of configuration audits, make estimating change control rather tricky.
TABLE 19.2 Nominal Default Values for Change Management and Configuration Control
In general, large systems of more than 5000 function points in size will utilize very formal change management methods; will have change-control boards; and will have an extensive suite of change management tools that can handle changes to requirements, specifications, code, defects, user documents, and other artifacts.
Software projects between 1000 and 5000 function points may utilize formal change management methods, but often deploy only subsets of the methods used on larger systems. Among SPR’s clients, a significant portion use change management automation only for source code, and handle changes to requirements and specifications in a manual fashion. For projects toward the low end of this spectrum, change-control boards are rare rather than the norm.
At the low end, for small projects of only a few hundred function points or less, formal change control tends to concentrate on source code and is handled by the developers themselves. Formal change-control boards essentially never are used, unless the project is an enhancement to a much larger system.
For very small projects of less than 100 function points with a one-person development team, change control is never formal. Unless change management features are part of the development tool suite, there is seldom any automation utilized.
The overall challenge of software change management was poorly met for many years. The primary change management tools for source code were standalone file-based version control systems that supported code only.
Change management for text specification and planning documents, cost estimates, test libraries, graphics and illustrations, and the inventories of bugs reported against software projects were all performed using only rudimentary standalone tools that often did not communicate or coordinate across domains. Indeed, some projects utilized only source code change-control tools, and handled changes of all other artifacts in an informal, manual fashion.
In recent years, since about 1990, it has been recognized that source code is not the only deliverable that changes. In fact, for many projects source code is not even the major item that changes. For large software projects, there are many more words created than source code and the words change more rapidly! There are also large volumes of bug reports, which need constant surveillance and monitoring during software development and maintenance.
Therefore, modern change management tools, or configuration-control tools as they are commonly called, must be capable of dealing with every kind of software deliverable and artifact, as follows:
![]() Changing requirements
Changing requirements
![]() Changing project plans
Changing project plans
![]() Changing project cost estimates
Changing project cost estimates
![]() Changing contracts
Changing contracts
![]() Changing design
Changing design
![]() Changing source code
Changing source code
![]() Changing user documents
Changing user documents
![]() Changing illustrations and graphics
Changing illustrations and graphics
![]() Changing test materials
Changing test materials
![]() Changing volumes of bug reports
Changing volumes of bug reports
Ideally, the change management tools can use hypertext capabilities to handle cross-references between deliverables so that when something changes, the corresponding places in related material can be highlighted or even modified semi-automatically.
Measuring Software Change
Another recent development in the software world is the newfound ability to understand the economics of changes. For many years, software costs were normalized using lines of code (LOC) as the primary metric. This metric was useless for dealing with the costs of producing text materials, graphics, test cases and all other non-code software artifacts. Therefore, both the development and the modification costs of non-code material were essentially invisible to the software world.
The function point metric can be applied to plans, estimates, specifications, test materials, source code, and all software deliverables. The function point metric has helped enormously in understanding the costs and economic consequences of changes to every software artifact.
Other new metrics such as use case points, story points, object points, or COSMIC function points can also be used to measure rates of requirements change.
In order to discuss the rate at which software deliverables change, it is necessary to know at least approximately how big they are under normal conditions. The function point metric has given the software industry a useful way of normalizing various deliverable items, so that volumes of materials can be discussed using a stable size dimension.
The function point metric is also beginning to be used to assign fairly accurate cost and value amounts to changes. Outsource vendors, for example, are beginning to include cost per function point on sliding scales in contracts, so that new features added late in development have higher charges than function points derived during the actual requirements phase.
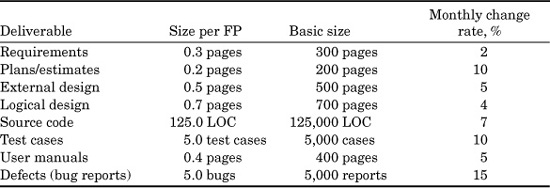
Table 19.3 shows the nominal sizes and rates of monthly change associated with a generic average systems software project of 1000 function points in size. This project can be assumed to use the C programming language.
If the project shown in Table 19.3 were an object-oriented project designed with the unified modeling language (UML) and use cases, the volumes of requirements and design would be roughly the same as the volumes indicated.
The typical calendar time for developing a systems software application of 1000 function points would be about 18 months from the start of requirements to the initial delivery to the first customer.
The overall effort to produce this project would total about 200 person months. The productivity rate can be seen to be five function points per month. Assuming an average burdened salary rate of $8000 per month, the total cost would be $16 million and the cost per function point would be $1600.
TABLE 19.3 Average Deliverable Sizes and Rates of Change for a 1000–Function Point System Software Application Using a Waterfall Method
Because the Agile methods reduce the volume of requirements and design paperwork, it is interesting to show what the same project might look like using the Agile approach. Table 19.4 illustrates typical document volumes and rates of change in an Agile context.
With Agile methods the formal documentation at the start of a project, such as requirements and specifications, are reduced in volume. This reduction in paperwork requires that one or more clients become an actual part of the development team. Since client participation is not usually included in waterfall cost estimates, but is included in Agile cost estimates, there will be at least one more staff member for Agile projects than for waterfall projects. The reduction in paperwork volumes usually raises overall productivity by about 30 percent.
Because such non-code materials as text and graphics actually comprise the bulk of software deliverables, it is of interest to include some information on the approximate volumes of these two items.
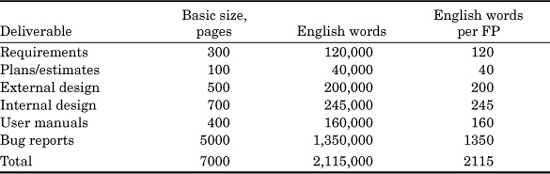
Table 19.5 shows the approximate volumes of the major paper deliverables associated with software that uses the waterfall approach. There are, of course, many more ephemeral documents produced, such as letters, memos, presentations, progress reports, and the like. (A total of more than 50 kinds of paper document can be produced for large software projects.) However, these ephemeral documents may not come under configuration control, while the basic specifications, contracts, plans, estimates, and user documents often do.
Because the volume of source code in this example is 125,000 logical statements, it can be seen that more than 184 words are created for every source code statement. (Had this been a military project, the total would have been more than 400 English words per source code statement.)
TABLE 19.4 Average Deliverable Sizes and Rates of Change for a 1000–Function Point System Software Application Using Agile Methods
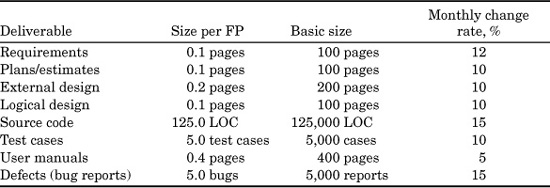
TABLE 19.5 Volume of Text and Words Produced for a Generic 1000–Function Point System Software Project
Of course, if this were an Agile project, the volume of paperwork would be less than 50 percent of the volume shown in Table 19.5. The only paper documents that would be the same size in both the waterfall and Agile methods of development would be the user manuals and the bug reports. All of the front-end requirements and specification volumes would be reduced.
Both the large volume of information associated with bug reports and the significance of this topic imply a need for very strong defect-tracking capabilities in configuration-control tool suites.
Graphics and illustrations vary widely and are more difficult to quantify. Even so, the volume of graphical material in support of software is too large to ignore and is becoming larger very rapidly as better graphics production tools become widespread. Table 19.6 shows the approximate volumes of graphical materials that might be produced for this sample waterfall application.
Even as this is being written, graphics and illustrations tend to remain somewhat troublesome for configuration-control purposes. In the future, when dynamic or animated models and simulations become common for software, and when multimedia approaches are used for software representation, change control will become both more difficult and more important.
TABLE 19.6 Volume of Graphic Illustrations Produced for a Generic 1000–Function Point System Software Project
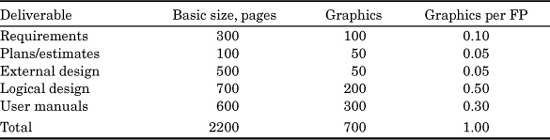
If the project illustrated in Table 19.6 were an object-oriented project that used the UML, the volume of graphics would be about 25 percent larger for the requirements and design documents. Plans and user manuals would not change.
Changes in User Requirements
Requirements changes, or creeping requirements, are the most important topic for change management, because they cause updates of all downstream deliverables. Requirements changes become progressively more troublesome after the nominal completion of the requirements phase, as discussed earlier in this book.
The exception to the rule that requirements changes become progressively more troublesome are projects that use the Agile methodology. These projects start coding when only basic and obvious requirements are understood, and the remainder of the requirements grow organically. This method requires that a client be an actual part of the development team, and that each increment or sprint be used in order to plan the next wave of change.
Of course for projects where the number of users is large, say more than 1,000,000 people, the Agile methods are not applicable. Neither are they applicable for projects that might be developed under a fixed-cost contract.
During the subsequent design phase, the average rate of requirements change may exceed 3 percent per month for many software projects (and 12 percent for Agile projects). This burst of rapid requirements changes may last as long as a year for large systems, but would occur only for about three months on this sample project. The burst of new requirements slows down to about 1 percent per month during coding, and eventually stops by the time testing commences. (Requirements changes don’t really stop, of course, but the requirements tend to get pushed downstream into follow-on releases.)
For systems software, such as this example, and for commercial software, changes may be due to market needs or competitive products. The average rate is about 2 percent per month from the end of initial requirements until start of testing. But if a competitor suddenly announces a new product, monthly change rates can top 15 percent!
For internal software, requirements changes are driven by user needs and average about 1 percent per month from the start of design until well into coding. For military software, the average is about 2 percent per month.
Military software requirements call for very strict requirements traceability. This means that all downstream deliverables need to identify which requirements they include to a very granular level. This implies, ideally, that software requirements would be the base for hypertext linkages to other downstream software artifacts.
Software outsourcers and contractors can now derive the function point totals of software during the requirements phase, and this is leading to a newfound ability to quantify the subsequent downstream costs of changing requirements.
Because the cost per function point is now being used to price software features, tools such as Function Point Workbench, which can assign function point totals to various features of an application, are starting to become important business tools. Currently, these are standalone tools, but it is obvious that direct linkages will be needed so that changes in requirements or design can automatically trigger new size and cost estimates.
For example, assume that this project is performed as a contract development effort rather than as an internal project. The contract might include phrasing or concepts similar to the following:
![]() Development costs for requirements derived during months 1 to 3 or the requirements phase of the project = $1500 per function point.
Development costs for requirements derived during months 1 to 3 or the requirements phase of the project = $1500 per function point.
![]() Development costs for new requirements added during months 4 to 6 = $1750 per function point.
Development costs for new requirements added during months 4 to 6 = $1750 per function point.
![]() Costs for requirements deleted during months 4 to 6 = $150 per function point.
Costs for requirements deleted during months 4 to 6 = $150 per function point.
![]() Development costs for new requirements added during months 6 to 12 = $2250 per function point.
Development costs for new requirements added during months 6 to 12 = $2250 per function point.
![]() Costs for requirements deleted during months 6 to 12 = $500 per function point.
Costs for requirements deleted during months 6 to 12 = $500 per function point.
![]() Development costs for new requirements added during months 12 to 18 = $5000 per function point.
Development costs for new requirements added during months 12 to 18 = $5000 per function point.
![]() Costs for requirements deleted during months 12 to 18 = $1000 per function point.
Costs for requirements deleted during months 12 to 18 = $1000 per function point.
The usage of cost per function point as a contractual metric means that clients, accountants, project managers, contract officers, attorneys, and others now have a much better understanding of software economics than was possible during the primitive lines-of-code era. It is also significant that the Internal Revenue Service is now exploring cost per function point as a way of determining the taxable value of software.
Changes in Specifications and Design
Since the design and specifications for a software project are in response to fundamental user requirements, most of the design changes after the initial creation of the design can be attributed to changes in the user requirements.
However, a significant number of design modifications are due to suggested improvements by the development team members themselves, or to factors that only come to light during the detailed design phase. For example, if a software application has very stringent performance targets it may be necessary to revise the design in order to squeeze extra speed out of the system.
A study performed by the author on IBM systems software noted that the design and development team introduced a number of changes for what appeared to be insufficient justification. Some changes were made because of personal preferences by the design personnel, or for somewhat nebulous reasons, such as “Someone might need this feature and it was easy to put it in.”
On the whole, large systems benefit from the costs of having a formal change-control board with representatives from the client community, the development community, the quality-assurance community, and the testing community.
A multi-skilled change-control board with a broad outlook can save time and money by eliminating unnecessary changes and ensuring that when changes do occur, all affected organizations are brought up to speed.
It should be noted that there are more than 40 different kinds of design methodology in the software engineering world. Obviously, the volumes and costs of producing design documents will vary from method to method. UML and use cases are not increasing in usage. As it happens, their volume is roughly commensurate with some of the older design approaches such as standard structured design.
Changes Due to Bugs or Defect Reports
Software development and maintenance are intellectually difficult tasks during which a large number of bugs or defects will be created (and hopefully found and eliminated). Defect removal is the most expensive cost component of software, and the volume of information associated with software defects or bugs is the largest of any software artifact.
Because there are so many bugs in software, so much information about bugs, and the costs of bug removal is such a major component of overall software costs, it is mandatory that configuration-control tools have powerful defect tracking and reporting capabilities.
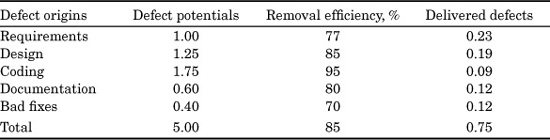
Bugs are not just found in source code, of course. Table 19.7 shows approximate U.S. national averages for software defects and the percentages of defects removed prior to the initial deployment.
A simple rule of thumb can lead to useful approximations of software defects or bugs. Take the size of the application in function points and raise the size to the 1.25 power. That will yield a rough approximation of the total number of bugs that may be faced during development. For enhancement projects, the size is that of the enhancement rather than the base size of the application.
TABLE 19.7 U.S. Averages for Software Defects and Defect-Removal Efficiency
(Data expressed in defects per function point)
This approximation method for defects works for waterfall projects, Agile projects, object-oriented projects, web projects and most other kinds of software projects.
There are three interesting exceptions, however. Projects that are at level 3 or higher on the capability maturity model (CMM) should use a power of 1.15 rather than 1.25. Projects developed in organizations that utilize six-sigma for software should use a power of 1.2 rather than 1.25. Projects that utilize QFD should use a power of 1.12 rather than 1.25. These three methods have proven to be fairly effective in preventing defects from occurring.
Assuming that the hypothetical project discussed here is an average project, there would be about 1000 errors found in requirements, 1250 in design, 1750 in the source code, and 600 in the user manuals. Another 400 bugs would be secondary errors or bad fixes introduced when a bug repair itself contains a new error. A total of about 5000 bugs would have to be found and eliminated in this average project.
Because of the costs and importance of quality control, it can be seen that defect tracking is a vital component of software change management. Defect tracking spans the entire life cycle of a software project. Defect tracking starts during requirements and proceeds all the way through the development cycle and out into the maintenance cycle for as long as the product is used—20 years or more in some cases.
Summary and Conclusions
Change management is one of the most important aspects of successful software development. Recognition of this fact is leading to an interesting new sub-industry of companies that build integrated change management tools that can handle far more than just source code revisions.
Part of the impetus for the development of this sub-industry is the impact of function point metrics, which allow quantifying the costs of change with a precision that was impossible for many years.
Costs of changes are now beginning to appear in development and maintenance contracts for software, and this, in turn, is leading to a new business understanding of the economics of changing software.
There is still a long way to go before software changes are fully explored and understood, but the rate of progress is now very rapid and even accelerating.
References
Ambler, S.: Process Patterns—Building Large-Scale Systems Using Object Technology, Cambridge University Press, New York, SIGS Books, 1998.
Arthur, Jay: Software Evolution, John Wiley & Sons, New York, 1988.
Artow, J., and I. Neustadt: UML and the Unified Process, Addison-Wesley, Boston, Mass., 2000.
Beck, K.: Extreme Programming Explained: Embrace Change, Addison-Wesley, Boston, Mass., 1999.
Berlack, H.R.: Software Configuration Management, John Wiley & Sons, New York, 1992.
———: “Configuration Management,” in, Encyclopedia of Software Engineering, John Marciniak, (ed.), vol. 1, John Wiley & Sons, New York, 1994, pp. 180–206.
Boehm, Barry: “A Spiral Model of Software Development and Enhancement,” Proceedings of the Int. Workshop on Software Process and Software Environments, ACM Software Engineering Notes, Aug. 1986, pp. 22–42.
Booch, Grady: Object Solutions: Managing the Object-Oriented Project, Addison-Wesley, Reading, Mass., 1995.
———, Ivar Jacobsen, and James Rumbaugh: The Unified Modeling Language User Guide, Second Edition, Addison-Wesley, Boston, Mass., 2005.
Brooks, Fred: The Mythical Man-Month, Second Edition, Addison-Wesley, Reading, Mass., 1995.
“Capability Maturity Model Integration,” Version 1.1, Software Engineering Institute, Carnegie-Mellon Univ., Pittsburgh, PA, March 2003, (http://www.sei.cmu.edu/cmmi/).
Cockburn, Alistair: Agile Software Development, Addison-Wesley, Boston, Mass., 2001.
Cohen, D., M. Lindvall, and P. Costa: “An Introduction to Agile Methods,” Advances in Computers, Elsevier Science, New York, 2004, pp. 1–66.
Cohen, Lou: Quality Function Deployment: How to Make QFD Work for You, Prentice-Hall PTR, 1995.
Cohn, Mike: User Stories Applied: For Agile Software Development, Addison-Wesley, Boston, Mass., 2004.
———: Agile Estimating and Planning, Prentice-Hall PTR, Englewood Cliffs, N.J., 2005.
Gack, Gary: “Applying Six-Sigma to Software Implementation Projects,” (http://software. isixsigma.com/library/content/c040915b.asp).
Gamma, Erich, Richard Helm, Ralph Johnson, and John Vlissides: Design Patterns: Elements of Reusable Object Oriented Design, Addison-Wesley, Boston Mass., 1995.
Garmus, David, and David Herron, David: Measuring the Software Process: A Practical Guide to Functional Measurement, Prentice-Hall, Englewood Cliffs, N.J., 1995.
———: Function Point Analysis, Addison-Wesley Longman, Boston, Mass., 2001.
Hallowell, David L.: “Six-Sigma Software Metrics, Part 1” (http://software.isixsigma.com/library/content/03910a.asp).
Highsmith, Jim: Agile Software Development Ecosystems, Addison-Wesley, Boston, Mass., 2002.
Humphrey, Watts: Managing the Software Process, Addison-Wesley, Reading, Mass., 1989.
———: TSP—Leading a Development Team, Addison-Wesley, Boston, Mass., 2006.
IEEE Standard 828-1990: Software Configuration Management, IEEE Standards Department, Piscataway, N.J., 1990.
Mikkelsen, Tim, and Suzanne Pherigo: Practical Software Configuration Management, Prentice-Hall PTR, Upper Saddle River, N.J., 1997.
MIL STD 973: Configuration Management, Department of Defense, Naval Publications Center, Philadelphia, Pa., 1992.
MIL STD 2167A: Defense System Software Development and Data Item Descriptions, Department of Defense, Naval Publications Center, Philadelphia, Pa., 1988.
Jones, Capers: Assessment and Control of Software Risks, Prentice-Hall, Englewood Cliffs, N.J., 1994.
———: Patterns of Software System Failure and Success, International Thomson Computer Press, Boston, Mass., 1995.
———: Applied Software Measurement, McGraw-Hill, New York, 1996.
———: Software Quality—Analysis and Guidelines for Success, International Thomson Computer Press, Boston, 1997.
———: “Sizing Up Software,” Scientific American, New York, December 1998, Vol. 279, No. 6, pp 104–109.
———: Software Assessments, Benchmarks, and Best Practices, Addison-Wesley Longman, Boston, Mass., 2000.
———: Conflict and Litigation Between Software Clients and Developers, Software Productivity Research, Burlington, Mass., 2003.
Kan, Stephen H.: Metrics and Models in Software Quality Engineering, Second Edition, Addison-Wesley Longman, Boston, Mass., 2003.
Koirala, Shavisprasad: “How to Prepare Quotation Using Use Case Points,” (http://www.codeproject.com/gen/design//usecasepoints.asp).
Larman, Craig, and Victor Basili: “Iterative and Incremental Development—A Brief History,” IEEE Computer Society, June 2003, pp 47–55.
Love, Tom, Object Lessons, SIGS Books, New York, 1993.
McConnell, Steve: Software Estimating: Demystifying the Black Art, Microsoft Press, Redmond, WA, 2006.
Mikkelsen, Tim and Pherigo, Suzzanne; Practical Software Configuration Management: The Latenight Developer’s Handbook; Prentice-Hall PTR, Englewood Cliffs, NJ; 1997.
Mills, H., M. Dyer, and R. Linger: “Cleanroom Software Engineering,” IEEE Software, 4, 5 (Sept. 1987), pp. 19–25.
Pressman, Roger: Software Engineering—A Practitioner’s Approach, Sixth Edition, McGraw-Hill, New York, 2005.
Putnam, Lawrence H.: Measures for Excellence—Reliable Software on Time, Within Budget, Yourdon Press/Prentice-Hall, Englewood Cliffs, N.J., 1992.
———, and Ware Myers: Industrial Strength Software—Effective Management Using Measurement, IEEE Computer Society Press, Washington D.C., 1997.
Quality Function Deployment (http://en.wikipedia.org/wiki/Quality_function_ deployment).
Rapid Application Development (http://en.wikipedia.org/wiki/Rapid_application_development).
Stapleton, J.: DSDM—Dynamic System Development in Practice, Addison-Wesley, Boston, Mass., 1997.