
Chapter 24
Software Cost-Estimating Research Issues
In spite of the progress in software development methods and software cost-estimation tools, accurate estimation remains a difficult task circa 2007. Some of the difficulty is due to the intrinsic ambiguity and complexity of large software applications. But some of the difficulty associated with accurate estimation is self-inflicted and due to lack of research into key problem areas. This chapter discusses ten estimating problem areas that are in need of additional study and research:
1. Metrics conversion
2. Automatic sizing from user requirements
3. Activity-based costs for Agile projects, object-oriented projects, and web projects
4. Complexity analysis of software applications
5. Value analysis and estimation
6. Risk analysis and estimation
7. Including specialists in software cost estimates
8. Reuse analysis and software cost estimates
9. Process improvement estimation
10. Methodology analysis and software cost estimating
These ten problem areas are all important for achieving both a better understanding of software cost estimating and a better understanding of the most effective methods of developing complex software applications.
Metrics Conversion
In gathering the information for this second edition, no fewer than 38 separate metrics for measuring software size were noted. The author believes that, for unknown reasons, the software industry has created more kinds of sizing metrics than any other engineering field in human history. Not only does the software industry utilize an excessive number of sizing metrics, but there are very few rules or algorithms for converting size between one metric and another.
This issue is not a new one. As far back as the 1970s ambiguity began to occur with productivity measurements and cost estimates due to the large differences in software size when applications were measured with either physical lines of code or with logical statements. Based on the programming language used, there can be as much as a 500 percent difference in apparent size between these two metrics.
For some languages there are more logical statements than physical lines. This is true for COBOL with case statements. For other languages there are more physical lines than logical statements. This is true for Quick Basic, which allows logical statements to be concatenated. For yet other languages (such as Visual Basic) it is even possible to create code without any lines of code at all, due to using buttons and pull-down menus. There is also the issue of reusable code that is copied into an application or is available from class libraries.
Analysis of published data in software journals by the author found that about one-third of technical articles used physical lines, one-third used logical statements, and one-third did not state which method was used. There are very few studies or rules for converting size between physical lines and logical statements for any of the 600 or so programming languages that have been developed. There are also very few studies on the volumes of reused code in completed applications.
Suppose you had published data from an Objective-C program that indicated it was 10,000 physical lines in size. You also had published data from a C++ program of 10,000 logical statements in size. You had published data from a third program in C that stated it was 10,000 lines of code in size, but did not say whether logical or physical lines were used. Are these three programs the same size? Is one of them bigger than the others? If so, which one is largest and which is smallest? There is no effective answer to this question as of 2007.
More recently, no fewer than 15 forms of functional metrics have been developed and have started to be used for estimation and measurement purposes. Some of these in alphabetical order include
![]() 3D function points
3D function points
![]() COSMIC function points
COSMIC function points
![]() Engineering function points
Engineering function points
![]() Feature points
Feature points
![]() IFPUG function points
IFPUG function points
![]() Mark II function points
Mark II function points
![]() NESMA function points
NESMA function points
![]() Object points
Object points
![]() Story points
Story points
![]() Unadjusted function points
Unadjusted function points
![]() Use case points
Use case points
![]() Web object points
Web object points
There are almost no published rules for converting size between any of these function point variants. If one application is measured with COSMIC function points and is 1000 function points in size, another is measured with IFPUG function points and is also 1000 function points in size, and a third is measured with NESMA function points and is also 1000 function points in size, are these three the same size or not? As of 2007 there is no effective answer to this basic question.
For maintenance of legacy applications where code exists but there are often no current specifications, the most common technique for sizing is “backfiring.” The term backfiring means calculating size in function points by mathematical conversion from logical source code statements.
There are several sets of published rules for converting size between source code size and function points via backfiring, but the rules are inconsistent from study to study. Conversion between logical source code statements and IFPUG function points is the most widely cited, and there are rules for about 600 programming languages. However, there are very few conversion rules between physical lines of code and any of the function point counting methods.
Backfiring has not been particularly accurate. One reason is that aging legacy applications often have significant quantities of “dead” code that is no longer operational but is still present. An application’s cyclomatic and essential complexity levels are known to affect backfire ratios.
Several kinds of tools such as automated complexity analyzers and static analysis tools could be modified to produce backfire function point counts whenever they are run on a legacy application. This would improve the accuracy of backfire ratios and ensure greater consistency of backfire data. For one thing, these tools could quantify the volume of dead code and exclude it from the backfire calculations.
Given the popularity and widespread use of the backfiring method, it is surprising that none of the international metrics organizations such as IFPUG or COSMIC have formed backfiring committees to standardize this approach.
The large number of inconsistent metrics used for expressing software size is a barrier to effective cost estimating. The problem with all of these metrics is that they damage the validity of historical data, and make constructing benchmarks extremely difficult. If all of these metrics are included in software cost-estimating tools, it would be hard to keep the tools current because all of the various metrics change counting rules at random intervals.
The author believes that it is the responsibility of metric developers to produce conversion rules between any new metric and all of the older metrics that have been in existence for some time. Since IFPUG function points are the oldest form of functional metric, the developers of the newer variants should be the ones to produce the conversion rules.
The industry would benefit from the publication of a general table of conversion rules that included differences between physical lines and logical statements for all programming languages, as well as conversion ratios among the various functional metrics now in use. While some preliminary conversion rules appeared earlier in Chapter 9, their margin of error is rather high. Additional research into metrics conversion is needed.
Automatic Sizing from User Requirements
As of 2007 the work of ascertaining the size of a new software application during the requirements gathering and analysis phase depends upon five different sizing methods:
![]() Mathematical projections from the taxonomy of the application
Mathematical projections from the taxonomy of the application
![]() Analogy with existing applications of the same kind
Analogy with existing applications of the same kind
![]() Having a certified function point consultant manually count function points from the requirements documents
Having a certified function point consultant manually count function points from the requirements documents
![]() Having developers count story points, use case points, object points, web object points, or one of the other new metrics
Having developers count story points, use case points, object points, web object points, or one of the other new metrics
![]() Guesswork or some kind of Monte Carlo approach
Guesswork or some kind of Monte Carlo approach
The second method, analogy with historical projects, needs additional research. Currently, looking for similar applications to use as patterns for sizing or for feature analysis is pretty much a manual operation. In-house data may have one or two legacy examples, but if there were data available on an industry basis then there might be dozens of prior examples. Unfortunately, industry data is only available from a few consulting companies. A lot of the data is somewhat ambiguous due to the metrics issues discussed in the previous section.
As this second edition is being prepared for 2007, a new consortium of companies, including the Software Engineering Institute (SEI), Software Productivity Research (SPR), and the David’s Consulting Group, is beginning work on establishing an industry benchmark data base. This could lead to much more sophisticated pattern matching in the future. However, the work is only just getting started as this edition is being prepared.
If each software application is defined using an exact taxonomy, and if these taxonomies and other historical data are placed in a large database of software histories, then it should be possible to search for analogous projects in a fully automated way. Since almost all new applications are similar to older applications, the combination of pattern matching and a large multicompany repository of historical projects should allow as many as 50 previous projects to be considered. These would provide useful information not only on size, but also on schedules, costs, quality and other estimating topics of interest.
Function point counting, as well as counting story points, use case points, object points, etc., are primarily manual operations by trained personnel or by certified experts. Manual counting is fairly accurate when performed by certified personnel, but it is painfully slow. Typically manual counting of function point metrics proceeds at rates of between 500 and 1500 function points per day. That may sound like a lot, but for an application of 10,000 function points or larger, the costs quickly mount up. In fact just counting the function points in a large application can have costs in excess of $100,000.
It is technically possible to derive function points (and other metrics too) automatically from requirements expressed in structured English, HIPO diagrams, use cases, Class responsibility collaboration (CRC), or in the unified modeling language (UML). Over the past ten years, several experimental tools have been built to automate function point counting. However, these tools were built to operate with some specific design tools such as the Bachman Analyst. When the companies did not continue to market the design tools, the function point counting features were not ported to other platforms. There would be a fairly large untapped market in the future automating the sizing of applications by derivation from requirements and specifications.
The different topics that combine together to form the basis of the size of a software application include the following elements:
![]() The outputs that should be produced by the application
The outputs that should be produced by the application
![]() The inputs that will enter the software application
The inputs that will enter the software application
![]() The logical files that must be maintained by the application
The logical files that must be maintained by the application
![]() The entities, actors, classes, and relationships of the application
The entities, actors, classes, and relationships of the application
![]() The inquiry types that can be made to the application
The inquiry types that can be made to the application
![]() The interfaces between the application and other systems
The interfaces between the application and other systems
![]() The algorithms that will be in the application
The algorithms that will be in the application
![]() The use cases or major tasks users can perform
The use cases or major tasks users can perform
![]() The hardware platforms on which the application operates
The hardware platforms on which the application operates
![]() The software platforms on which the application operates
The software platforms on which the application operates
![]() The reused material going into application
The reused material going into application
![]() The national languages the application must support
The national languages the application must support
The similarity between the topics that need to be examined when gathering requirements and those used by the functional metrics makes the derivation of function point totals during requirements a fairly straightforward task.
There is such a strong synergy between requirements and function point analysis that it would be possible to construct a combined requirements-analysis tool with full function point sizing support as a natural adjunct. However, the current generation of automated requirements tools is not quite at that point. Additional research is needed.
Activity-Based Costs for Agile, Object-Oriented, and Web Projects
The waterfall development method has more than 50 years of accumulated history and several thousand measured projects. Although some of the data is ambiguous and inaccurate, at least there is a lot of it. For waterfall projects enough data has been accumulated and analyzed for estimating tools to predict with reasonable accuracy dozens of specific activities. Earlier in this book costs and effort tables were shown for 25 of these activities.
The Agile, web, and object-oriented approaches have developed interesting and unique patterns of development activities that are not found in standard waterfall projects. These include activities such as scrum sessions, development sprints, refactoring, object-oriented analysis, object-oriented design, use case development and many others.
As of 2007 there is a shortage of solid empirical data on the effort, schedules, costs, and quality of many of these newer activities. Because of the newness of some of these approaches, there is a significant shortage of long-range studies that include maintenance and enhancement information.
In order to really evaluate the effectiveness of a specific approach, a minimum of about 50 projects should use the method and report application sizes, schedules, costs, productivity, quality, and other quantified results. Table 24.1 shows some of the methods and approaches where there is a shortage of enough historical data to evaluate the effectiveness of the techniques.
This is not to say that there is no information at all about these approaches. However, for many of them there is either insufficient information for statistical analysis, or the available data is expressed in more than one metric so analysis is difficult.
TABLE 24.1 Methods Lacking Historical Data
1. Actor-based development
2. Assembly, disassembly, reassembly (ADR)
3. Capability maturity model integration (CMMI)
4. Clean-room development
5. CRC diagrams
6. Crystal development approach
7. Data flow diagrams
8. Data structured system design (DSSD)
9. Dynamic system development method (DSDM)
10. Entity-relationship diagrams
11. Extreme programming (XP)
12. Feature-driven development (FDD)
13. Finite state diagrams
14. Incremental development
15. ISO 9000–9004 standards
16. Jackson diagrams
17. Object-oriented development (OO)
18. Open-source components
19. Pattern-based development
20. Petri nets
21. Quality Function Deployment (QFD)
22. Rapid Application Development (RAD)
23. Rational development method
24. Scrum
25. Six-sigma for software
26. Spiral development
27. State transition diagrams
28. Team Structured Process (TSP)
29. Total Quality Management (TQM)
30. Tropos software development method
31. Unified modeling language (UML)
32. Use cases
33. User stories
34. Vienna development method (VDM)
35. Zermelo-Frankel Z Notation
For example, there are hundreds of object-oriented (OO) projects with some kind of historical data available. But some of these OO projects were measured with physical lines of code, some with logical statements, some with IFPUG function points, some with object points, some with use case points, some with web object points, and some with Mark II function points. Statistical analysis of projects that were measured with incompatible metrics is not effective.
Estimating accuracy depends upon reliable historical data. And that historical data should either be measured with the same kind of metrics, or at least with metrics where there are known conversion rules among all of the metrics in the sample. Thus, the lack of conversion rules, discussed earlier in the chapter, is delaying the full understanding of many interesting software technologies.
Complexity Analysis of Software Applications
There is a substantial body of data that indicates that complex software will cost more, have more defects, and be more difficult to update safely than simple software. However, complexity itself is either a subjective opinion, or derived from measuring the cyclomatic and essential complexity of source code or the Halstead complexity level.
Whether the complexity of the code is necessary or simply due to poor judgment by the developers is an unanswered question. From the fact that there is a significant market for tools that can restructure software code, and that manual “refactoring” of code is quite common, it appears that much of the complexity is accidental rather than necessary.
Several of the function point metrics have complexity adjustment factors. However, these adjustments are essentially subjective. Surprisingly, none of the function point complexity adjustments make use of cyclomatic and essential complexity or Halstead complexity.
As discussed earlier in this book, the general scientific literature cites some 24 forms of complexity. Most of these would seem to have an impact on software projects, but only two of them, cyclomatic and essential complexity, have any solid empirical data associated with them. The Halstead complexity metric has very little data associated with it.
There is a need for additional research on the other forms of complexity and how they affect the outcomes of software projects and also how they affect function point metrics. Some of the other forms of complexity that need additional research include fan complexity, flow complexity, and Halstead complexity. There is also a need to examine the complexity of the many text documents associated with software projects such as requirements and specifications. For example, it is suspected that requirements with a high FOG index are more error prone and difficult to develop than requirements with a low FOG index.
There is also a need for research into some topics of sociological complexity. There are assertions among the Agile development enthusiasts that small teams are the best solution for software development. This is an interesting but unproven hypothesis. There is a need for additional research on a variety of software organization structures including hierarchical, matrix, small teams, large teams, and virtual teams.
There is one other aspect of complexity that has a direct bearing on automated software cost-estimating tools and also on benchmarks. As of 2007 the software industry uses some 600 different programming languages and creates about 120 different kinds of software applications, each of which can contain about 23 different features. The software industry employs 90 kinds of specialists, creates 53 kinds of paper documents, uses 43 different design methods, and measures with 38 different size metrics. Software applications are built utilizing 26 different development methods that include at least 35 different activities. About 25 international standards affect software projects. Software projects face 30 different kinds of risk factors. The software industry must also deal with 24 kinds of complexity, perform 23 different kinds of maintenance activities, and may perform 18 different kinds of testing. The combinatorial complexity of these topics is enormous. There is no way for either project managers or estimating tool developers to include all of these factors at the same time. It is obvious from the plethora of choices and alternatives in the software industry that we are groping for better ways of doing things, but have not yet found optimal approaches.
Value Analysis of Software Applications
The opposite side of cost estimating is value estimating. Cost-estimating tools and manual methods can predict with fair accuracy how much a software application will cost to build and maintain, but what will be the value of the application once it is deployed? Will the application have a positive return on investment (ROI)? Will there be other kinds of value than financial value such as improvements in customer satisfaction or employee morale?
Financial value can be calculated using net present value, accounting rates of return, or internal rates of return. In fact, several commercial software cost-estimating tools include value-analysis features that can predict financial value. There are also earned-value calculations. But the non-financial value of software applications is a very difficult issue to deal with.
It would be useful to consider performing research on and developing a “value point” metric that could be used to handle both the financial and non-financial kinds of value that software applications provide.
Currently, almost the only kinds of “value” considered for software applications are either cost reductions or revenue increases. While these are no doubt important topics, there are a host of other aspects of value that also need to be examined and measured—customer satisfaction, employee morale, national security, safety, and many other topics. A hypothetical value point metric might include the following factors:
![]() Financial value
Financial value
1. Cost reduction
2. Revenue increases
![]() Business value
Business value
1. Market share increases
2. Schedule improvement
3. Quality and reliability improvement
4. Competitive advantages
5. Risk reduction
6. Hardware synergy (software that leads to hardware sales)
7. Software synergy (software that leads to other software sales)
8. Consulting synergy (software that leads to consulting sales)
![]() Intangible value
Intangible value
1. Corporate prestige
2. Improvement in client operations
3. Morale improvement of employees
4. Attrition reduction of employees
5. Health or safety improvement
6. Corporate security improvement
7. National security improvement
8. Government mandates
The way such a value point metric might work is as follows. For the two forms of financial value, cost reduction and revenue increases, a fixed amount such as $1000 might be assigned to each value point.
For the other forms of value, various weights would be assigned. For example if an application is going to increase the market share of a company, each new customer might be equivalent to one value point. If the application is going to improve the work performance of its users, a value point might be assigned for each 1 percent gain by each user.
The eventual usage of value points would be to aid in the determination of whether a software application should be built or not. For example, a corporation might set a goal that each application had to return 10 value points for each function point in the application itself. Thus, an application of 2500 function points would need to achieve a target of 25,000 value points in order to get funded.
Some of these value points would be derived from cost reductions and revenue increases, but other value points might derive from enhancing corporate prestige or improving customer operational effectiveness.
The main purpose of a hypothetical value point metric would be to provide some kind of tangible weight to all aspects of value and not just those that are purely based on dollars. While value based on cost reduction and revenue increases are no doubt important, they are not a complete justification for software that deals with issues such as medical diagnostic studies, national security, policy analysis, or government mandates.
As an example, both the Democratic and Republican political parties have fairly sophisticated software that analyzes voting patterns and sorts registered voters by address, party, zip code, and the like. These applications are about 3000 function points in size. They are not easily justified based on financial ROI. The justification of these applications is to improve the election chances of the candidates from each party. Such applications might assign one value point to each voter. Value could then be calculated, approximately, by the number of voters added to the total for various candidates.
As another example, the Veterans Administration has a large application in excess of 15,000 function points in size for keeping track of the medical histories of millions of veterans. This is an effective application that performs a vital task. However, it would be hard to justify this application using only financial value. The real value is in the way it speeds up making information available to physicians and thereby benefits the health care of the veterans who are being treated. With value points, each veteran’s record could be assigned a value point, while each 1 percent improvement in the speed of accessing the information by each physician could also be assigned a value point. Under such an approach, this 15,000 function point application probably would have in excess of 5,000,000 value points and hence clearly be considered a vital application.
Risk Analysis and Software Cost Estimates
It is a known fact that many large software applications are cancelled without completion due to excessive delays or poor quality. It is also a known fact that about half of the large software applications that are completed will be late by as much as a year, and overrun their budgets by as much as 100 percent. These two phenomena appear to be an indictment of software cost estimates as being fundamentally flawed. However, in many cases accurate estimates were arbitrarily rejected by clients and senior managers, who substituted their own cost and schedule targets based on business needs rather than on team capabilities.
What is not so widely known is that delays and cancellations for large software projects are usually caused by the same five factors:
![]() Excessive defect levels in key deliverables
Excessive defect levels in key deliverables
![]() Inadequate defect removal activities
Inadequate defect removal activities
![]() Excessive changes in requirements late in development
Excessive changes in requirements late in development
![]() Inadequate change-control procedures
Inadequate change-control procedures
![]() Rejection of accurate estimates and replacement by arbitrary schedule and cost targets
Rejection of accurate estimates and replacement by arbitrary schedule and cost targets
Since the problems that cause delays and cancellations are known, it would be prudent to include a formal risk analysis and risk abatement stage for every software development project larger than 1000 function points or 100,000 source code statements in size.
Such a risk analysis would include the known problem areas for large software applications. These include problems associated with project management, problems associated with defects, and problems associated with changing requirements:
![]() Project management risks
Project management risks
1. Cost estimates optimistic by > 10 percent
2. Quality estimates optimistic by > 25 percent
3. Milestones missed by > 1 week
4. Failure to track progress daily
5. Failure to report problems to higher management
6. Failure to revise estimates to match new requirements
![]() Requirements change risks
Requirements change risks
1. New requirements growth > 2 percent per calendar month
2. No cost or schedule adjustments for new requirements
3. No quality estimates for new requirements
4. No inspections or reviews of new requirements
5. Ineffective change-control methods
![]() Quality control risks
Quality control risks
1. Errors in requirements > 1 defect per function point
2. Errors in design > 1 defect per function point
3. Errors in new code > 1.5 defect per function point
4. Errors in reused code > 0.5 defects per function point
5. Error-prone modules present in code
6. Errors in user documents > 0.5 per function point
7. Errors caused by bad fixes > 5 percent
8. No usage of pre-test inspections
9. Inadequate test planning
10. Insufficient test cases for changing requirements
11. Defect-removal efficiency < 95 percent
The set of problems in this list has been noted in more than 90 percent of the software applications that ended up in litigation for breach of contract where the author worked as an expert witness. In-house project failures do not end up in court for breach of contract, but these problems have been found in very close to 100 percent of the large failing projects studied by the author.
Additional research is needed on various forms of risk. Also, there is a need for including a standard risk taxonomy in the estimates of all large software projects.
Including Specialists in Software Cost Estimates
Empirical studies have indicated that for a number of software tasks and activities, specialists outperform generalists in significant ways. Some of the occupations where trained or certified specialists have been shown to be beneficial include in alphabetic order:
![]() Configuration control
Configuration control
![]() Cost estimating
Cost estimating
![]() Customer support
Customer support
![]() Database administration
Database administration
![]() Function point counting
Function point counting
![]() Maintenance
Maintenance
![]() Technical writing
Technical writing
![]() Testing
Testing
That brings up the point that the presence or absence of specialists is a factor that should be included both in historical benchmarks and also in cost estimates.
A large software development laboratory has a surprisingly diverse set of personnel employed. In a study the author and his colleagues carried out involving large organizations such as the Air Force, IBM, and Texas Instruments, no fewer than 90 kinds of specialists were noted in the entire study. However, no single company employed more than 50 of these.
One of the major topics in the domain of specialization is how many specialists of various kinds are needed to support the overall work of the software community? This is a topic that needs additional research. The ratios shown in Table 24.2 are not known to be optimal, but reflect the numbers of specialists observed during the study for a number of common specialties. For some kinds of specialization there are not yet any normative ratios available. Not all of the specialists shown here occur within the same company or even the same industry, it should be noted. They are ranked in Table 24.2 in descending order.
It was noted during the study that only a few kinds of software specialization have formal training and certification available. For example, project managers and function point counters can both be certified.
In other technical disciplines such as medicine, law, and engineering there are certification boards for many kinds of specialists. The software industry needs to perform additional studies on the kinds of specialists needed. There is also a need for improved training and certification in almost all software specialties.
TABLE 24.2 Approximate Ratios of Specialists to General Software Populations
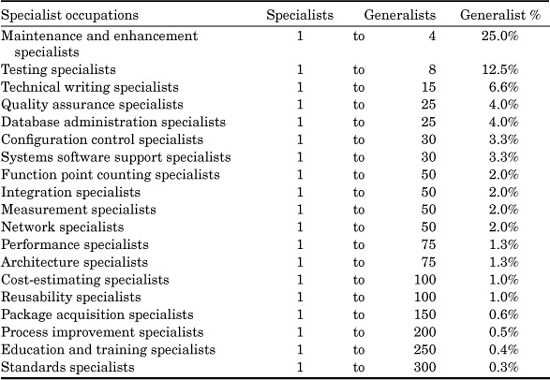
The performance difference between specialists and generalists is sometimes surprisingly large. In the case of function point counting, for example, certified specialists have been tested and came within 3 percent of providing the same count for the test examples. Counts by uncertified function point counters varied by more than 30 percent for the same examples.
Another aspect of the issue is that specialists and generalists may have different levels of compensation. If so, then these levels of compensation need to be included in the cost estimate.
More research is indicated on the performance levels of specialists versus generalists for many software activities.
Reuse Analysis and Software Cost Estimates
There is an interesting and simple exercise that makes it easy to see why software is expensive. Simply consider what these three activities have in common?
![]() Building a 12-meter yacht to compete in the America’s Cup race
Building a 12-meter yacht to compete in the America’s Cup race
![]() Building a successful Formula 1 racing car
Building a successful Formula 1 racing car
![]() Building a new software order-entry system
Building a new software order-entry system
What the three have in common is that they can all cost more than $10,000,000 for the same reason. Each of these products is designed and constructed manually as a custom product by skilled and highly paid craftsmen.
These three have something more subtle in common too: not one of the three is likely to stay competitive for more than a few years. Another similarity is that all three are difficult and costly to modify or update once they are built.
It is obvious that none of the three activities will ever drop down significantly in cost just because the craftsmen use better tools or have more efficient processes and methods.
If any of these three expensive activities are to become really efficient and cost effective, it will be because of a fundamental principle of manufacturing economics: the substitution of standard reusable parts in place of custom development.
There are at least 12 different software artifacts that lend themselves to reusability. Unfortunately, much of the literature on software reuse has concentrated only on reusing source code, with a few sparse and intermittent articles devoted to other topics such as reusable design. Some very important aspects of reuse, such as testing materials, have almost no citations in the current literature.
From analyzing the cost breakdown of manual production of these 12 artifacts on software projects, it is possible to create a preliminary analysis of the ROI of reusing these 12 artifacts, with an admittedly large margin of error.
Table 24.3 lists the 12 artifacts that are potentially reusable for software projects, and the approximate reuse value of each, in terms of dollars returned for each dollar invested. The value approximation is based on reuse of each artifact in up to 24 software projects over a four-year period.
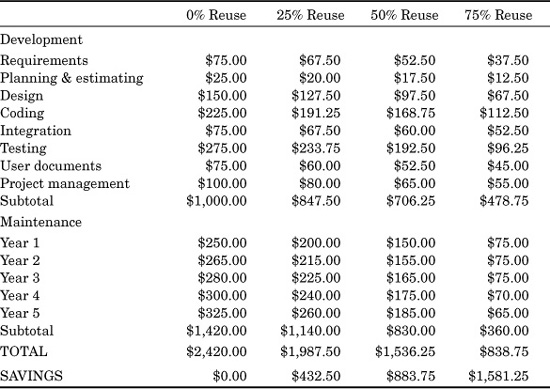
As an example of how reuse value is calculated for a specific project, consider the following hypothetical model. Assume a financial software project of 1000 function points (equal to roughly 100,000 COBOL statements) is being constructed with no reuse at all for a net cost of $1000 per function point or $1,000,000 in total. Then consider three different plateaus of reusability: 25 percent, 50 percent, and 75 percent reuse of key artifacts such as design and source code. Table 24.4 shows the cost breakdown for this project.
It is important to note that there is not a one-to-one linear relationship between the volume of reused material and costs. For example, reusing 50 percent of the source code in an application does not translate into an exact 50 percent savings in coding costs. There may be internal charges for acquiring the reusable materials. Even if the reusable component is acquired for free, there is still work involved in linking the reused material to the custom developed material, testing the link, and ensuring that the combination works properly.
There may be subtle impacts on other activities as well. Not all of the impacts are necessarily positive. It may sometimes cost more than normal to handle the requirements, design, configuration control, testing, and user documentation in a way that reflects a high volume of code reuse. Doing reuse analysis well actually requires a much more extensive activity-based reuse model that can deal with all 12 artifacts and their mutual interactions, handle customization of reused materials, deal with acquisition or creation of reused materials, and can amortize the savings or costs across multiple projects and time periods.
TABLE 24.3 Value of Software Reusability Over a Four-Year Period
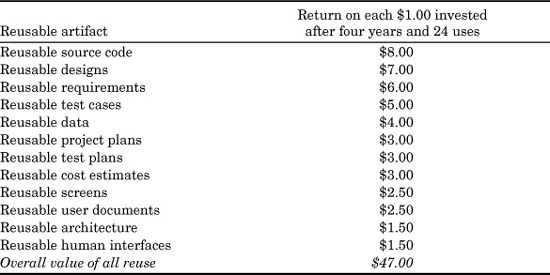
TABLE 24.4 Cost per Function Point with 0%, 25%, 50%, and 75% Reusability
Successful entry to software reuse is not inexpensive and cannot happen overnight. From analysis of the steps utilized by the most successful reuse programs, the following five step sequence is recommended:
1. Identification of reusable artifacts
2. Acquisition of reusable artifacts
3. Validation of reusable artifacts
4. Cataloging of reusable artifacts
5. Deployment of reusable artifacts
The first step toward reuse is identification of the major artifacts that will be needed. Normally, a reusability committee or task force is convened that analyzes existing applications and selects functions that have significant reuse potential. This activity will typically run for a period of roughly three calendar months and can involve from three to more than a dozen software personnel depending upon the size and geographic distribution of the software organization.
Reusable materials can either be constructed or acquired from commercial vendors. Construction is preferred for reusable materials that are highly proprietary or will have significant competitive value. Construction may also be preferred due to quality control. Commercial acquisition of reusable materials is normally for standard functions.
The object-oriented (OO) paradigm supports the concept of source code reusability by means of class libraries, inheritance, polymorphism, and several other constructs as well. However, the OO paradigm is still not totally comprehensive in its approach to software reuse. For example, reuse of design elements is still somewhat difficult under any of the standard OO design approaches. There are no current OO methods for dealing with reuse of user manual materials at all. Reuse of test cases is also still in evolution under the OO paradigm.
The construction of reusable material such as source code is normally up to twice as expensive and takes up to 50 percent longer in calendar time than single-use development. This is because of two main factors: (1) reusable materials are normally built by the most experienced and capable (and therefore expensive) software engineers; and (2) artifacts constructed for reusable purposes need very high quality levels and therefore require full 100 percent inspections and extensive testing and validation.
Because successful reuse demands very high quality, all reusable artifacts need to be certified to approximate zero-defect levels. It is uneconomical and indeed highly dangerous to attempt large-scale reuse of unvalidated material. A single “recall” of a defective component that has been used in multiple applications can damage the economic return of software reuse.
There are some fairly serious barriers that must be overcome before software reuse can even approach its economic potential. Here is a short summary of the major obstacles:
![]() First, you cannot safely reuse garbage. Successful reuse demands that the reusable materials be certified to levels of quality that approach or achieve zero defects. To be blunt, some companies are not good enough today to build anything that is worth reusing. Therefore, the primary barrier to reuse is poor quality control and careless practices that are common today.
First, you cannot safely reuse garbage. Successful reuse demands that the reusable materials be certified to levels of quality that approach or achieve zero defects. To be blunt, some companies are not good enough today to build anything that is worth reusing. Therefore, the primary barrier to reuse is poor quality control and careless practices that are common today.
![]() Second, when you set out to reuse something you have to construct that artifact with reuse in mind. It is usually not possible to casually extract reusable artifacts from ordinary software projects for high-volume corporate reuse (although individual programmers do so all the time). The second barrier is finding the time and funds to construct reusable materials initially, given the intense schedule and cost pressure most software projects are under. Software life cycles, estimating tools, planning tools, company standards, and design methods need to include specific capabilities for dealing with reusable materials. As the situation now stands, most software management tools and practices have no provision for reuse.
Second, when you set out to reuse something you have to construct that artifact with reuse in mind. It is usually not possible to casually extract reusable artifacts from ordinary software projects for high-volume corporate reuse (although individual programmers do so all the time). The second barrier is finding the time and funds to construct reusable materials initially, given the intense schedule and cost pressure most software projects are under. Software life cycles, estimating tools, planning tools, company standards, and design methods need to include specific capabilities for dealing with reusable materials. As the situation now stands, most software management tools and practices have no provision for reuse.
![]() Third, once you accumulate a useful library of reusable artifacts you need to offer some incentives to project managers and technical personnel to make use of the materials. This is not as easy as it sounds, and requires both cultural and financial changes to current practices. For example, your current measurement system may not give credit for reuse. There may also be staff resistance to making use of someone else’s work. In general, a successful reuse program must deal with social issues as well as technical issues.
Third, once you accumulate a useful library of reusable artifacts you need to offer some incentives to project managers and technical personnel to make use of the materials. This is not as easy as it sounds, and requires both cultural and financial changes to current practices. For example, your current measurement system may not give credit for reuse. There may also be staff resistance to making use of someone else’s work. In general, a successful reuse program must deal with social issues as well as technical issues.
There are many other important factors associated with reuse besides the ones discussed here, but the basic points are clear enough. Reuse has the best potential for improving financial software costs and schedules of any known technology, but there are serious barriers that must be eliminated before reuse can take its place as a major software technology.
Successful reuse requires careful validation, and many existing applications are of such marginal quality that reuse would be uneconomical and even dangerous. The fundamental point of this analysis is that a reusability program has substantial start-up costs that must be funded.
Incidentally, reusability requires that two kinds of productivity measurements be used: development productivity and delivery productivity. Suppose that you are building an application of 1000 function points in size. Now suppose that you are able to supply half of the desired features by means of reused materials.
With 50 percent reuse, that means that you will actually be developing only 500 function points. If your development productivity is 10 function points per staff month, then the project will take 50 staff months of effort for the 500 function points you must develop.
However, what you deliver to the customer will be a final application that contains 1000 function points. If you measure your delivery productivity you have supplied the customer with 1000 function points of useful features and used only 50 staff months of effort. Therefore, your delivery productivity rate is 20 function points per staff month, or twice the rate of your development productivity.
While both metrics are important and should be measured, the metric that is most important from an economic standpoint is your delivery productivity. At some point in the future it might be possible to develop the same application with 90 percent reused material or 900 function points out of 1000. In that case, your development productivity might still be only 10 function points per staff month and the project will require 10 staff months of effort. But with 90 percent reuse, your delivery productivity will have climbed to 100 function points per staff month.
Suppose it were possible to provide the same application with 100 percent reusable material. In this case, the development productivity would be zero because nothing actually got developed! But the delivery productivity would be at least 1000 function points per staff month.
As can easily be seen from these examples, it is important to distinguish between the development and the delivery of software applications.
Process Improvement Estimation
The standard form of software cost estimating is aimed at a specific project. Standard cost estimates will show the costs, schedules, and resources from the beginning of requirements of the project until deployment, and sometimes for maintenance as well.
However, many companies are anxious to improve their software development and maintenance practices. This indicates a growing need for a new kind of estimating tool that will predict the costs and schedules of moving through the stages of a software process improvement cycle.
Often such a cycle is built around the patterns of the capability maturity model (CMM) developed by the SEI. However, there is a need to estimate the costs, schedules, and value of improving software practices, whether the specific method used is the CMM, six-sigma, or something else.
It is technically possible to produce an estimating tool that can deal with process improvements. However, while there are prototypes and in-house tools circa 2007, there are no major commercial tools that deal with the economics of software process improvements.
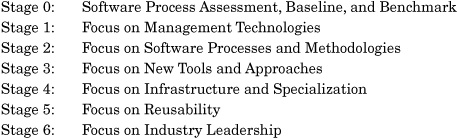
Significant software process improvements do not occur in random patterns. When you generalize the patterns used by companies that have gone the farthest and are the best overall, you can see that the initial activity is an assessment and a baseline, followed by a six-stage improvement program:
The first place to start for a process improvement program is management. The reason for this is because managers need to produce the ROI and cost data to fund the rest of the improvement program.
Following is some general information based on the overall size of companies in terms of software personnel. The cost data in Table 24.5 is expressed in terms of “cost per capita,” or the approximate costs for each employee. The cost elements include training, consulting fees, capital equipment, software licenses, and improvements in office conditions.
The sizes in Table 24.5 refer to the software populations, and divide organizations into four rough size domains: less than 100 software personnel, less than 1000, less than 10,000, and more than 10,000, which implies giant software organizations such as IBM, Microsoft, and EDS, all of which have more than 25,000 software personnel corporate wide.
Table 24.5 is not a substitute for an actual estimating tool aimed at process improvement and tailored for a specific company. It simply provides generic data and approximate values. The information should not be used for serious business purposes.
As can be seen from Table 24.5, a formal process improvement program is not inexpensive. Therefore, part of the estimate must be to show the value of such a significant pattern of expenses. However, there is other data needed first.
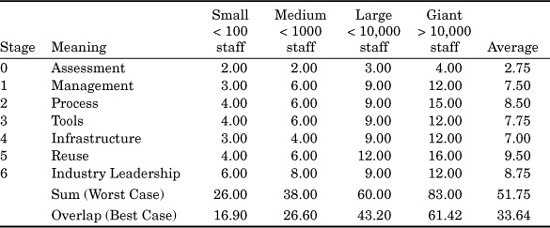
The next topic shown in Table 24.6 is how long it will take to move through each of the stages of the process improvement sequence.
A process improvement program is of necessity a multiyear endeavor. As can be seen, smaller companies can move much more rapidly than large corporations and government agencies.
Large corporations and government agencies cannot move quickly even if everyone is moving in the same direction. When there is polarization of opinion or political opposition within the organization, progress can be very slow or nonexistent.
The next topic is what kind of value or return on investment will occur from software process improvements?
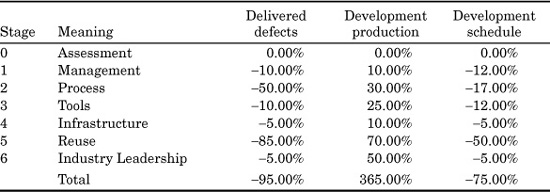
Table 24.7 shows only the approximate improvements for productivity, costs, and quality (here defined as reductions in software defect levels). The results are expressed as percentage improvements compared to the initial baseline at the start of the improvement process.
TABLE 24.5 Process Improvement Expenses Per Capita
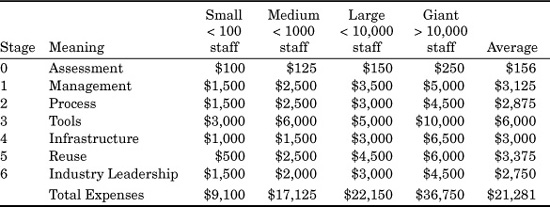
TABLE 24.6 Process Improvement Stages in Calendar Months
As can be seen from this rough analysis, the maximum benefits do not occur until stage 5, when full software reusability programs are implemented. Since reusability has the best return and greatest results, it is frequently asked why it is not the first stage.
The reason that software reuse is offset to stage 5 is that a successful reusability program depends upon mastery of software quality and a host of precursor software technologies such as formal inspections and formal development processes. Unless software quality is at state of the art levels, any attempt to reuse materials will result in longer schedules and higher costs than you have right now!
When a multiyear software process improvement is in about its third year, the following kinds of results should be achievable:
![]() Set aside 12 days a year for training in software management topics
Set aside 12 days a year for training in software management topics
![]() Set aside 10 days a year for training in software engineering topics
Set aside 10 days a year for training in software engineering topics
![]() Establish a software “center for excellence” to pursue continuous improvements
Establish a software “center for excellence” to pursue continuous improvements
TABLE 24.7 Improvements in Software Defect Levels, Productivity, and Schedules
![]() Budget $1500 per capita per year for improved tools and training
Budget $1500 per capita per year for improved tools and training
![]() Achieve Level 3 status on the SEI CMM or CMMI maturity scale
Achieve Level 3 status on the SEI CMM or CMMI maturity scale
![]() No more than 5 percent difference between estimated schedules and real delivery dates
No more than 5 percent difference between estimated schedules and real delivery dates
![]() No more than 5 percent difference between estimated costs and actual costs
No more than 5 percent difference between estimated costs and actual costs
![]() Defect-removal efficiency averages above 97 percent as the corporate average
Defect-removal efficiency averages above 97 percent as the corporate average
![]() Defect potentials average below 3.0 per function point as the corporate average
Defect potentials average below 3.0 per function point as the corporate average
![]() Development schedules reduced by 50 percent from requirements until delivery
Development schedules reduced by 50 percent from requirements until delivery
![]() Development productivity rates increased by more than 50 percent
Development productivity rates increased by more than 50 percent
![]() Development costs reduced by more than 40 percent
Development costs reduced by more than 40 percent
![]() Maintenance costs reduced by 50 percent for all maintenance work
Maintenance costs reduced by 50 percent for all maintenance work
![]() More than 50 percent reusability by volume for design, code, and test artifacts
More than 50 percent reusability by volume for design, code, and test artifacts
![]() Establish an in-house measurement department
Establish an in-house measurement department
![]() Monthly reports on software quality and defect removal produced
Monthly reports on software quality and defect removal produced
![]() Annual “state of the art” report produced to show accomplishments
Annual “state of the art” report produced to show accomplishments
Not every software process improvement program is a success. In fact, the rate of change is proportional to the level of management and technical sophistication at the beginning of the improvement campaign. If an organization is really lagging the state of the art, the costs and schedules to achieve tangible improvements may be so high that perhaps switching over to an outsource model would provide a better return on investment.
Methodology Analysis and Software Cost Estimating
Suppose you are a project manager who is going to be responsible for the software development effort connected with a PBX switching system. You know from previous PBX applications constructed by your company that the size of the application will be about 1500 function points or roughly 187,500 statements in the C programming language.
You also know, because of the nature of the application, that high levels of reliability are mandatory. This implies that quality control must be at state-of-the-art levels.
The vice president in charge of both the hardware and software sides of the product has a joint meeting with you and the hardware engineering manager. One of the questions that the vice president asks is this: “What software methodology are you planning to use on this project?”
Table 24.8 lists a sample of some of the possible answers to this basic question.
TABLE 24.8 Software Development Methods
1. Action diagrams
2. Actor-based development
3. Adaptive system development
4. Assembly, disassembly, reassembly (ADR)
5. Agile development
6. Capability maturity model (CMM)
7. Capability maturity model integration (CMMI)
8. Clean-room development
9. Code inspections
10. Commercial off-the-shelf software (COTS)
11. Component-based development (CBD)
12. CRC diagrams
13. Crystal development approach
14. Data flow diagrams
15. Data structured system design (DSSD)
16. Decision tables
17. Decision trees
18. Design inspections
19. Dynamic system development method (DSDM)
20. Enterprise Resource Planning (ERP)
21. Entity-relationship diagrams
22. Extreme programming (XP)
23. Feature-driven development (FDD)
24. Finite state diagrams
25. Flowcharts
26. HIPO diagrams
27. Incremental development
28. Information Engineering (IE)
29. ISO 9000–9004 standards
30. Iterative development
31. Jackson diagrams
32. Nassi-Shneiderman charts
33. Object-oriented development (OO)
34. Open-source components
35. Outsourcing – Domestic
36. Outsourcing – International
37. Pattern-based development
38. Petri nets
39. Pseudocode
40. Quality Function Deployment (QFD)
41. Rapid Application Development (RAD)
42. Rational development method
43. Scrum
44. Six-sigma for software
45. Spiral development
46. State transition diagrams
47. Structured development
48. Structured English
49. Team Structured Process (TSP)
50. Total Quality Management (TQM)
51. Tropos software development method
52. Unified modeling language (UML)
53. Use cases
54. User stories
55. Vienna development method (VDM)
56. Warnier-Orr diagrams
57. Waterfall development
58. Zermelo-Frankel Z Notation
Not all of these methods are relevant to the project in question. Recall that this is a joint hardware/software project. Also recall the need for high reliability and excellent quality control. With these two constraints, the most likely subset of these 58 possible approaches might be the following:
1. Capability maturity model integration (CMMI)
2. Code inspections
3. Design inspections
4. Object-oriented development (OO)
5. Quality Function Deployment (QFD)
6. Six-sigma for software
7. Unified modeling language (UML)
8. Use cases
If these eight approaches are utilized, then the development productivity of the PBX software would probably be about 10 function points per staff month. The schedule would probably be about 18 calendar months. The defect potential would be around 4.0 defects per function point, and the defect removal efficiency would probably be about 98 percent. The number of latent defects at delivery would be about 120, of which perhaps 10 would be of high severity levels.
Once deployed, the maintenance and customer support costs would be about $150 per function point per year. Therefore, the maintenance and support costs for the first two years of deployment would be about $225,000 per year, or $450,000 in all.
This kind of situation is a daily occurrence for software cost estimation. In order to deal with such situations, estimating tool vendors need to be cognizant of essentially all of the common software design and development methods in use.
Since the nature, scope, and class of a software application is a preliminary input to many software cost-estimation tools, such basic information can allow the tool to select the most appropriate sets of development approaches from the full repertory that might be available. The tool’s choices will be displayed to the person doing the estimate, and the choices can either be accepted or replaced by some other choice.
There is no guarantee that a particular project will use the most probable set of development approaches. For the same PBX project, suppose the project manager selected a completely different set:
1. Agile development
2. User stories
Under this alternate scenario the development productivity would be about 15 function points per staff month. The development schedule would be about 14 calendar months. However, the defect potential for this method of development would be about five defects per function point. The defect-removal efficiency would be about 90 percent. The number of defects at delivery would be about 750, of which perhaps 75 would be of high severity levels.
Under this alternate scenario, the annual maintenance costs would be about $300 per function point per year for the first two years. Therefore, the annual maintenance costs would be about $450,000 per year or $900,000 in all.
Here too we have a fairly typical situation for commercial software cost-estimating tools: predicting the outcome of two very different ways of designing and building the same application.
Note that the two examples discussed in this chapter are hypothetical, and merely illustrate the fact that there are many different ways of designing and building software applications. Each of these many ways will have a characteristic productivity, schedule, and quality pattern associated with it.
What makes this a complex and challenging task for the software estimating vendors is the fact that for about 35 of the 58 possibilities shown in Table 24.8, there is little or no empirical data available from historical projects. Adding to the problems of calibrating all of the various development approaches that might be used, some of the historical data will have been measured with lines-of-code-metrics, some with function point metrics, and some with newer metrics such as object points or use case points. For these disparate measurement methods, there is no easy way of analyzing the results to find out which was the most effective approach.
There is a need for much more research on various alternative methods for building software applications in order know the actual results that have been achieved. For each approach there is a need to evaluate costs, schedules, staffing, productivity, and quality results. There is also a need to know how the method works on applications that range from less than 100 function points in size to more than 100,000 function points in size. And there is a need to know how the method works on many different kinds of software including but not limited to web-based applications, information systems, embedded software, military software, systems software, and perhaps even game and entertainment software.
Summary and Conclusions About Software Cost-Estimating Research
Software cost estimating is a fairly sophisticated technology circa 2007 but it is far from perfect. Like any other technology, there are boundaries that have not yet been crossed. The ten issues discussed in this chapter illustrate some of the problems that need to have additional research and development in order to improve software cost-estimating technologies in the future. These are not the only topics that need additional exploration. The software cost-estimating world needs to evolve and improve over time like any other successful technology.