
Chapter 22
Estimating Software Project Management
In round numbers, the project management function will contribute between 10 and 20 percent to the cost of software projects. Project managers also exert a strong influence on schedules, quality, and team morale. For large software projects, failures and disasters are more closely correlated to poor project management than to poor technical work. In fact, poor project management can cause poor technical work by skimping on inspections and quality control activities and by creating excessively optimistic cost and schedule estimates.
Estimating the work of software project managers is surprisingly complicated, and is supported by very little in the way of solid empirical data. In fact, even the roles and responsibilities of project managers can vary from company to company, and from project to project within the same company.
The literature on software project management is extensive, but slanted heavily toward how-to-do-it books. Books that contain quantitative data on the costs of project management or even on such rudimentary topics as the ranges on software project spans of control are quite rare.
Some of the books that do deal with software project management include Fred Brooks’s Mythical Man-Month (Addison-Wesley, 1974), Barry Boehm’s Software Engineering Economics (Prentice-Hall, 1981), and several of the author’s own books, such as New Directions in Software Management (Information Systems Management Group, 1993) and Patterns of Software Systems Failure and Success (International Thomson Computer Press, 1995). Lois Zells comes at software project management from the viewpoint of the tools utilized in Managing Software Projects (QED Information Sciences, 1990).
Although not a book about estimating management, Watts Humphrey’s book Managing Technical People (Addison-Wesley, 1997) provides valuable insights. The cognitive psychologist Dr. Bill Curtis succeeded Watts as head of the SEI’s assessment research group, and has also contributed to the management literature in the form of the SEI’s people capability model.
Some more recent books include Donald Reifer’s Software Management, Sixth Edition (IEEE Press, 2002) and the sections from Roger Pressman’s Software Engineering—A Practitioner’s Approach, Sixth Edition (McGraw-Hill, 2005) that discuss planning, estimating, and measurement.
The Project Management Institute (PMI) has dozens of relevant titles dealing with multiple issues. PMI is the largest non-profit association in the project management world. Membership in PMI opens up many programs and additional sources of information for project managers.
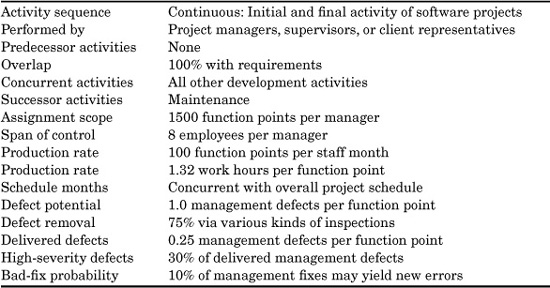
The nominal default values for software project management are easy to state (see Table 22.1), but these values are not very useful because the range of project management functions is extremely broad. Also, the span of control or number of staff reporting to a project manager can range from a low of 1 to a high of more than 30 technical staff members.
The activity of software project management has not traditionally been estimated or measured using lines-of-code-metrics. Project management cannot be directly measured using function points either, but it is possible to reconstruct both function point and LOC values.
Suppose for example a 1500–function point (roughly equivalent to a size of 150,000 C statements) project has a team of eight programmers and one manager. In this example the assignment scope for the programmers will be 188 function points or 18,750 source code statements. That is the average amount assigned to each team member. Since there is only one manager, the assignment scope for him or her will be 1500 function points or 150,00 source code statements. This is not to say that the manager actually develops any code (although some do). It is merely a mathematical expression for the quantity of technical material that one manager might be able to handle.
TABLE 22.1 Nominal Project Management Default Estimating Values
The standard way of dealing with project management, which is used for many kinds of projects and not just software, centers around the span-of-control concept.
The management span of control refers to the number of technical employees who report to a specific project manager. The concept has been studied and explored for various industries for more than a century. The nominal average for the number of employees reporting to a manager in the United States is about eight employees per manager.
However, for software projects among SPR’s clients, the observed ratios of employees to managers has run from 1 to 1 to as high as 30 to 1.
Software project managers have personnel responsibilities as well as project management responsibilities. Most project managers are also responsible for appraisals and personnel counseling, for hiring, and for other aspects of human resource management, such as approving education and training requests.
In addition, software project managers have departmental roles for budgets, arranging for office space, approving travel requisitions, ordering supplies, and so forth. The generic rules of thumb for software project managers among SPR’s clients resemble the following:
![]() One project manager for every eight technical staff members
One project manager for every eight technical staff members
![]() One full-time project manager for every 1500 function points
One full-time project manager for every 1500 function points
![]() One project manager for roughly every 150,000 source code statements
One project manager for roughly every 150,000 source code statements
![]() Project management starts before requirements and runs after the project ends
Project management starts before requirements and runs after the project ends
![]() Project management work = 35 percent of available management time
Project management work = 35 percent of available management time
![]() Personnel work = 30 percent of available management time
Personnel work = 30 percent of available management time
![]() Meetings with other managers or clients = 22 percent of available management time
Meetings with other managers or clients = 22 percent of available management time
![]() Departmental work = 8 percent of available management time
Departmental work = 8 percent of available management time
![]() Miscellaneous work = 5 percent of available management time
Miscellaneous work = 5 percent of available management time
To understand why these nominal default values fluctuate very widely, it is necessary to understand the real-life situations that often affect the work of software project managers. The main variable factors that can influence software project managers’ jobs, and hence also influence cost estimates, include the following:
![]() The roles assigned to (or assumed by) the project manager for activities such as sizing, cost estimating, quality estimating, departmental budgeting, personnel hiring and appraisals, space allocation, milestone tracking, cost tracking, quality tracking, measurement, and the like.
The roles assigned to (or assumed by) the project manager for activities such as sizing, cost estimating, quality estimating, departmental budgeting, personnel hiring and appraisals, space allocation, milestone tracking, cost tracking, quality tracking, measurement, and the like.
![]() Whether the project manager is a pure manager, or also contributes to the project in a technical way. For example, some software project managers may also serve as chief programmers and, hence, perform technical work as well as managerial work.
Whether the project manager is a pure manager, or also contributes to the project in a technical way. For example, some software project managers may also serve as chief programmers and, hence, perform technical work as well as managerial work.
![]() The nature of the project, and whether it is a pure software project or a hybrid project that also involves engineered components, manufactured components, microcode, or some other kinds of work besides software development.
The nature of the project, and whether it is a pure software project or a hybrid project that also involves engineered components, manufactured components, microcode, or some other kinds of work besides software development.
![]() External pressures applied to the project, and hence to the project manager, from clients or senior management, in terms of schedule pressure, cost-containment pressure, or some other forms of pressure that occur less often, such as the need to achieve very high performance levels.
External pressures applied to the project, and hence to the project manager, from clients or senior management, in terms of schedule pressure, cost-containment pressure, or some other forms of pressure that occur less often, such as the need to achieve very high performance levels.
![]() The suite of project management tools available and utilized by the project manager, including cost-estimating tools, project-scheduling tools, methodology management tools or process management tools, quality-estimation tools, tracking tools, and the like.
The suite of project management tools available and utilized by the project manager, including cost-estimating tools, project-scheduling tools, methodology management tools or process management tools, quality-estimation tools, tracking tools, and the like.
![]() The number of other managers involved on the project simultaneously, and whether large projects are organized in a hierarchical or matrix fashion. Surprisingly, software productivity for entire projects tends to correlate very strongly, and inversely, with the number of managers engaged. Large software projects with many managers have a very strong probability of running late, exceeding budgets, being canceled, or even all three at once.
The number of other managers involved on the project simultaneously, and whether large projects are organized in a hierarchical or matrix fashion. Surprisingly, software productivity for entire projects tends to correlate very strongly, and inversely, with the number of managers engaged. Large software projects with many managers have a very strong probability of running late, exceeding budgets, being canceled, or even all three at once.
![]() Time-splitting among multiple projects, which can occur when a project manager is simultaneously responsible for several small projects, rather than one discrete project or one component of a really large system.
Time-splitting among multiple projects, which can occur when a project manager is simultaneously responsible for several small projects, rather than one discrete project or one component of a really large system.
![]() The span of control, or the number of technical workers assigned to any given manager.
The span of control, or the number of technical workers assigned to any given manager.
![]() The number of different kinds of software occupations among the workers assigned to a given manager.
The number of different kinds of software occupations among the workers assigned to a given manager.
![]() The presence or absence of a project office for larger projects, and the division of work between individual project managers and the project office.
The presence or absence of a project office for larger projects, and the division of work between individual project managers and the project office.
![]() The experience level of the project manager in terms of having managed projects similar to the current project.
The experience level of the project manager in terms of having managed projects similar to the current project.
![]() The set of quality-control activities that the project manager establishes for the project.
The set of quality-control activities that the project manager establishes for the project.
Let us consider the implications of all of these project management factors in turn.
The Roles of Software Project Management
The responsibilities and roles of a software project manager can be divided into three distinct components:
![]() The role of personnel management
The role of personnel management
![]() The role of departmental management
The role of departmental management
![]() The role of specific project management
The role of specific project management
Personnel management may not always be delegated to a project manager under the matrix method of organization, although it is a normal responsibility under the hierarchical method of organization. When present, the personnel role includes, but is not limited to the following:
![]() Interviewing candidates
Interviewing candidates
![]() Creating job offers and benefits packages, within human resources guidelines
Creating job offers and benefits packages, within human resources guidelines
![]() Performing personnel appraisals
Performing personnel appraisals
![]() Approving training or education requests
Approving training or education requests
![]() Issuing awards, if indicated
Issuing awards, if indicated
![]() Disciplinary matters, if needed
Disciplinary matters, if needed
![]() Terminations and layoffs, if necessary
Terminations and layoffs, if necessary
![]() Participation in various human resources programs
Participation in various human resources programs
![]() Receiving guidance based on morale surveys
Receiving guidance based on morale surveys
The personnel aspects of the project manager’s job are important, and personnel-related issues can often occupy 25 to 40 percent of a manager’s daily time. In some situations, such as when there are “open door” issues or some kind of serious morale problems present, personnel-related work can top 60 percent of a manager’s daily time.
From an estimating point of view, not all of the manager’s personnel activities are related to a specific project. Therefore, it is important to know whether the manager’s personnel work is to be charged to a specific project, or is general in nature and should be classed as overhead work.
The departmental management role includes, but is not limited to the following:
![]() Participating in annual or semiannual budget creation exercises
Participating in annual or semiannual budget creation exercises
![]() Dealing with facilities management on space and office issues
Dealing with facilities management on space and office issues
![]() Approving travel plans
Approving travel plans
![]() Requesting or approving requisitions for computers and equipment
Requesting or approving requisitions for computers and equipment
![]() Participating in special studies, such as SEI or SPR assessments, ISO audits, or business process reengineering (BPR) reviews
Participating in special studies, such as SEI or SPR assessments, ISO audits, or business process reengineering (BPR) reviews
In larger corporations, the creation of annual departmental budgets is often one of the most expensive “products” that the company builds. Every project manager can devote from two weeks to more than a month each year to budget preparation, budget review meetings, and budget revision work.
The budgeting process is usually a departmental exercise, hence, the work may affect many different software projects, although for very large software systems an entire budget may be devoted to only a single project. However, it is more common for a typical department of eight technical staff members and a manager to have dozens of projects in the course of a single calendar year, and some projects that surface toward the end of the year may not even be visible at the time the annual budgets are first being planned.
Because project managers are often department managers too, the overhead work of managing a department can amount to about 1 month out of 12, or perhaps 8 percent of a project manager’s annual effort. Here, too, the departmental work can be much larger, but is seldom smaller.
The project management role, which is the primary focus of this chapter, generally includes 12 key activities that are specifically associated with the project management function:
![]() Coordinating with clients on the project
Coordinating with clients on the project
![]() Coordinating with higher management on project resources and status
Coordinating with higher management on project resources and status
![]() Coordinating with other managers on large projects
Coordinating with other managers on large projects
![]() Technology and tool selection for the project
Technology and tool selection for the project
![]() Sizing, or predicting the volumes of deliverables to be created
Sizing, or predicting the volumes of deliverables to be created
![]() Cost estimating, or predicting the probable total expenses for the project
Cost estimating, or predicting the probable total expenses for the project
![]() Schedule estimating, or predicting the nominal end date for the project
Schedule estimating, or predicting the nominal end date for the project
![]() Quality estimating, or predicting the probable numbers of bugs or defects
Quality estimating, or predicting the probable numbers of bugs or defects
![]() Milestone estimating, or predicting the dates of key events
Milestone estimating, or predicting the dates of key events
![]() Tracking, or monitoring progress against key milestones
Tracking, or monitoring progress against key milestones
![]() Progress reporting, or creating monthly (or weekly) status reports
Progress reporting, or creating monthly (or weekly) status reports
![]() Measurement, or collecting and normalizing data about the project
Measurement, or collecting and normalizing data about the project
It is the set of key activities associated with actually estimating, planning, and tracking projects that is the heart of the project manager’s role. These are the activities that can spell success for projects when they are done well, or failure for projects if they are done poorly or contain significant errors.
Estimating, tracking, and reporting are interleaved activities that can occur almost continuously during the development cycles of software projects. The work of these key tasks will vary significantly based on whether manual methods or automated methods are utilized. If manual methods are used, estimating and planning can absorb about 35 percent of a project manager’s time on major projects. If automated estimating and planning tools are used, estimating and planning can drop well below 10 percent.
Project Managers Who Are Also Technical Contributors
Because one of the most common origins for software project managers is a promotion from programmer to project manager, it is not surprising that many project managers also perform technical work, too. In fact, it is extremely common in the software industry for project managers to continue to serve as chief programmers on the projects that they manage.
Obviously, for estimating the work of project managers, it is necessary to separate the managerial tasks from the technical tasks. When project managers are also technical contributors, the task of estimating both the managerial component and the technical component becomes complex.
Many managers who wear two hats and also do technical work tend to have very intense work ethics and put in a lot of overtime. Usually, technical work dominates and absorbs about 60 percent of the manager’s time, while the usual managerial work absorbs about 40 percent. However, we’re dealing with work weeks that often include 20 hours or more of unpaid overtime.
The reason that software project managers often do technical work is because many of them were promoted into management from programming or software engineering work. There is a school of thought that asserts that the personality attributes of good programmers are so different from the personality attributes of good managers that a career progression from software engineer to software manager may not be effective. Although there may be some truth to this hypothesis, there is no other source of software management that has been proven to be more effective than the available pool of programming talent.
Project Management for Hybrid Projects Involving Hardware and Software
Many complex systems include hardware, software, and microcode at the same time. When hybrid projects are being developed, the project management tasks for estimating, schedule planning, and other activities grow more complicated and more time-consuming. Obviously, the final estimate and plan for hybrid projects must integrate the software and hardware components.
Also, from the point of view of cost tracking and cost management, it is more complicated to keep track of software costs versus hardware costs when both are going on simultaneously.
The distribution of management time between hardware and software components of hybrid systems is seldom a 50/50 split. Obviously, the proportions will vary with the magnitude of software work versus the magnitude of engineering work. However, there are also variations with a sociological origin. For example, if the project manager has an electrical or mechanical engineering background, then less time might be spent on software than if the project manager has a computer science or software engineering background.
However, because software is usually the component that has the greatest chance of running late and exceeding budgets, project managers from all backgrounds will need to concentrate their energies on the software component if problems begin to accumulate.
Project Management and External Schedule Pressures
One of the more difficult aspects of being a project manager is that of being subject to external pressures from both clients and senior executives. The most common pressure applied to project managers is that of schedule pressure, but other topics may also be under external pressures, such as costs or (less frequently) quality.
The best defense for dealing with external pressure is accurate historical data derived from similar projects. For example, suppose you are a project manager responsible for a project of 1000 function points or 100,000 source code statements. You have a team of five, and a planned 18-month development schedule based on team capabilities. It would not be surprising for either the clients or senior management (or both) to try to force the project schedule to be cut back to 12 months.
If you have no empirical data from similar projects, it is hard to defend your plans against this kind of external pressure. But if you know that based on a sample of 50 similar projects, 0 percent have been completed in 12 months, 50 percent have been completed in 18 months, 40 percent have run longer than 18 months, and 10 percent have been completed in 15 to 18 months, then you have a solid basis for defending your plan, and it is not likely to be overturned in an arbitrary manner.
The primary value of mounting a rational defense against irrational schedule pressure from outside is because project managers who succumb to these external pressures often see their projects fail or suffer severe cost and schedule overruns. Unfortunately, if the project manager has no empirical data from similar projects, and is not using any of the automated estimating tools with a built-in knowledge base, then succumbing to external schedule pressures is hard to avoid.
Many major software disasters occur because clients or executives with little or no knowledge about the realities of software estimating and software schedules force impossible delivery dates on helpless project managers, whose own knowledge of estimating and scheduling is not sufficient or not credible enough to keep the project on a realistic schedule.
Project Management Tools
The phrase project management has been artificially narrowed by vendors so that many people think the phrase describes only a limited set of tools that can produce Gantt charts and PERT diagrams, perform critical path analysis, and handle the mechanics of scheduling and cost accumulation.
However, there are a number of specialized software project management tools that are aimed specifically at software projects and can augment the somewhat limited software abilities of the traditional project management tools, such as Microsoft Project, Timeline, Primavera, Artemis, and the like. (The traditional project management tools have no built-in software knowledge base and cannot deal with many important software topics, such as sizing, creeping requirements, and quality estimating.)
Among the specialized tools aimed specifically at software project managers can be found specialized software cost-estimating tools and specialized methodology or process management tools. There are also automated “project offices” for capturing progress and historical data.
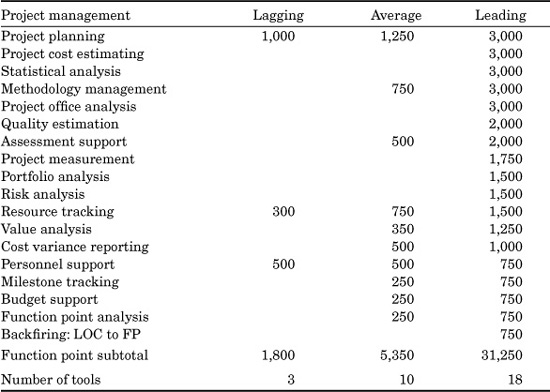
Table 22.2 discusses some of the differences in project management tools noted in lagging, average, and leading organizations. Both counts of numbers of tools and also the usage of the features of those tools is illustrated.
TABLE 22.2 Numbers and Size Ranges of Project Management Tools (Size data expressed in terms of function point metrics)
The counts of the numbers of tools is simply based on assessment and benchmark results and our interviews with project personnel. Although projects vary, of course, deriving the counts of tools is reasonably easy to perform.
The sizes of the tools expressed in function points are more difficult to arrive at, and have a larger margin of error. For some kinds of tools such as cost-estimating tools actual sizes are known in both function point and lines-of-code form because the author’s company builds such tools.
For many tools, however, the size data is only approximate and is derived either from “backfiring,” which is conversion from lines of code to function points, or from analogy with tools of known sizes. The size ranges for tools in this report are interesting, but not particularly accurate. The purpose of including the function point size data is to examine the utilization of tool features in lagging and leading projects.
In general, the lagging projects depend to a surprising degree on manual methods and have rather sparse tool usage in every category except software engineering, where there are comparatively small differences between the laggards and the leaders.
The differences in project management tool usage is both significant and striking. The lagging projects typically utilize only three general kinds of project management tools, while the leading projects utilize 18. Indeed, the project management tool family is one of the key differentiating factors between lagging and leading projects.
In general, the managers on the lagging projects typically use manual methods for estimating project outcomes and measuring progress, although quite a few may use schedule planning tools such as Microsoft Project. However, project managers on lagging projects tend to be less experienced in the use of planning tools and to utilize fewer of the available features.
The sparseness of project management tools does much to explain why so many lagging software projects tend to run late, to exceed their budgets, or to behave in more or less unpredictable fashions.
By contrast, the very significant use of project management tools on the leading projects results in one overwhelming advantage: “No surprises.” The number of on-time projects in the leading set is far greater than in the lagging set, and all measurement attributes (quality, schedules, productivity, etc.) are also significantly better.
Differences in the software project management domain are among the most striking in terms of the huge differential of tool usage between the laggards and leaders. Variances in the number of tools deployed is about 6 to 1 between the leaders and the laggards, while variances in the tool capacities expressed in function points has a ratio of almost 17 to 1 between the leaders and the laggards. These differences are far greater than almost any other category of tool.
Since this book is about software cost estimating rather than overall project management, it is appropriate to discuss the pros and cons of automated software cost-estimating tools. Among the most important advantages is that these tools contain extensive built-in knowledge bases derived from hundreds or thousands of software projects, and can handle such specialized topics as predicting the number of bugs or defects, estimating the rate of creeping user requirements, or automatically changing the estimate in response to different technologies, such as making an adjustment if the programming language switches from C to C++. These specialized software cost-estimating tools can interface with traditional project management tools, and together the results can be very useful. Another advantage is that the accuracy of software cost-estimating tools is often better than manual estimates by project managers. Indeed, from time to time the accuracy of costestimating tools has been shown to be higher than the historical data used to calibrate the tool! (Sometimes the historical data had gaps such as production of user manuals and the work of software quality assurance (SQA) specialists. These activities were present in the automated cost estimates. When the reasons why the cost estimates showed higher costs than historical data, it was discovered that the historical data was incomplete.)
The “cons” of acquiring and using commercial software cost-estimating tools are threefold:
![]() The learning curve to use the tools effectively is not trivial.
The learning curve to use the tools effectively is not trivial.
![]() The tools need to be calibrated to local conditions.
The tools need to be calibrated to local conditions.
![]() Some of the better cost-estimating tools are fairly expensive.
Some of the better cost-estimating tools are fairly expensive.
The best-in-class software organizations have a suite of very powerful and effective project management tools, of which traditional project management or scheduling tools are only one component. Cost-estimating and tracking tools are also major components of the project management suites.
Overall, successful projects have more than an order of magnitude more project management tools available than do the set of failing projects. In fact, the two most significant differences between failing projects and successful ones are the suites of available tools for project management and for quality control. In both project management and quality-control tools, the leaders outrank the laggards by about an order of magnitude in terms of tool deployment.
(Interestingly, the suites of software development tools do not show any major differences between successful, average, and failing projects. All three tend to use between 30,000 and 50,000 function points of software design and development tools.)
The use of function point metrics for evaluating tool suites is one of the newer uses of function point metrics, but one that is already producing very interesting results.
Note that the tools shown here are those directly associated with software project management roles. In addition to these tools, project managers may have another 10,000 function points of human-resource tools and about 5000 function points of departmental tools for such things as budgets, capital expenditures, travel cost reporting, and the like.
Project Management on Large Systems with Many Managers
Really large systems in the 100,000–function point range may have more than 500 technical staff members and 50 or more project managers. These large systems are very difficult to manage, and a considerable amount of project management effort is devoted to meetings and coordination with other managers.
Indeed, assuming that the system is large enough to have ten project managers engaged, about 30 percent of monthly project management time will be spent in meetings with other managers. These coordination meetings can absorb even more than 38 percent of managerial effort, because these large systems usually have multiple layers of management so that the planning meetings may involve first-line managers to whom the technical staff reports, second-line managers to whom the first-line managers report, and perhaps even third-line and fourth-line managers on really large systems. (Above the third line, management titles usually change to something like director or vice president.)
It is an interesting phenomenon that software productivity, like any other human activity, declines as the number of workers simultaneously engaged grows larger. However, for software projects the rate at which software productivity declines is directly proportional to the number of managers that are concurrently engaged in the overall system.
This phenomenon explains some otherwise curious results, such as the fact that software projects organized in a matrix fashion often have lower productivity than the same size project organized in a hierarchical fashion. The matrix style of organization deploys more managers for any given project size than does the hierarchical style, and that alone may be sufficient to explain the reduced productivity levels.
In the matrix organization, the set of project management roles may not include personnel functions. Often, under a matrix organization there are permanent department or career managers to whom employees report for appraisal and salary review purposes, and project managers to whom the employees report temporarily for the duration of the project.
The matrix organization more or less resembles a task force in the military sense. Under the task force concept military units are aggregated together for a specific mission, and then return to their usual locations when the mission is over. For example, during World War II ships from the American Fifth Fleet and the Seventh Fleet were combined for several months for a specific campaign, and then reverted to their normal commands afterwards.
Under the matrix organization personnel from a number of departments are aggregated together for a specific project, and when the project is over they return to their normal organizations for reassignment.
Under the matrix organization, as previously noted, technical employees usually report simultaneously to two managers:
![]() Their departmental managers, for personnel and salary matters
Their departmental managers, for personnel and salary matters
![]() The project manager, for technical matters
The project manager, for technical matters
Under a hierarchical organization, on the other hand, the personnel on larger projects are organized in a pyramidal fashion like a traditional military organization, with the overall project director at the top and all subordinate units reporting upward in a standard chain of command.
For example, suppose you are concerned with a software project that is 10,000 function points or 1 million lines of code in size. If this project is organized in a hierarchical fashion, there might be 50 programmers and 6 project managers involved.
If it is organized in a matrix fashion, there might still be 50 programmers, but now the management complement is up to 10. There is a good chance that the productivity of the matrix version might be about 10 to 15 percent below the productivity of the hierarchical version.
Part of the reduction can be attributed to the four additional managers, but another portion of the reduction is because matrix management tends to add a certain level of confusion to projects which is absent in the hierarchical fashion.
Not all matrix projects fail or even are below the hierarchical style in net results, because many other factors are at play. However, from considering the results of 100 matrix projects and comparing them to 100 hierarchical projects, the matrix projects often lag the hierarchical ones.
Time-Splitting, or Managing Several Projects Simultaneously
In addition to having multiple managers on large systems, it is also common to have multiple small projects assigned to a given project manager. The reason for this is because department sizes are often constant within a company and average about eight employees per manager, but project sizes can range from a low of less than 1 function point to more than 100,000 function points.
Suppose your company has a traditional department structure with one manager for every eight technical staff members. Now suppose your company is interested in building two small projects that are each 800 function points in size and will require about four programmers.
Since department sizes are more or less fixed but project sizes are not, it would be typical to see both of these projects assigned to the same department and, hence, both have the same project manager.
This is merely a simple example. Suppose your company wants to do eight simultaneous projects, each of which is 200 function points in size. Under this second scenario, the same project manager would be responsible for all eight projects concurrently.
Although small projects do not require as much technical effort as large systems, there is a certain amount of irreducible overhead associated with projects in many companies. For example, each project may need its own cost estimate, its own monthly report, its own status meetings, and the like.
This means that project managers supporting multiple projects concurrently will have a much different time distribution than project managers supporting only one project. More time must be devoted to administrative matters and, sometimes, to additional meetings with clients.
This means that time devoted to personnel matters may be reduced, or managerial overtime may go up. In any case, estimating project management time when the manager is supporting multiple, independent projects is a tricky situation.
In companies that do not separate new development work from maintenance work, it is very common for a department that is doing development work in the form of an enhancement to an existing application to also be responsible for bug repairs on prior releases.
Because each incoming bug can be viewed as a kind of microproject, it is very common to have both technical personnel and project managers dealing with new development and maintenance simultaneously. This situation makes project cost estimating very complex, because the maintenance work interferes with the development work, and, hence, development will become erratic and hard to predict.
The Span of Control, or Number of Staff Members per Manager
If every manager had the same number of technical employees reporting in, then estimating project management work would be a great deal easier than it is. The span of control, or number of technical workers reporting to a manager, averages about eight employees, but the range runs from a low of 1 to a high of about 30.
The span-of-control concept originated more than 100 years ago in some of the pioneering work on army units after the close of the U.S. Civil War. The original purpose was to discover how fast troop units of various sizes could move from one place to another. It was quickly discovered that small units of less than 20 (squads, platoons) could get started and cover ground more quickly than larger units, such as companies, regiments, and brigades.
This research was soon applied to business situations, and led to the development of the span-of-control concept. For many kinds of office work, including software, the average value is roughly eight employees per manager.
Although a ratio of eight employees per manager is widely accepted, it may not be optimal for software projects. There is a great deal of debate in the Agile and XP domains about small teams of three to five being able to outperform normal departments of eight to ten. However, the literature on small teams tends to overlook the fact that the software projects that the small teams are concerned with are often much smaller than the projects assigned to larger groups. In other words, the apparent benefits of small teams may be at least partly due to the volume of work, rather than to the team size itself.
The author’s own research has centered on really large systems in the 10,000– to 100,000–function point size range being constructed in large corporations, such as IBM, AT&T, Microsoft, and ITT. In the larger size ranges, what appears to be the optimal team size is a ratio of about a dozen technical workers reporting to a single project manager.
Although managers often state that large teams are hard to manage and keep track of, a careful analysis of how managers spend their time indicates that managers often spend more time with other managers than with their own employees.
The reason that larger teams appear to be more effective than smaller teams is not very flattering to software managers: Larger teams mean that less-capable managers can be removed from management and return to technical work, where their skills may be better utilized. Hence, larger teams give companies the ability to be more selective in choosing their managers, while also giving their managers better tools and support.
Larger teams and fewer managers also means less time spent in meetings with other managers, and less difficulty coordinating complex projects.
Other advantages of larger teams are that the amount of work that can be assigned to a given team goes up, and every student of management knows that cross-department coordination is much more difficult than coordination within a department. A department or team of a dozen technical workers and a manager can be assigned projects as large as 3000 function points or more than 300,000 source code statements. Conversely, a smaller team of five programmers and a manager can usually only handle about 1000 function points or 100,000 source code statements.
Managing Multiple Occupation Groups
As the software industry grows and expands, it is following the path of other industries and is developing a considerable number of specialists. One of the challenges of modern software project management is to select the optimum set of specialists for any given project. Another challenge is to develop organization structures that can place specialists so that their many diverse talents can best be utilized.
In 1995 AT&T commissioned SPR to perform a research study on the numbers and kinds of specialists utilized in large corporations and government groups. Some of the participants in this study included AT&T itself, IBM, Texas Instruments, and the U.S. Air Force. More recently several other organizations such as NASA, several Naval groups, and about a dozen large civilian companies were visited.
Table 22.3 shows the overall occupation group percentages noted among SPR’s clients in the original and more recent studies.
Although there is some ambiguity in the available data, the presence of specialist occupation groups appears to be beneficial for software development and maintenance work.
The corporations that use specialists for key activities, such as testing and maintenance, usually outperform similar organizations that use generalists by 15 to 20 percent in terms of both quality and productivity levels.
The presence or absence of specialists is severely skewed based upon the overall size of the total software population in the company or enterprise. Small companies with less than about 100 total software personnel usually make use of generalists who perform development programming, maintenance programming, testing, quality duties, and sometimes even technical writing. Except for technical writing, generalists also predominate in the Agile and XP programming domains. There are some specialists such as “scrummasters” in the Agile world, however. The object-oriented (OO) domain, on the other hand, does utilize specialists in about the same numbers as older development methods.
TABLE 22.3 Overall Distribution of Software Occupations in Large Corporations
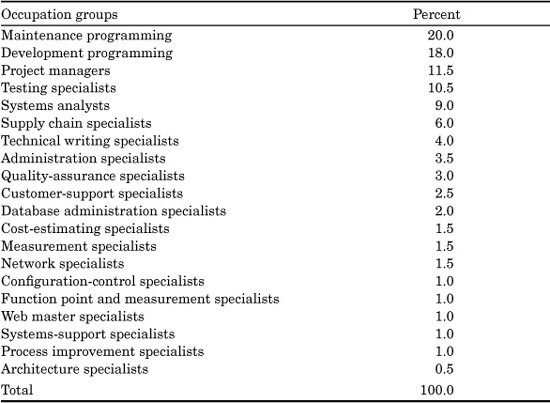
TABLE 22.4 Number of Specialist Occupations and Total Software Employment
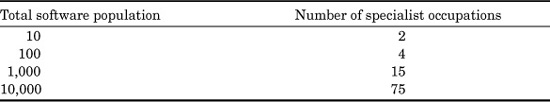
As the overall software population grows larger, more and more kinds of specialist occupations are noted, as in Table 22.4.
Although other factors may be involved, the use of specialists rather than generalists is strongly indicated as a possible explanation for an otherwise curious phenomenon. When software productivity rates are normalized based on the size of the software populations, the very large corporations with more than 10,000 software employees (i.e., Andersen, AT&T, EDS, IBM, Microsoft, etc.) have higher productivity rates than midsize organizations with 100 to 1000 total software personnel.
Very small corporations with fewer than 100 total software personnel have the highest productivity rates and don’t use specialists very much at all. However, small companies only build small applications where generalists and specialists are roughly equivalent in performance.
Within midsized corporations, some rather large software applications in excess of 10,000 function points may be attempted. If the development personnel are generalists and are attempting every aspect of large systems construction (i.e., design, coding, quality control, testing, etc.), these various roles tend to be conflicting and slow down progress.
In particular, if the same people are simultaneously attempting to do new development and maintenance of earlier versions, the maintenance work will interfere with development work and make both activities inefficient and hard to estimate.
The Presence or Absence of Project Offices for Large Systems
Large software applications in the 100,000–function point size class (equivalent to roughly 10 million source code statements) are often supported by a specialized group of planning, estimating, and tracking specialists organized into what has come to be known as a project office.
Software projects in the 100,000–function point class may have 500 or more technical personnel and 50 to 70 managers deployed, so obviously there is a need for some kind of a central coordinating unit for such mammoth undertakings.
The size of the project office itself for a huge application in the 100,000–function point domain is likely to be about ten personnel, including the project office manager.
For very large projects that have a project office, a number of the tasks that might normally be assigned to the project managers themselves are instead performed by the specialists in the project office: Sizing, function point analysis, cost estimating, measurement, and so forth are often delegated to the project office.
The project managers’ work is made easier by the presence of project offices, but they still have considerable responsibilities for coordinating their own teams, tracking progress against milestones, and reporting on any red flag items, which are serious technical or logistical problems that might affect the project’s outcome.
In recent years tools that automate some of the project office functions have begun to be commercially available. Preliminary data indicates that these tools are fairly effective when used on large projects within large companies.
Experience Levels of Software Project Managers
Experience is a factor in every human activity, and software is no exception. Novice project managers are seldom entrusted with major projects, for very good reasons. The work of software project management is eased considerably with experience on similar projects—especially on similar projects with a successful outcome, rather than similar projects that were failures or disasters.
A fairly sensitive issue needs to be discussed. The overall population of the software world seems to have a shortage of qualified project management candidates. In large companies, that means that at least some of the project managers will not be very good.
Studies of the exit interview of software engineers who were leaving large companies to take new jobs revealed two disturbing findings:
![]() The best technical workers with the highest appraisal scores leave in the greatest numbers.
The best technical workers with the highest appraisal scores leave in the greatest numbers.
![]() The most common reason for leaving was stated to be “bad project management.”
The most common reason for leaving was stated to be “bad project management.”
The implication is that bad project managers cannot attract and keep good technical workers. Therefore, bad project managers present a serious problem to large companies. So long as there are fewer qualified candidates for project management than there are job openings, the only short-term solution is to raise the span of control in order to weed out ineffective project managers. If you raise the span of control from eight employees per manager to ten employees per manager, then the weakest 20 percent of project managers can be reassigned.
Quality-Control Methods Selected by Project Managers
Although quality control is listed last in this discussion of project management roles, it is actually one of the most important factors of all. As discussed several times already, a ranked listing of the five major cost drivers for software projects has finding and fixing bugs as the most expensive single activity:
1. Finding and fixing bugs
2. Producing paper documents
3. Meetings and communication
4. Coding
5. Project management
In general, projects that run out of control and are terminated or end up in court usually have skimped on quality control, with the result that the projects could not be successfully delivered or deployed.
Consider the well-known disaster associated with the luggagehandling system at the Denver airport, which delayed the opening of the airport for approximately one year at a cost of roughly $1 million per day.
The two chief problems leading to this disaster were:
![]() Bad project management methods
Bad project management methods
![]() Inadequate quality-control methods
Inadequate quality-control methods
It is quite unfortunate that the impact of inadequate quality control is very deceptive and does not manifest itself until so late in the project that it is difficult to recover from the problem.
Usually, projects that are skimping on software quality methods, such as failing to use pretest design and code inspections, formal test methods, and the like, appear to be ahead of schedule and below cost estimates during the requirements, analysis, design, and even coding phases of development.
It is not until testing begins that the magnitude of the disaster starts to be realized. Then, when testing starts, it is painfully revealed that all of the quality shortcuts made earlier have produced an application that does not work and possibly cannot be made to work without major revisions and repairs.
All of the apparent early schedule and cost savings disappear in a huge frenzy of round-the-clock overtime as developers and managers frantically try to fix enough bugs so that the project stabilizes and can, perhaps, be released.
Project Managers and Metrics
Every project manager should understand the pros and cons of various metrics. Every project manager should understand what U.S. and industry averages are when expressed in terms of common metrics such as function points, use case points, object points, COSMIC function points, and the like. Every project manager should understand quality metrics such as defect-removal efficiency levels. It would also be helpful for every project manager to understand the basics of the six-sigma approach and of QFD.
However, actually counting function points or determining the sizes of applications with lines of code or use case points requires expertise that goes beyond normal management skills. In fact, actually counting function points accurately is a task that should only be done by certified counting specialists.
Managers need to understand how metrics work and what the data means, but it is not a project management job to count function points, lines of code, use case points, or other metrics. The counting tasks are better done by staff members and certified specialists.
Summary of Project Management Findings
The project management position is one of the most critical jobs in the software world. Good management correlates very strongly with successful projects. Bad management correlates strongly with failing projects. Good managers are good with people, understand estimating, are good planners, and recognize the value of excellent quality control and accurate measurements. Good managers also use a variety of automated tools to simplify their jobs.
Bad managers are often bad with people. They are marginal with estimating and planning, and they seldom understand the importance of quality control. Bad managers tend to fear measurements rather than embrace them, because accurate measurements are going to reveal their deficiencies. Bad managers also tend to use “seat of the pants” methods rather than automated methods for critical tasks such as schedule planning and cost estimating.
The worst aspect of bad managers is that they tend to drive away the strongest technical workers and the best software engineers. Good technical workers do not have to put up with bad managers because they can easily change jobs.
References
Boehm, Barry: Software Engineering Economics, Prentice-Hall, Englewood Cliffs, N.J., 1981.
Booch, Grady: Object Solutions: Managing the Object-Oriented Project, Addison-Wesley, Reading, Mass, 1995.
Brennan, E.M.: Software Project Management—A Practitioner’s Approach, McGraw-Hill, New York, 1995.
Brooks, Fred: The Mythical Man Month, Revised Edition, Addison-Wesley, Reading, Mass., 1995.
Brown, Norm (ed.): The Program Manager’s Guide to Software Acquisition Best Practices, Version 1.0, U.S. Department of Defense, Washington, D.C., July 1995.
Hughes, Bob, and Mike Cottrell: Software Project Management, Third Edition, McGrawHill, New York, 2002.
Cohn, Mike: Agile Estimating and Planning, Prentice-Hall PTR, Englewood Cliffs, N.J., 2005.
Curtis, Bill, William E. Hefley, and Sally Miller: People Capability Maturity Model, Software Engineering Institute, Carnegie Mellon University, Pittsburgh, Pa., 1995.
DeMarco, Tom, and Tom Lister: Peopleware—Productive Projects and Teams, Second Edition, Dorset House, New York, 1998.
Gack, Gary: “Applying Six-Sigma to Software Implementation Projects,” (http://software.isixsigma.com/library/content/c040915b.asp).
Garmus, David, and David Herron, David: Measuring the Software Process: A Practical Guide to Functional Measurement, Prentice-Hall, Englewood Cliffs, N.J., 1995.
———: Function Point Analysis, Addison-Wesley Longman, Boston, Mass., 2001.
Hallowell, David L.: “Six Sigma Software Metrics, Part 1.,” (http://software.isixsigma.com/library/content/03910a.asp).
Humphrey, Watts: Managing the Software Process, Addison-Wesley, Reading, Mass, 1989.
———: Managing Technical People, Addison-Wesley/Longman, Reading, Mass., 1997.
———: TSP—Leading a Development Team, Addison-Wesley, Boston, Mass, 2006.
International Organization for Standards: ISO 9000 / ISO 14000, (http://www.iso.org/iso/en/iso9000-14000/index.html).
Jones, Capers: New Directions in Software Management, Information Systems Management Group, 1993.
———: Assessment and Control of Software Risks, Prentice-Hall, Englewood Cliffs, N.J., 1994.
———: Applied Software Measurement, Second Edition, McGraw-Hill, New York, 1996.
———: Patterns of Software System Failure and Success, International Thomson Computer Press, Boston, Mass., 1995.
———: “Sizing Up Software,” Scientific American, New York, December 1998, Vol. 279, No. 6, pp 104–109.
———: Software Assessments, Benchmarks, and Best Practices, Addison-Wesley, Boston, Mass., 2000.
———: Conflict and Litigation Between Software Clients and Developers, Software Productivity Research, Burlington, Mass., 2003.
Kan, Stephen H.: Metrics and Models in Software Quality Engineering, Second Edition, Addison-Wesley Longman, Boston, Mass., 2003.
Kemerer, Chris F.: Software Project Management Readings and Cases, McGraw-Hill, New York, 1997.
Koirala, Shivprasad: “How to Prepare Quotations Using Use Case Points,” (http://www.codeproject.com/gen/design//usecasepoints.asp).
McConnell, Stevel: Software Estimating: Demystifying the Black Art, Microsoft Press, Redmond, Washington, 2006.
Pressman, Roger: Software Engineering—A Practitioner’s Approach, Sixth Edition, McGraw-Hill, New York, 2005.
Project Management Institute (PMI) (http://www.pmi.org).
Putnam, Lawrence H., and Ware Myers: Industrial Strength Software—Effective
Management Using Measurement, IEEE Computer Society Press, Washington, D.C., 1997.
Quality Function Deployment (http://en.wikipedia.org/wiki/Quality_function_ deployment).
Rapid Application Development (http://en.wikipedia.org/wiki/Rapid_application_ development).
Reifer, Don; Software Management; IEEE Press, Washington DC, 1997.
Rubin, Howard: Software Benchmark Studies for 1997, Howard Rubin Associates, Pound Ridge, New York, 1997.
Stapleton, J.: DSDM—Dynamic System Development in Practice, Addison-Wesley, Boston, Mass., 1997.
Stellman, Andrew, and Jennifer Green: Applied Software Project Management, O’Reilly Books, Cambridge, Mass., 2005.
Stephens M., and D. Rosenberg: Extreme Programming Refactored: The Case Against XP, APress L.P., Berkeley, Calif., 2003.Thayer, Richard H. (ed.): Software Engineering and Project Management, IEEE Press, Los Alamitos, Calif., 1988.
Umbaugh, Robert E. (ed.): Handbook of IS Management, Fourth Edition, Auerbach Publications, Boston, Mass., 1995.
Zells, Lois: Managing Software Projects, QED Information Sciences, Wellesley, Mass., 1990.
Zvegintzov, Nicholas: Software Management Technology Reference Guide, Dorset House Press, New York, 1994.