So far in this book you have worked with relatively small data sources such as the Northwind sample database that comes with Microsoft Access. In the business world, however, it is common to work with data sources that are much larger: from hundreds of thousands of records to millions, even billions of records. You cannot place such a huge data source on a worksheet, and even trying to manipulate all that data via a regular external data source is extremely time consuming and resource intensive. Fortunately, such huge data sources often reside on special servers that use a technology called online analytical processing, or OLAP. OLAP enables you to retrieve and summarize immense and complex data sources. When combined with Excel, OLAP enables you to view the data in a PivotTable or PivotChart report and manipulate the data quickly and easily.
In a traditional relational database management system, or RDBMS, such as Access, multiple tables are related using common fields. In the Northwind sample database, for example, the Customers table is related to the Orders table based on the common CustomerID field, and the Orders table is related to the Order Details table on the common OrderID field. You can use a query to pick and choose fields from each table and return them in a dataset. However, this can be a very slow process with a massive data source, so OLAP uses a different concept called the data warehouse. This is a data structure — called a star schema — with a central fact table that contains the numeric data you want to summarize and pointers to surrounding related tables.
A fact table is the primary table in a data warehouse and it contains data on events or processes — the facts — within a business, such as sales transactions or company expenses. Each record in the fact table contains two types of data: measures and dimensions.
A measure is column of numeric values within the fact table and it represents the data that you want to summarize. In a data warehouse of sales transactions, for example, there might be one measure for units sold and another for dollars sold. An OLAP measure is analogous to a data field in a regular data source.
A dimension is a category of data, so it is analogous to a row, column, or page field in an ordinary data source. However, dimensions often contain hierarchical groupings called levels. For example, a Store dimension may have a hierarchy of location levels, such as Country, State, and City. Similarly, a Time dimension may have Year, Quarter, and Month levels. Each level has its own set of items, called members. For example, the Month level has the items January, February, and so on. Because most fact tables contain keys to multiple dimension tables, OLAP data is often called multidimensional data.
An OLAP cube is a data structure that takes the information in a data warehouse and summarizes each measure by every dimension, level, and member. For example, a three-dimensional cube might summarize sales based on the dimensions of Time, Product, and Store. The cube could then tell you, say, the units sold of rye bread at store #6 in January, or the dollars worth of scissors sold in California in the second quarter. All the measures come pre-calculated in the cube, so Excel does not have to perform any calculations when you use an OLAP cube as a source for a PivotTable.
NonOLAP and OLAP PivotTables look and operate much the same. However, OLAP PivotTables have a number of limitations and differences of which to be aware:
You cannot change the summary function in the OLAP PivotTable data area. The summary function used by a measure is defined in advance and the calculations are performed on the OLAP server.
You cannot change the summary function for PivotTable subtotals.
You cannot create calculated fields or calculated items. However, there may be calculated members that are defined on the OLAP server.
You cannot enable the Background query or the Optimize memory option; see the Chapter 10 task, "Set External Data Options."
Excel does not save the external data with the PivotTable layout. Only the data used in the PivotTable report is returned from the OLAP server or cube file.
Excel can only work with OLAP data in a PivotTable or PivotChart report. You cannot save OLAP data to a worksheet.
You cannot set up a server-based page field with an OLAP PivotTable; see the Chapter 10 task, "Set Up a Server-Based Page Field."
In the PivotTable Field List, dimensions appear with the Cube dimension icon (

Dimensions can only be used in the PivotTable's row, column, and page areas.
Measures can only be used in the PivotTable's data area.
You cannot display the underlying detail for an OLAP summary value.
Items initially appear in the sort order defined by the OLAP server. However, you can sort the PivotTable results yourself; see the Chapter 4 task, "Sort PivotTable Data with AutoSort."
You cannot use the Show Pages command to display each PivotTable page on a separate worksheet.
If you rename a dimension or member, hide it, and then add it back into the PivotTable, Excel displays the dimension or member using its original name.
Before you can use an OLAP cube as the underlying data for a PivotTable, you must first create a data source that points to either a database on an OLAP server or to an offline cube file.
If you are on a network that runs an OLAP server — such as Microsoft SQL Server with Analysis Services, SAS OLAP Server, or Oracle OLAP Server — then you can get the most flexibility by connecting to the server and working with a database that has one or more OLAP cubes defined. This ensures that you are always working with the most recent data. Check with your database administrator to learn how to find the OLAP server and whether you need a separate login username and password to access the server.
Note
Portions of this chapter use the SalesCube.cub offline cube file, available at www.wiley.com/go/pivottablesvb, or you can create your own sample database.
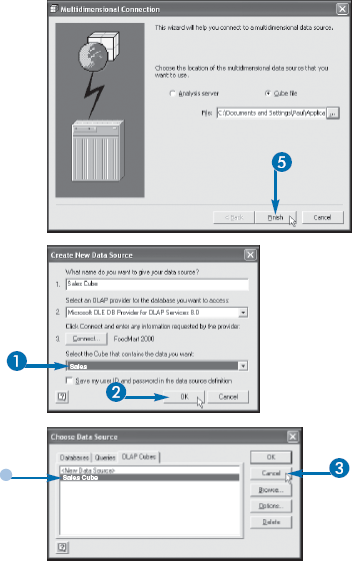
The Choose Data Source dialog box appears.
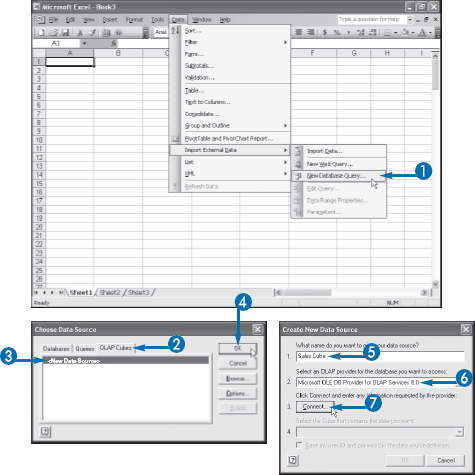
The Create New Data Source dialog box appears.
The Multidimensional Connection dialog box appears.
Note
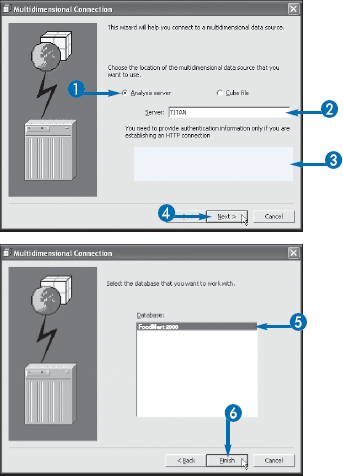
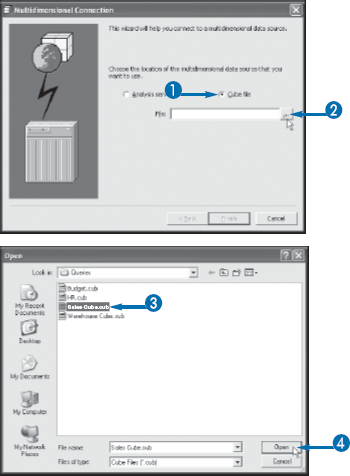
If you want to use an OLAP server, follow the steps in the section "Connect to an OLAP Server." If you want to use a cube file, follow the steps in the section "Connect to a Cube File."
A list of databases on the OLAP server appears.
The Create New Data Source dialog box appears.
Note
To finish the data source, follow the steps in the section "Complete the Data Source."
Apply It
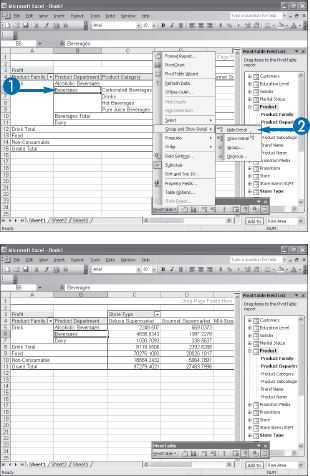
You can also create OLAP cubes from relational data by creating a query for, say, an Access object, and then saving it as an OLAP cube. First set up a data source that points to the Access database; see the Appendix B task, "Define a Data Source." Then select the data source using the Query Wizard; see the Appendix B task, "Select a Data Source." In the final Query Wizard dialog box, select "Create an OLAP Cube from the query" (
The OLAP Cube Wizard has three steps. In the first step, you can select the measures you want to include in the cube. In the second step, you can specify the dimensions and levels you want to include in the cube — drag a dimension field and then drag its levels onto it. In the third step, you can either create a cube file or you can create an online cube.
Instead of connecting to an OLAP server, you may have access to a cube file, which is a version of an OLAP cube that has been saved to a local or network folder. A cube file is "offline" in the sense that the data is not connected to an OLAP server, so it is a static snapshot of the data. This is useful if you are working out of the office and do not have access to the OLAP server. However, you may also want to work with a cube file while you are connected to the network. If you know the data is not going to change soon, working with a cube file tends to be faster than working online with a server because network traffic may slow down the server connection.
Your database administrator may be able to create a cube file for you. Alternatively, you can use the OLAP Cube Wizard to create a cube file, as described in the tip on the previous page. See also the task "Create an Offline OLAP Cube," later in this chapter.
The Open dialog box appears.
The Create New Data Source dialog box appears.
Note
To finish the data source, follow the steps in the section "Complete the Data Source."
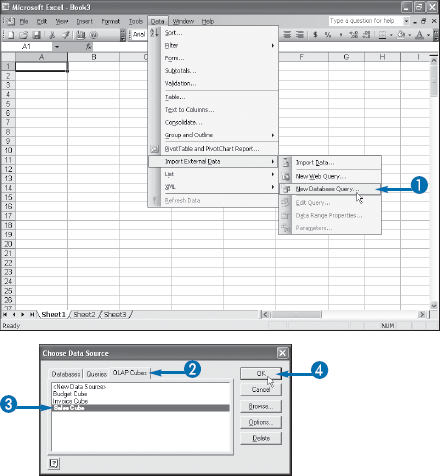
After you define a data source for the OLAP cube you want to work with, you can then use that data source as the basis of a PivotTable.
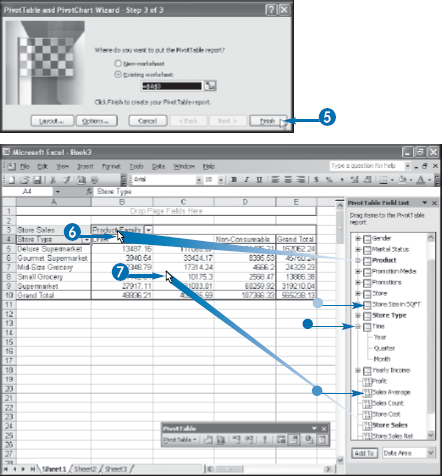
By definition, an OLAP cube is already a summary of the underlying data in the OLAP database. When creating an OLAP cube, the database administrator specifies one or more measures, and then the OLAP server applies those measures to every dimension, level, and member. So every possible combination of measure and dimension is already part of the cube. This is what makes cubes so powerful. Because all the summarizing work has already been done and the results are part of the cube, Excel requires very little processing power to pivot, filter, and summarize the data.
Because the OLAP cube is already a summary of data, it can only appear in Excel as part of a PivotTable or a PivotChart. So if you want to work with an OLAP cube within Excel, you must do it as part of a PivotTable.
You can enhance your data analysis by displaying the details for one or more of the dimensions and levels in an OLAP PivotTable.
When you add a dimension to an OLAP PivotTable, Excel shows the members that comprise the top level of the dimension's hierarchy. For example, if you add the Product dimension in the Foodmart Sales cube, Excel displays the members of the Product Family level: Drink, Food, and Non-Consumable. However, the dimension hierarchy may have more levels. For example, in the Foodmart Sales cube, the Product Family's Drink member has another level that includes the items Alcoholic Beverages, Beverages, and Dairy. Similarly, the Beverages member has another level that includes Carbonated Beverages, Drinks, and Hot Beverages.
Some dimensions have only a single level, but others can have four or five. For these multilevel dimension hierarchies, you can drill down into the dimension's details to see more specific slices of the cube data.
In this task, you learn how to move up and down through a dimension's hierarchy one level at a time. An OLAP PivotTable also enables you to display only selected levels and members, and you learn how to do that in the task "Display Selected Levels and Members," later in this chapter.
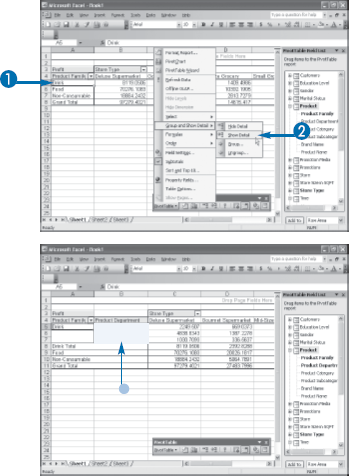
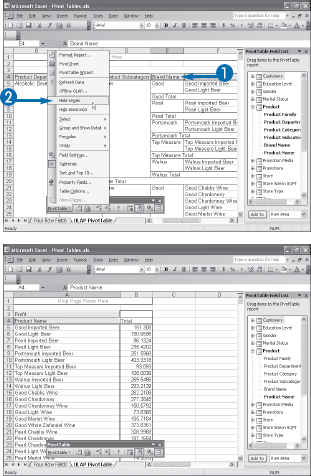
After you show the details for one or more levels in a hierarchical cube field, you can reconfigure the PivotTable to hide all the levels above a specified level in the hierarchy.
Displaying details is useful because it enables you to see more specific slices of the OLAP cube data. However, the extra levels can sometimes make the PivotTable more difficult to read. You can work around that problem by hiding the levels you do not want to see. For example, in the Foodmart Sales cube, the Product dimension has six levels: Product Family, Product Department, Product Category, Product Subcategory, Brand Name, and Product Name. If you want to view some measure with respect to the Product Name level, you must display details for all the upper levels. The resulting PivotTable is difficult to read and cumbersome to navigate, but you can make it easier by hiding the upper levels — the ones from Product Family to Brand Name.
You can control the number of levels a cube field displays by setting the HiddenLevels property. For example, if you set this property to 5, Excel hides the five top levels in the cube field hierarchy:
ActiveCell.PivotField.CubeField.
HiddenLevels = 5
To show all levels, set HiddenLevels to 0:
ActiveCell.PivotField.CubeField.
HiddenLevels = 0
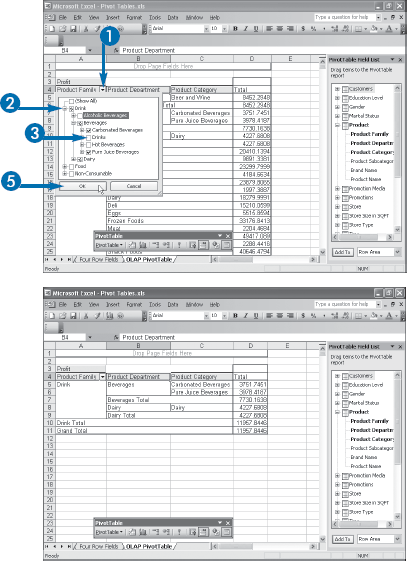
You can control exactly which levels and members Excel displays for a dimension that you have added to a PivotTable.
By default, Excel displays all the members of the top level when you add a dimension to the PivotTable. If you click the level button and then run the Show Details command, Excel displays all the members of the next level. If, on the other hand, you only want to display the members associated with a particular item in a level, then you can click the item and run the Show Details command.
However, your data analysis might require even more control over the display of levels and members. Excel enables you to hide members of any level, and this task shows you how to do that.
Extra
When you are working in the dimension drop-down list, you see the following check box states:
BUTTON | DESCRIPTION |
|---|---|
The level or member is displayed; for a level, none of its lower levels or members are displayed. | |
The level or member is not displayed; for a level, none of its lower levels or members are displayed. | |
The level or member is displayed; for a level, some or all of its lower levels or members are displayed. |
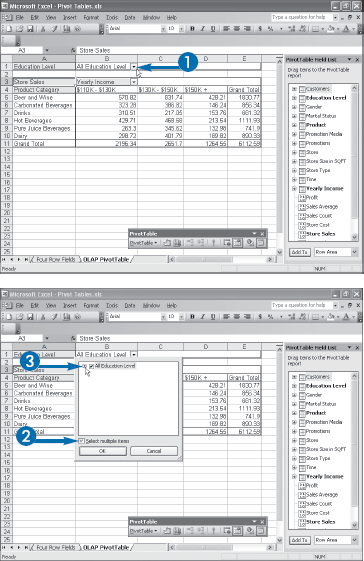
With an OLAP PivotTable, you can filter the report using two or more items in the page field.
A major component of good PivotTable-based data analysis is the ability to filter the report so that you see only the data you want to work with. In a regular PivotTable, you can filter the report by selecting an item from the page field. However, filtering on a single item is often not exactly what you want. For example, suppose your report shows the store sales of beverages to consumers in various income groups and you want to filter that report based on the education level of the consumers. Filtering the report to show just those consumers with a bachelor's degree or a graduate degree is useful, but your analysis may require that you examine both types of consumers together. In a regular PivotTable, it is possible to filter on multiple page field items, but it requires hiding all the items you do not want to include in the report. In an OLAP PivotTable, you can do this more directly by selecting just the items you want to include in the report filter.
Excel displays a hierarchical list of the levels and members in the dimension.
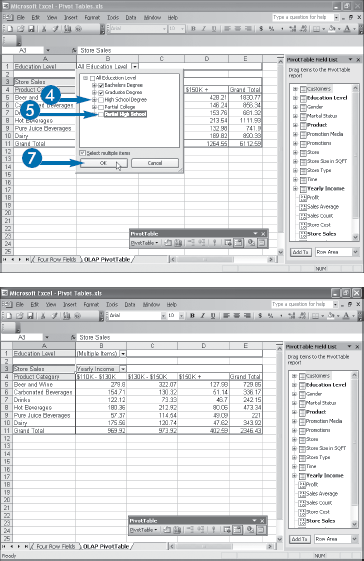
Excel displays the results for just the page field items that you selected.
Apply It
A quick way to reset the report to display the data for all the page field items is to use the drop-down page field list and check "Select multiple items" (
You can also do this via VBA by setting the CubeField object's EnableMultiplePageItems property to True. The following macro toggles this property on and off:
Example:
Sub ToggleMultiplePageFieldItems()
    Dim objPF As PivotField
    ' Work with the first page field in the active PivotTable
    Set objPF = ActiveCell.PivotTable.PageFields(1)
    ' Work with the CubeField object
    With objPF.CubeField
        ' Toggle the EnableMultiplePageItems property
        .EnableMultiplePageItems = Not .EnableMultiplePageItems
    End With
End SubYou can work with an OLAP PivotTable while your computer is not connected to the network by creating and using an offline version of the cube that includes some or all of the data stored on the OLAP server.
We live in a world of mobile computing where the "desktop" is any reasonably flat surface upon which you can balance your notebook or handheld computer. Unfortunately, although your computer may be quite portable, your data is not always so prepared to travel. This is particularly true when that data resides on a network server. After you disconnect from the network, you lose access to the server and, hence, to your data.
Many solutions exist that enable a roaming computer to make a remote connection to the network. But technologies such as Virtual Private Networking and dial-up connections are often expensive, difficult to set up, and too slow for heavy-duty data work.
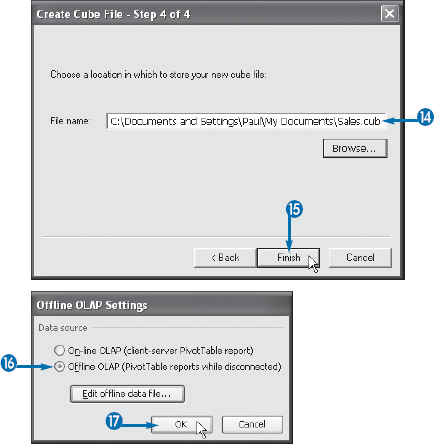
A better solution is to take some or all the data on the road with you. By storing a version of the data on your traveling computer, you can work with the data at any time and without needing a remote connection. For most OLAP data, Excel offers the Create Cube File Wizard, which takes you step by step through the process of creating an offline cube file. Note, however, that this wizard does not work with all data warehouse software. You can then take that cube file with you when you travel and work with the cube's associated OLAP PivotTable, just as though it resided on an OLAP server.
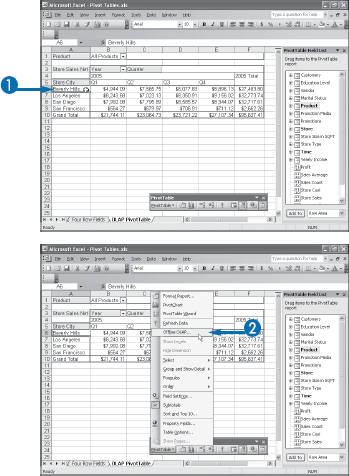
The Offline OLAP Settings dialog box appears.
The Create Cube File Wizard appears.
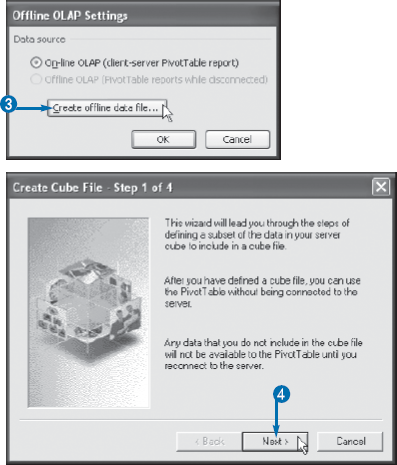
The second Create Cube File Wizard dialog box appears.
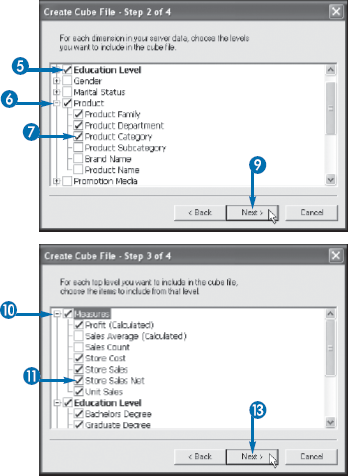
You can use the Create Cube File Wizard to specify exactly the data that you require while you work with the OLAP PivotTable offline.
Depending on how much data is stored in the online OLAP cube, the offline version could be massive. In fact, most OLAP cubes contain enough multidimensional data to create offline cube files that are dozens or even hundreds of megabytes in size. If you are not transferring the cube file to a different computer, such as your notebook PC, if you are not e-mailing the cube file, and if your computer contains lots of free hard disk space, then the size of the OLAP cube is probably not a concern.
However, it is common to require a cube file transfer — either to a portable machine or via e-mail. Alternatively, you may be running low on hard disk space and cannot store a huge file. For these situations, you need to restrict the size of the offline cube file. You can do this in the Create Cube File Wizard by specifying the data that you are certain you need while disconnected from the network. The wizard gives you two ways to do this. First, you can select for inclusion in the cube file just those dimensions that you want to work with. Second, you can select just those top level items that you want to work with. These top level items include all the measures in the OLAP cube and all the items in the dimensions that you selected for inclusion in the cube file.
The third Create Cube File Wizard dialog box appears.
The fourth Create Cube File Wizard dialog box appears.
Alternatively, click Browse and use the Save As dialog box to specify a folder and filename for the cube file.
Excel creates the cube file and returns you to the Offline OLAP Settings dialog box.
You can now use the OLAP PivotTable while disconnected from the network.
Extra
When you are offline and using the cube file for your PivotTable, you are free to create other PivotTables using the same cube file. First, you need to create a data source that connects to the cube file. In the task "Create an OLAP Cube Data Source," see the section "Connect to a Cube File." When that is done, you can then create the new PivotTable using the cube file data source; see the task "Create a PivotTable from an OLAP Cube."
When you reconnect to the network, you should switch to using the online OLAP data so that you can refresh the PivotTable report to get the latest data. To switch from the offline OLAP cube, click any cell in the PivotTable report and then click PivotTable→Offline OLAP. In the Offline OLAP Settings dialog box, select On-line OLAP (