chapter 12
FINANCIAL STATEMENT ANALYSIS
OVERVIEW OF FINANCIAL STATEMENT ANALYSIS
Reading the Financial Statements
Retrospective versus Prospective Analysis
Time-Series versus Cross-Sectional Analysis
LEARNING OBJECTIVES
After studying this chapter, you should be able to:
- Explain why knowledge of the business is important when drawing conclusions about a company's future financial health.
- Describe the various ways of analyzing a company's financial statements.
- Identify the types of ratios that are best at providing insights for specific decisions.
- Calculate specific ratios that are used to assess a company's profitability, short-term liquidity, activity, and solvency, and explain how the ratios can be interpreted.
- Calculate and explain the uses of the earnings per share ratio and the price/earnings ratio.
- Understand the differences that might affect the ratio analysis of non-manufacturing or non-retail companies.
- Understand the need to exercise caution when interpreting ratios.
- Use ratios to assess a company's financial health through an analysis of its performance and financial position.
A Real-Life Exercise in Financial Management
Proper analysis of financial statements requires a good understanding of the statements' various components. No one knows this better than a group of finance students at Simon Fraser University in Vancouver, B.C., who are putting their knowledge into action with the Student Investment Advisory Service (SIAS).
The SIAS was established in 2003 when a group of about 15 students in the university's Master's in Financial Risk Management program were given the opportunity to manage a fund, which then was worth approximately $6.5 million, representing about 5 percent of the total SFU endowment funds, says adjunct professor Derek Yee. In the following years, two other student groups joined the SIAS: master's students from the Financial Risk Management Program are calculating risk measures and offering advice on ways to reduce risks, and some undergraduates studying finance are acting as junior analysts.
The SIAS gives students the opportunity to apply what they have learned in the classroom. “As part of the normal portfolio management process, an Investment Policy Statement describes the parameters that the students must operate within,” explains Professor Yee. The students invest in three asset classes–cash, fixed income (Canadian), and equity (Canadian and global).
“We use a top-down approach,” says Enrico Chua, a student in the Master's in Financial Risk Management program, whose role was Canadian equity sector head for health care. “We first look at global macroeconomic factors like GDP, inflation, and interest rates. Then we look for industries that have wide economic moat and other competitive factors before drilling down to the individual companies.” The students then identify undervalued companies in good industries by looking into their financial statements. “We obtain at least five years of historical financial data from the company's balance sheet and statement of cash flow. Based on the accounting information and our understanding of the future business plans of the company, we forecast cash flows. We then use the discounted cash-flow method to come up with the fair value price of the stock.” The students also compare this target company with its peers to assess its competitive advantages. They write a report outlining the major financial information, valuation, and performance ratios, which they present to the SIAS group and Professor Yee for discussion, and then vote on whether to take action.

To review past performance, the students meet quarterly with their client, SFU's vice president of finance, who is responsible for the endowment funds' management. A business council composed of investment professionals from major financial institutions also critiques the students' performance. “Tough questions and constructive comments from the business council help shape and improve how we manage the fund,” says Mr. Chua. Following this quarterly review, the students meet with Professor Yee to discuss how they can improve SIAS.
And results have been good. The original $6.5 million had increased to about $9.2 million by the end of 2009. Some months, the SIAS outperforms the market, while other months are less successful. As Professor Yee points out, performance is only one measure; another is risk. “The students have a mandate to preserve wealth and they give that a higher priority than attempting to maximize return.”
The SIAS group at Simon Fraser University provides investment advice for some of the university's endowed funds. Not many students get the opportunity to work with real investments. The Master's in Financial Risk Management was a new program when the SIAS group was formed, but with the assistance of students from other SFU programs, the SIAS team is able to do a thorough analysis of potential investment options. One of the avenues of analysis that the SIAS group uses at the start of each investigation is financial statement analysis. The information that is gathered from the evaluation of the financial statements and their notes then forms the basis for their decision to go forward with further investigation. However, financial statement analysis is not the only basis on which they make their recommendations. They go on to look at discounted cash flow, perform a risk analysis, and complete their thorough analysis of the industry in which the company operates. Although financial statement analysis does not answer all questions, it does provide signals about financial health, cash flow, and operating efficiency.
Having worked your way through the previous chapters of this book, you now know the main issues in accounting, you can read and understand most of the items on financial statements, you are aware of the various methods that can be used to measure and report transactions, and you understand some of the limitations that affect the numbers on the statements. As we move through the various methods and ratios of financial analysis in this chapter, we are going to refer to some of the ratios that you have already seen in this text. In the first 11 chapters of this book, we described the basic components of the financial reporting system and how accounting numbers are accumulated and recorded. In most of these chapters, we also identified ratios that use the material that was being discussed. In this chapter, we pull all of these ratios together and summarize how financial information can be analyzed.
USER RELEVANCE
As a user, you need to analyze financial information effectively so that you can make knowledgeable decisions. This involves more than a basic understanding of what each individual statement means. You need to understand the relationships among the three major financial statements and the methods that produce the numbers. You also need to compare and contrast these relationships over time and among different companies. Our current discussion was left until this chapter because proper analysis requires a good understanding of all financial statement components.
As we worked through the material in the book, we introduced the ratios that pertained to the topics under discussion. While this has given you some tools, they are not organized cohesively, and you now need to think about analysis as a structured activity. You need to know what information will help you make informed decisions and then identify the tools that will give you that information. With this in mind, the ratios in this chapter have been organized according to decision-making needs.
This chapter provides an overview of financial statement analysis and a discussion of the basic ratios used. However, because financial statement analysis is very complex, it can serve only as an introduction. Remember two things as you work through this chapter. First, there is no definitive set of rules or procedures that dictate how to analyze financial statements. Second, every analysis should be tailored to suit the underlying reason for making the analysis. These two features make comprehensive analysis quite complex. A more detailed discussion of financial statement analysis is left to more advanced texts.
OVERVIEW OF FINANCIAL STATEMENT ANALYSIS
Financial statements are typically analyzed for a specific purpose. An investment analyst or a stockbroker, for example, may undertake an analysis in order to recommend that a client buy or sell shares. A bank's commercial loans officer may perform an analysis of a client's financial statements to decide whether the client will be capable of paying back a loan the bank is considering. A student looking for a job may analyze a company to decide whether it is a suitable company to work for.
Each analyst will tailor the analysis to the demands of the decision to be made. For example, a banker trying to decide whether to make a short-term loan may restrict the analysis to the company's short-term cash-producing capabilities. The investment analyst, on the other hand, may focus on its long-term financial health.
In this chapter, we take a very general approach to financial statement analysis. While no particular decision is considered as the various ratios are discussed, we do discuss decision contexts where one particular ratio may be more helpful than others. Before turning to specific ratios, however, and whatever the decision to be made, one of the first things you have to do is understand the business.
Understanding the Business
Understanding the business means more than understanding a company's financial statements. It means having a grasp of the operating activities of the business, the underlying economics, the risks involved, and the external economic factors that are crucial to the company's long- and short-term health. It means that you must understand the various types of businesses that the company is engaged in. For example, a large company such as Rogers Communications Inc. is involved in more than just providing cell phone and cable access to consumers. In its wireless division, it provides wireless voice and data communications services. The cable division provides cable television services and high speed Internet. The media group not only operates radio and television stations, including Citytv in Toronto and The Shopping Channel, but also publishes consumer magazines and professional publications, and owns the Toronto Blue Jays Baseball Club. An analyst who thinks that Rogers is only in the telephone and cable business has a very inaccurate view of the risks involved in lending Rogers money or in buying its shares.
Companies follow different strategies to achieve success. Although a detailed discussion of corporate strategy is beyond the scope of this book, you should be familiar with a few basic strategies that companies follow. The two most common strategies are being a low-cost producer and following a product differentiation. A low-cost producer focuses on providing goods or services at the lowest possible cost and selling at low prices. To be successful, these companies need to sell a high volume of goods at the lower prices. This strategy works best when competing products are similar and price is the most important decision factor for customers. Discount grocery chains or discount retailers usually follow this strategy. The other strategy is to sell products that are specialized or to provide superior service that customers are willing to pay a premium for. If the company can make a higher profit margin on the goods or services provided, it does not need to sell as many goods to make the same level of total profit as a company that sells more for less—they can succeed with a lower volume. Gourmet grocery or specialty stores and high-end retailers usually follow this strategy. Understanding the company's strategy will help you interpret the financial results and explain differences if, for example, you are trying to compare a discounter to a specialty store and are wondering why the results are so different.
LEARNING OBJECTIVE 1
Explain why knowledge of the business is important when drawing conclusions about a company's future financial health.
A basic understanding of the company's range of business activities, including their recent achievements and management's future expectations for them, can usually be had by reading the first sections of the company's annual report. The first half of the annual report in North America is divided into two parts. The first part contains the description of the company, some general highlights of the year, and letters to the shareholders from the CEO and the chief financial officer. Following that is the Management Discussion and Analysis (MD&A). This is a very important section for an analyst to read, because in it management must discuss many aspects of the company's financial performance in greater detail. It should include a discussion not only of past results, but also of management's expectations for the future and the risks the company is facing. The intention of the MD&A is to allow the user to see the company through the eyes of management. Although this descriptive section of most annual reports does not explain everything you need to know about the company, it does provide some insight into what the company does and the types of risks it faces. You should also listen to the financial news and read financial newspapers and magazines to find additional information about the company and the industry in which it operates. Once you have an overall view of the types of businesses operated by the company, you should next read the financial statements, including the auditor's report and the notes to the financial statements. The financial statements are usually found in the second half of an annual report.
For purposes of illustration in this chapter, we are going to use the financial statements of SOCIÉTÉ BIC (BIC). Headquartered in a suburb of Paris, France, BIC is familiar to most students as a world leader in the stationery (pens and other office supplies), lighter, and shaver markets. In 2010, as a result of acquisitions in 2009, BIC added advertising and promotional products (custom printed calendars, bags, pens, and so on) as a fourth product area. BIC's strategy, as indentified in its annual report, is to focus on generating sales growth with new products and extension of its product line, both focused on innovation. The company's goal is to produce consistent quality products at a lower cost, either in-house or, to a lesser extent, by outsourcing, to increase flexibility or to take advantage of new technologies. BIC sells its products to office product stores and other retailers, and to distributors and wholesalers. The company prepares its financial statements in French in accordance with regulations governing the stock market in Paris, and refers to the English translation used in this chapter (and available on the companion website) as a reference document. In the remainder of the chapter, we will refer to the document as an annual report, as it is similar in format and content to the other annual reports we have used throughout the book.
Reading the Financial Statements
The first thing to read in the financial statements is the auditor's report, as it states whether appropriate accounting policies were followed and whether the statements present the company's operating results and financial position fairly. This report is important because the auditor is an independent third party who is stating a professional opinion on the fairness of the numbers and disclosures reported in the financial statements. The role of the auditor and the audit report were introduced in Chapter 1.
Remember that the auditor's report does not guarantee the accuracy of the information contained in the financial statements. Financial statements are prepared by management, and management has primary responsibility for them. Auditors express their opinion on whether the financial statements present the information fairly according to generally accepted accounting principles. The auditor's report does not indicate whether the information contained in the financial statements is good or bad. It is the reader's responsibility to interpret the information provided.
An example of a typical unqualified auditor's opinion, provided by Grant Thornton and Deloitte & Associates Chartered Accountants for the 2009 financial statements of BIC, is shown in Exhibit 12-1. As you may recall from Chapter 1, an unqualified (or “clean”) audit opinion is one in which the auditors do not express any concerns, reservations, or qualifications regarding the financial statements. Without any exceptions, they state that, in their professional opinion, the financial statements give a true and fair view of the company's financial position and the results of its operations in accordance with generally accepted accounting principles. This is what the users of the financial statements want to see; any other type of audit opinion warrants very careful consideration.
One of the differences in the presentation of the financial statements under French GAAP is that the auditor's report is found after the financial statements and notes, as opposed to the traditional North American presentation, where it is presented before the financial statements. Similar to Canadian audit reports, BIC's audit report contains three components: the auditors express their opinion on the financial statements, state their justifications, and outline the specific procedures they used.
After reading the auditor's report, the second step is to read each of the major financial statements to ensure that the results make sense for the types of activities that the company is engaged in. Use your knowledge from this course to look for unusual account titles and unusually large dollar items. For example, if there is a large loss item on the statement of earnings, the nature of the loss is important. Is it an item that could be expected to continue into the future, or is it a non-continuing item?
Unusual account titles may indicate that the company is involved in a line of business that is new, which could have serious implications for future operations. For example, if a manufacturer suddenly shows lease receivables on its statement of financial position, this probably indicates that it has started to lease assets, as well as sell them. The leasing business is very different from the manufacturing business and exposes the company to different types of risk. You must take this new information into consideration when evaluating the company.
A reading of the financial statements is not complete unless the notes to the financial statements are read carefully. Because the major financial statements provide summary information only, there is not much room on them to provide all the details that are necessary for a full understanding of the company's transactions. The notes provide a place for more detail and discussion about many items on the financial statements. Also pay attention in the notes to the summary of the company's significant accounting policies. Remember that IFRS allows considerable flexibility in choosing accounting methods, and different choices result in different amounts on the financial statements, so you should be aware of the choices that management made. These will generally be listed in the first note to the financial statements.
Once you have an overall understanding of the business and the financial statements, you can begin a detailed analysis of the financial results.
 EXHIBIT 12-1 SOCIÉTÉ BIC 2009 ANNUAL REPORT

LEARNING OBJECTIVE 2
Describe the various ways of analyzing a company's financial statements.
Retrospective versus Prospective Analysis
As discussed earlier, most analysis is done with a particular objective in mind, and as most objectives involve making decisions that have future consequences, it follows, therefore, that almost every analysis of a set of financial statements is, in one way or another, concerned with the future. Because of this, you should make a prospective (forward-looking) analysis of the company to try to determine what the future will bring. For example, commercial loans officers in banks try to forecast companies' future cash flows to ensure that loans will be repaid.
The problem with prospective analysis is that the world is an uncertain place; no one can predict the future with complete accuracy. Analysts, however, are expected to make recommendations based on their predictions of what the future outcomes will be for specified companies. In trying to predict the future, some of the most reliable sources of data you have are the results of a company's past operations, as summarized in the financial statements. To the extent that the future follows past trends, you can do a retrospective analysis to assist in predicting the future. You must also understand the economics of a company well enough to know when something fundamental has changed in the economic environment to make it unlikely that the company's past results will predict the future. In such a situation, you cannot rely on the retrospective data.
If you believe that retrospective data may be useful in predicting the future, a complete analysis of those data is in order. Two major types of analysis of retrospective data are time-series and cross-sectional analyses.
Time-Series versus Cross-Sectional Analysis
In a time-series analysis, the analyst examines information from different time periods for the same company, to look for any patterns in the data over time. For example, you may look at the sales data over a five-year period to determine whether sales are increasing, decreasing, or remaining stable. This would have important implications for the company's future sales. The assumption underlying a time-series analysis is that there is some predictability in the time series; that is, past data can be used to predict the future. Without this assumption, there is no reason to do a time-series analysis.
Many companies recognize the importance of time-series information and provide five- or 10-year summaries to assist in making this analysis. In the first part of its annual report, BIC prepares a review covering a three-year period. Because this is not adequate for the purpose of a trend analysis, Exhibit 12-2 extracts some of the key accounts from BIC's analysis and has extended the summary to five years using data from earlier annual reports. In BIC's information, it is interesting to note that both net sales and group net income increased from 2005 to 2007, and then fell in 2008. Sales growth rebounded to a new, higher level of sales in 2009, and although net income increased over 2008, it was still below the amounts earned from 2005 to 2007. The income from operations (income after all operating expenses but before tax and interest expense) exhibited the same pattern as the net income.
A review of the balance sheet items presented shows that assets grew substantially between 2008 and 2009, as a result of the acquisitions BIC made to establish itself in the promotional products market and an acquisition of a stationery company in India, undertaken to increase the company's presence in that geographic market. It appears that the acquisitions were financed by increases in both non-current borrowings and equity. A review of the cash flow statement information indicates that BIC spent a large sum on investing activities in 2009, but the cash generated from operations increased and it had a very large cash and cash equivalents balance (€478.9 million) at the end of the year. Some companies include non-financial data, such as the number of employees or number of retail outlets, in their financial summaries. BIC included the number of shares outstanding.

HELPFUL HINT
A word of caution: Some companies, like BIC, present their financial information with the earliest year closest to the account titles. Most companies present their information the other way, with the most recent year closest to the account titles. When you are reading financial statements, be careful to observe the format used or you may end up thinking sales are falling when they are growing!
After this brief review, an analyst would now have identified that although the company's stated strategy may be growth and producing quality products at low costs, the company has not achieved that consistently over the period. The analyst will be interested in further analyzing the performance of the company to try to determine the reasons for the lower level of net income and to assess whether BIC will be able to repay the additional debt it has taken on.
A cross-sectional analysis compares the data from one company with the data from another company for the same time period. Usually, the comparison is with another company in the same industry (a competitor perhaps), or with an average of the other companies in the industry. For example, you might look at the growth in sales for General Motors of Canada compared with the growth in sales for Ford of Canada. Other cross-sectional analyses might compare companies across different industries (General Motors of Canada compared with Rogers), different countries (General Motors of Canada compared with Nissan of Japan), and so forth. However, any cross-sectional comparisons must consider that different industries may have different accounting principles (for example, accounting principles for banks and insurance companies are slightly different from those for most other industries). Comparing across countries is more difficult if different accounting standards are used in different countries. However, investment analysts want to recommend the best investment strategy to their clients using as wide a range of investments as possible. To make the best recommendation, they must consider the return versus risk trade-off across many companies. They must, therefore, directly compare companies in different industries and different countries. One of the advantages of the growing use of IFRS in Canada and around the world is that there will be fewer accounting differences and, therefore, easier comparisons.
The choice of which type of analysis to conduct is driven, in part, by the type of decision that motivated the analysis. In a lending situation, for example, the commercial loans officer will use a time-series analysis of the company in conjunction with a cross-company comparison. The time-series analysis is important because it will help the lender determine the company's ability to repay any money loaned. As part of the decision-making process, the lender must also be aware of industry trends in order to get an overall assessment of how well a particular company performs relative to its competitors. This information will help ascertain the company's future viability.
Data to Be Used
The type of data that is used in a time-series or cross-sectional analysis will vary depending on the purpose of the analysis. Three general types of frequently used data are raw financial data, common size data, and ratio data.
Raw Financial Data
Raw financial data are the data that appear directly in the financial statements. An example of a time-series analysis of this type of data would be time-series data available in the annual report from the income statements, cash flow statements, and balance sheets, similar to that shown for BIC in Exhibit 12-2. Cross-sectional analysis can also be used with this type of data. For example, you might compare total revenues across companies in the same industry for the past three years. Annual reports may also contain data other than strictly financial data, such as numbers of employees or sales volumes expressed in physical units rather than dollars.
In the remainder of the chapter, data from BIC's financial statements will be used to illustrate various types of analyses. These raw financial statement data appear in Exhibit 12-3, which includes the balance sheets, income statements, and cash flow statements.
Common Size Data
Although a company's raw data can reveal much about its performance, certain relationships are more easily understood when some elements of the raw data are compared with other elements. For example, in the income statement for BIC in Exhibit 12-3B, you can see that sales increased from €1,456,088 thousand in 2007 to €1,562,696 thousand in 2009. Cost of goods has also increased over this period from €741,063 thousand to €842,952 thousand. What happened to gross profit margins, on a relative basis? This is a question of the relationship between the costs and the revenues. One way to address this question is to compare the cost of goods sold expressed as a proportion of the sales revenue. Often, this is done by preparing a set of financial statements called common size statements.
EXHIBIT 12-3A SOCIÉTÉ BIC 2009 ANNUAL REPORT


EXHIBIT 12-3B SOCIÉTÉ BIC 2009 ANNUAL REPORT

EXHIBIT 12-3C SOCIÉTÉ BIC 2009 ANNUAL REPORT


In a common size statement of earnings, all line items are expressed as percentages of sales. Exhibit 12-4 presents a common size income statement for BIC, with every item calculated as a percentage of net sales.
We observed from the key figures in Exhibit 12-2 that sales have been increasing for BIC, except in 2008, but net income had fallen in 2007 and did not fully recover when sales did in 2009. This common size statement of earnings gives us a better understanding of those changes. It shows that BIC's cost of goods as a proportion of sales has been increasing over the three-year period, and that proportionate net income has been decreasing. Cost of goods has gone from 50.9% of sales to 53.9%, a full 3% increase. It is costing BIC more to produce the goods it sells. This has caused the gross profit to fall from 49.1% to 46.1% and signals to the user that BIC has been ineffective in controlling its major costs. It is not clear if the increase reflects a shift to selling more products that are more expensive to produce, if increases in sales prices have not kept pace with increases in cost, if price cuts were required due to competitive or economic conditions, or if cost control has just been ineffective. An analyst would want to try to find out more information, either from management or from performing additional analysis, about the cause of the change. An analyst will examine a company's financial statements carefully when sales are rising or falling. If sales are rising and the cost of those sales rises proportionately more than the sales themselves, the new sales are costing the company more and management should be looking for ways to control the costs.
Common Size Statements of Income

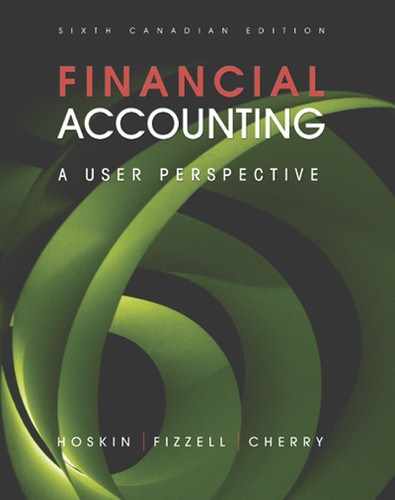
As a percentage of sales, when all other costs remain the same, an increase in the cost of sales results in an identical decrease in net income. Imagine if you sell an item for $1.00 and it now costs you $0.03 more to make or acquire the item than it did last year. This means there will be $0.03 less to spend on other items or left over as net income. For BIC, net income as a percentage of sales actually decreased by 2.2% over the period, from 11.9% of sales to 9.7%. As BIC experienced a 3% increase in its cost of goods sold, it must have been able to control other operating costs well enough to prevent net income from declining by the full 3% of the rise in its cost of goods sold. Many other items on the income statement are proportionately similar to 2007, although the operating expenses seem to be declining relative to sales. This could indicate that management is doing a better job at controlling those operating expenses. As well, income tax as a proportion of sales decreased, but income tax expense is generally not under management's control. The signals on this common size statement are mixed—cost of goods is increasing but other expenses decreased slightly. Overall, however, the net effect is a decrease in net income.
Common size statements could also be prepared for the balance sheet and the cash flow statement. The common size data could then be used in a time-series analysis, as they were earlier, or they could be used in a cross-sectional analysis of different companies. In fact, common size statements are particularly useful in cross-sectional analysis because they allow you to compare companies of different sizes.
Ratio Data
Common size data are useful for making comparisons of data items within a given financial statement, but they are not useful for making comparisons across the various financial statements. Ratios, on the other hand, compare a data element from one statement with an element from another statement, or with an element in the same statement. These ratios can then be used in a time-series or cross-sectional analysis. Ratio data are potentially the most useful analytical tool because they reveal information about relationships between the financial statements.
Although ratios tell you about the relationship between two figures and changes in that relationship from year to year, or compared to another company, they do not tell you the reason for the changes. You will usually need to do further research and analysis, or talk to management, to understand the reasons for the changes. Sometimes changes in ratios are referred to as red flags—they identify areas that the user needs to investigate further.
To illustrate the relationships that can be analyzed using ratio analysis, the remainder of the chapter is devoted to discussing various ratios and their calculation and interpretation. Most of them have already been introduced in previous chapters, but a discussion of the ratios as they relate to one another should help you to better understand and appreciate the usefulness of ratio analysis.
Before you begin ratio analysis, it is important to remember that financial statements are based on IFRS. This means that they involve certain accounting policy choices, assumptions, and estimates. As well, many of the assets and liabilities are reported at historical cost values rather than market values. Consequently, the limitations inherent in the financial statements are carried over into the ratios that are used to evaluate them.
LEARNING OBJECTIVE 3
Identify the types of ratios that are best at providing insights for specific decisions.
RATIOS
Ratios explain relationships among data in the financial statements. The relationships differ across companies, if for no other reason than that the companies' underlying transactions are different. For example, a manufacturing company is very concerned about the management of inventory and focuses on various ratios related to inventory. A bank, on the other hand, has no inventory and would not be able to calculate such ratios. It might, however, be very concerned about the loans that it makes, whereas a manufacturer would probably not have any items comparable to loans receivable.
Because of the differences across companies, it is impossible for us to address all the ratio issues related to all types of industries. The main focus of our discussion will, therefore, be restricted to BIC, but most of our discussion also applies to companies in other manufacturing and retailing industries. At the end of the chapter, we include a brief discussion of ratio analysis for non-retailing/manufacturing companies in areas where there may be differences in interpretation.
The ratios that will be discussed are divided into four general categories, but you will see that they are all related. The categories are performance, short-term liquidity, activity, and long-term solvency. Most of these ratios apply to any company regardless of the nature of its business, but some (such as inventory ratios) apply only to certain types of businesses. A fifth group of ratios applicable to equity analysis will also be discussed.
Before the calculations of the various ratios are presented, one general caveat is given. There are often several ways to calculate a given ratio. Therefore, it makes sense to understand the basis of a calculation before you attempt to interpret it. The use of ratios in this book will be consistent with the definitions given. However, if you use similar ratios from other sources, you should check the definition used in that source to make sure that it is consistent with your understanding of the ratio.
LEARNING OBJECTIVE 4
Calculate specific ratios that are used to assess a company's profitability, short-term liquidity, activity, and solvency, and explain how the ratios can be interpreted.
Profitability Ratios
Net earnings and cash flow as measures of performance have already been discussed in Chapters 2 and 4. Although much can be learned from studying the statement of earnings and statement of cash flows, in both their raw data and common size forms, the ratios discussed in this section complement that understanding and also draw out some of the relationships between these statements and the balance sheet.
Net Profit
In Chapter 2 we used the profit margin ratio, or more correctly the net profit margin, to measure a company's profitability relative to its revenues. This ratio provides information about the company's ability to control all costs and is calculated by dividing the company's net earnings by the revenues that produce those earnings:

The net profit margin is a good starting point to determine if a company is profitable, but it does not provide any information about how that profit was achieved or what resources were required to earn it. Were the earnings mostly from the company's primary operations, or did the company have significant earnings from investment income or one-time gains from selling other assets? When trying to predict a company's future earnings, the current sources and types of earnings are an important consideration. A company cannot sell off assets continuously and expect to stay in operation for long.
Earlier in the chapter, we identified different strategies a company could be using. Is the company's strategy to produce at the lowest cost and sell a high volume? Or does it sell a differentiated or premium product at a higher margin and lower volume? Answers to these questions can be obtained by looking at other margin ratios calculated from the statement of earnings.
Gross Profit
The gross profit margin measures the proportion of sales revenue available to pay all other operating costs after the costs of goods sold. It is calculated as gross profit divided by revenues. It is a key ratio in assessing a company's profitability. The cost of goods sold is, for most businesses, the largest single cost incurred and companies need to pay close attention to this margin to ensure that there is enough money available after those costs to pay all other expenses. Changes in this ratio would indicate a change in the product's profitability and may indicate changes in the cost structure or pricing policy.

Some companies choose not to disclose the cost of goods sold separately on the statement of earnings because they do not want competitors to know that information. In those situations, the cost of goods sold is usually grouped with other operating costs and an operating profit margin is shown. Calculating a ratio for that margin would also be useful, but would not provide the same level of information as a gross margin and a separate analysis of operating costs.
BIC does disclose the cost of goods sold separately on its income statement, and both the net profit margin and gross profit margin were calculated as part of the common size income statement in Exhibit 12-4 and are repeated here. In 2009, for every €1 BIC made in sales, it had €0.461 left over after covering the cost of the item that contributed to the €1 in sales. And after paying all other costs, it had €0.097 left in profit on the €1 of sales.
It should be apparent to you that gross profit margin and cost of goods sold are reciprocal figures. If BIC had €0.461 of gross profit left over from the euro in sales after paying for the related cost of goods sold, it must have cost BIC €0.639 (€1 – €0.461) to earn that euro in sales. Some analyses focus on the cost to make the good—a cost of goods sold percentage—whereas the gross profit margin ratio views it from the gross profit margin perspective. The conclusions drawn from either approach would be the same.
In the discussion of both the financial highlights and the common size income statement, we raised concerns that BIC's profitability was declining. We now see that net profit margin decreased by 0.5% from 2008 to 2009, but gross profit margin decreased by more, 1.0%. BIC has less money available after producing its goods to pay other costs. It appears that costs have been rising faster than selling prices. This could be due to several factors. It may be due to poor cost controls. It may be that the company has chosen (or been forced) to lower prices relative to costs. Or perhaps there has been a change in BIC's product mix and it is selling more low margin items than previously. Further analysis or discussions with management would be necessary to know the exact cause, but the concern has been identified. The fact that the net profit margin did not decrease by the same amount as the gross profit margin indicates that BIC is doing a better job of controlling (is spending less per euro of sales) its other costs. This is a positive sign.
PROFIT MARGINS—SOCIÉTÉ BIC
Net profit margin
Gross profit margin
![]()
In addition to the profitability of earnings relative to revenues, it is important to examine the earnings relative to the amount invested to earn those earnings. If two companies generate the same amount of net earnings, but one company requires twice as many assets to do so, that company would clearly be a less desirable investment.
In Chapter 4, a performance ratio called the return on investment (ROI) was briefly discussed in generic terms as a measure of an investment's performance.
The generic form of the ROI calculation can be used to formulate several different ratios, depending on the perspective taken in measuring performance. For example, one perspective is that of the shareholders, who make an investment in the company and want to measure the performance of their investment. Return on equity (ROE), which we also saw in Chapters 4 and 11, is a form of the ROI measure that captures the return to shareholders.
A second perspective is that of management. Management obtains resources from both shareholders and debt holders. Those resources are then invested in assets. The return generated by the investment in assets is then used to repay the debt holders and the shareholders. The profitability of the investment in assets is, therefore, very important. First seen in Chapter 8, return on assets (ROA) captures this type of ROI.
In this chapter, both ROA and ROE are considered.
Return on Assets (ROA)
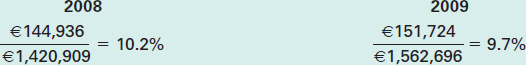
Company management must make two fundamental business decisions. The first is the type of assets in which the company should invest (sometimes referred to as the investment decision), and the second is whether to seek more financing to increase the amount that the company can invest in assets (referred to as the financing decision). The ROA ratio, in this book, separates the investment decision from the financing decision. Regardless of the mix of debt and shareholder financing, this ratio asks the following question: What type of return is earned on the investment in assets? From this perspective, the return on the investment in assets should be calculated prior to any payments or returns to the debt holders or shareholders. Net earnings is a measure that is calculated before any returns to shareholders, but after the deduction of interest to the debt holders. Therefore, the net earnings, if it is to be used as a measure of return on assets, must be adjusted for the effects of interest expense so that the financing effects are removed from the earnings amount, resulting in a measure of the earnings generated by the assets that is available to pay both debt holders and shareholders.
A complicating factor in calculating this ratio is that interest is deductible in the calculation of income tax expense. Therefore, if interest expense is to be removed from the net earnings figure, we must also adjust the amount of income tax expense that would result. In other words, the tax savings (i.e., the reduction in income tax expense) associated with this interest deduction must also be removed. The ROA ratio is then calculated as the ratio of the return (income before interest) divided by the investment in total assets, as follows:
Many companies show interest expense as a separate item on the statement of earnings. The interest expense for BIC is included in the finance costs on the income statement, and can be determined from reading Note 6, which is shown in Exhibit 12-5. Also included in the finance costs are gains or losses on some types of foreign currency exchanges and derivatives used for hedging, both of which are beyond the scope of this book.
EXHIBIT 12-5 SOCIÉTÉ BIC 2009 ANNUAL REPORT
Excerpt from Note 6: Finance Costs/Revenue

The effective income tax rate can be calculated by dividing the income tax expense on the income statement by the income before tax (in 2009, €70,843 ÷ €218,747 = 32.4%). Based on the data for BIC, the calculation of the ROA for 2009 and 2008 has the following results:
RETURN ON ASSETS (ROA)—SOCIÉTÉ BIC

The 8.6% ROA in 2009 indicates that BIC earned 8.6% on the average total assets before making any payments to the suppliers of capital. This 8.6% should be compared with the 9.2% ROA earned in 2008. The decrease in the ROA is consistent with the decrease in profitability that we observed with the net profit margin and the increase in total assets in the common size financial statements. It should be compared with the ROA of other companies of similar risk.
The ROA is useful in measuring the overall profitability of the funds invested in the company assets. However, comparisons of ROAs across industries must be made with care. The level of ROA reflects, to some extent, the risk that is inherent in the type of assets that the company invests in. Investors trade off the risk for the return. The more risk investors take, the higher the return they demand. If the company invested its assets in a bank account (a very low-risk investment), it would expect a lower return than if it invested in oil exploration equipment (a high-risk business). Although this factor cannot explain all the variations in ROA between companies, it must be kept in mind. It may be more appropriate either to do a time-series analysis of this ratio, or to compare it cross-sectionally with a direct competitor in the same business. Data obtained from a source of industry ratios, such as Dun and Bradstreet, can provide you with median measures of ROA that can be used for comparison purposes to determine whether the calculated ROA of a specific company is reasonable or not.
There exists a useful breakdown of the ROA ratio that can provide insight into what caused a change in the ROA. The most common breakdown of this ratio is as follows:

This breakdown of the ROA ratio into a profit margin ratio and a total asset turnover allows the analyst to assess some of the reasons for a company's ROA having gone up or down. Note that this is not the same profit margin ratio as the net profit margin ratio calculated earlier, because it is calculated using the profit or earnings before the after-tax interest expense. Changes in this ratio would indicate a change in the product's profitability and may indicate changes in the company's cost structure or pricing policy. The total asset turnover is the ratio of sales to total assets, or the dollars of sales generated per dollar of investment in assets. Changes in this ratio could reflect an increase or decrease in sales volume or major changes in the level of investment in company assets.
The breakdown for BIC in 2009 would be as follows:
ROA BREAKDOWN—SOCIÉTÉ BIC

These calculations indicate that in 2009 BIC earned the 8.6% ROA by achieving a profit margin of 10.1% and a total asset turnover of 0.85 times. Note that the decrease in the ROA from 2008 was a result of both a decrease in the profit margin (from 10.5% to 10.1%) and a small decrease in the total asset turnover ratio (0.87 to 0.85). So declining profitability is not the only difficulty BIC faced; there was also a decrease in sales generated per euro of assets. That could reflect declining efficiency of assets, or investment in new assets that have yet to reach their full potential to generate sales. The decrease in total asset turnover is small, and would need to be compared to other years or other companies before a conclusion could be reached about whether it should be of concern to an analyst. We saw earlier that BIC's assets grew as a result of an acquisition in 2009, and it appears that those assets have been able to generate close to BIC's traditional level of sales. The decrease in profitability, however, is consistent with earlier concerns we identified about BIC's performance in recent years.
Earlier in the chapter, we identified two strategies a company could be pursuing. The same ROA could be achieved by companies in the same industry with different strategies. For example, a discount retailer operates on smaller profit margins and hopes to make that up by generating a larger volume of sales relative to its investment in assets (giving it a higher asset turnover). Discounters generally have less invested in their retail stores. Other full-price retailers have a much larger investment in assets relative to their sales volume (giving them a lower asset turnover), and they must therefore charge higher prices (giving them a higher profit margin) to achieve a comparable ROA. Both businesses face the same general sets of risks and should earn comparable ROAs.
Return on Equity (ROE)
Return on equity (ROE), mentioned earlier in this section, is the return that shareholders earn on their investment in the company. There is an additional issue that must be understood in calculating this ratio. If there is more than one class of shares (generally the second class would be preferred shares), the ROE calculation should be done from the point of view of the common shareholders. This means that any payments to the other classes of shares (preferred dividends, for example) should be deducted from net earnings in the numerator of this ratio, because these amounts are not available to the common shareholders. Similarly, the denominator in such cases should include only the shareholders' equity accounts that belong to common shareholders. This usually means that the preferred shares equity account is subtracted from the total shareholders' equity to arrive at the common shareholders' equity.
HELPFUL HINT
When removing the preferred dividends for this calculation, you need to remove the dividends that were owed in the current year for preferred shares that are cumulative. If the current year's owed dividends are removed each year, it is not necessary to remove the dividends in arrears that were paid in a given year since prior years already included them in an ROE calculation.
The calculation of a company's ROE is as follows:

As BIC only has common shares, we do not have to consider preferred shares and their related dividends. However, the minority interest that is shown in BIC's shareholders' equity section is not an investment by common shareholders; it reflects the fact that BIC does not own 100 percent of some of the subsidiaries that it controls. Minority interests are discussed further in Appendix B, but for now it is enough for you to understand that they are not included in common shareholders' equity and hence the denominator for BIC is the Group Shareholders' equity amount from the balance sheet.
For BIC, the calculation of ROE is as follows:
RETURN ON EQUITY (ROA)—SOCIÉTÉ BIC

This calculation shows that BIC earned a 12.3% ROE in 2009, indicating that it earned an average of 12.3% on the average shareholders' equity balances. This is down slightly from the previous year's ROE of 12.4%, but not as much as the ROA decreased. Just as with the ROA, this ROE of 12.3% should be compared with the ROE of other similar companies, or with the results of BIC over time. Cross-sectional comparisons of ROE (among different companies) are difficult for the same reason that similar comparisons of ROA are difficult. Differences in the risks involved should result in differences in returns. Differences in the risks cannot, however, always explain large differences in returns, as there are many factors that affect ROE.
Leverage
Comparing the ROE calculated for BIC with the associated ROA shows that the company, while earning only an 8.6 % return on assets, showed a return of 12.3% on the shareholders' equity. This higher return on equity results from the company's successful use of financial leverage. Financial leverage simply means that some of the funds obtained to invest in assets came from debt holders rather than shareholders. A company that has a larger proportion of debt to shareholders' equity is said to be highly leveraged.
In the case of a totally shareholder-financed company—that is, a company with no debt—the ROE (assuming there is only one class of shares) would equal the ROA. There would be no interest expense and, therefore, the numerators of both ratios would be the same. The denominators would also be the same because the accounting equation (assets = liabilities + shareholders' equity) would be adjusted for the absence of any liabilities (assets = shareholders' equity).
To understand the effects of leverage, consider first the data in Exhibit 12-6 for the fictitious Baker Company, which we assume to be 100% equity-financed. Note that in this example, Baker generates a 15% return on its assets before taxes (earnings before interest and taxes ÷ assets = $150 ÷ $1,000). After the 40% corporate income taxes, this translates into a 9% after-tax return (ROA). Note also that the ROE is the same as the after-tax ROA, because there is no debt and therefore no leverage effect.
The key to financial leverage is the relationship between the after-tax cost of borrowing and the return on assets. When a company borrows money, it invests that money in assets and earns the company's return on assets on that amount. The cost of using those funds is the after-tax cost of borrowing. If the cost to borrow is less than the return that the company can earn on the funds, then the wealth of the company will increase. If it costs the company more to borrow than it can earn on the funds, the wealth of the company will decrease.
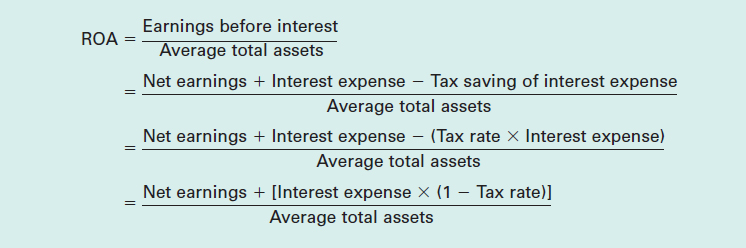
It is necessary to use the after-tax cost of the debt in the comparison, as opposed to just the interest rate, because interest expense, as we saw earlier, is tax deductible and therefore generates tax savings for a company. The taxes saved are the tax rate times the interest expense. The net cost to the company is therefore the interest paid minus the taxes saved. For example, if a company borrows $400 at a rate of 10% and the tax rate is 40%, the net after-tax cost would be as follows:
Case A: 100% Equity-Financed

HELPFUL HINT
The after-tax cost of debt = interest expense × (1 − tax rate), or i × (1 − t).
This equation can be applied either to the interest expense in dollars [i.e., $40 interest expense × (1 − 0.40) = $24 net cost of borrowing, as shown in the example], or to the interest rate in percent [i.e., 10% interest rate × (1 − 0.40) = 6% net cost of borrowing].
When analysts talk about the after-tax cost of borrowing, they normally do it in terms of the rate.
Now consider the data in Exhibit 12-7 for Baker Company, which assumes that the company is only 60% equity-financed. To keep the illustration simple, all liabilities are considered interest-bearing at the rate of 10%. There are two statements of earnings presented, Case B where the earnings before interest and taxes (EBIT) is the same as in Case A, $150, and Case C where EBIT has fallen to $75.
In Exhibit 12-7, several things should be noted. The first is that in Case B the ROA (9%) is the same as in the all-equity case in Exhibit 12-6 because the amount of assets has not changed; only the amount of debt has changed. Before interest and tax, the assets should be earning exactly what they would have earned in a 100%-shareholder-financed company. In Case C, when EBIT has fallen by half (from $150 to $75), the ROA has fallen by the same amount (from 9% to 4.5%).
Note that in Case B the ROE (11%) is greater than the ROA (9%). This occurs because the company was able to borrow at an after-tax interest rate that was less than the rate it could earn by investing in assets. The before-tax borrowing rate in Case B is 10%. To adjust this to an after-tax rate, we multiply it by 1 minus the tax rate: 10% × (1 − 0.40) = 6%. Thus, the after-tax cost of debt is 6%, whereas the after-tax return on assets (ROA) is 9%. This increases the ROE for the shareholders.
Case B and Case C: 60% Equity-Financed, Interest Rate 10%

The increase in the ROE in Case B occurs because, when the company borrowed $400 its net cost of borrowing was $24, but it was able to generate $36 (9% × $400) in income from the borrowed funds. The difference is $12, which goes to the shareholders as an incremental return. Therefore, the shareholders earn a $54 (9% of $600) return on the money that they invested, plus the excess return of $12 that is earned on the money that was borrowed, for total earnings of $66. Thus, without any further investment on their part, their percentage return (ROE) over what they could have earned as a 100%-equity-financed company is improved from 9% to 11% ($66 ÷ $600).
In Case C, the ROE (3.5%) is less than the ROA (4.5%). This occurs because the after-tax cost of borrowing at 6% is now greater than the 4.5% return on assets. As a result, the company is incurring the same net borrowing cost of $24 to earn a return of $18 (4.5% × $400). If you are paying more to obtain funds than you can earn by investing them, overall wealth is going to suffer. Note that although the ROA fell by half, the ROE plunged by more than this, from 11% to 3.5%. This is much less than the ROE of 9% in the 100%-equity-financed case; the shareholders would have been better off if the company had not borrowed at all.
This, then, is the advantage and risk of leverage. The shareholders can improve their return (ROE) if the company can borrow funds at an after-tax borrowing rate that is less than the ROA. However, this is a big if. A company that leverages itself is committed to making fixed interest payments to debt holders prior to earning a return for its shareholders. It is betting that the return on assets will be higher than the after-tax cost of its borrowing. If it is wrong and the after-tax cost of borrowing is greater than the ROA, the return to the shareholders (ROE) will fall below what the company could have earned with no debt at all.
If leveraging the company a little is potentially a good thing, as Case B in Exhibit 12-7 illustrated, why not leverage it a lot? In other words, why not borrow funds to finance most of the company's assets? For example, why not have 80% debt and 20% equity in the company?
Case D in Exhibit 12-8 illustrates the kind of return that the company could expect if it had 80% debt financing and the same 10% interest rate and EBIT as Case B in Exhibit 12-7.
A return of 21% is certainly very attractive, compared with the ROE of 11% that could be achieved with a 60% equity-financed company. The problem with this financing strategy is that the riskiness of an investment in Baker Company will be much higher in Case D (with 80% debt and only 20% equity) than in Case B. With high interest charges to be covered, if the company's ROA drops, the ROE will plunge—and may become negative—very rapidly.
The amount of leverage that a company can use is affected by several factors, including the stability of operating cash flows and the types of assets employed by the company. The cost of borrowing for a company increases as the amount of leverage increases. As the company adds more and more debt to its capital structure, it is committing itself to higher and higher fixed interest payments and increasing the risk of not being able to repay the borrowed funds. The increased obligations could perhaps force the company into bankruptcy. Because of the increased risk, as the company increases its level of debt it has to pay higher interest rates. When its borrowing cost starts to equal or exceed its ROA, it will become unattractive to lenders if it seeks further funds.
As we saw in our simple examples, return on equity improves relative to a 100%-equity-financed company when a company begins to use leverage and the ROA is greater than the after-tax cost of borrowing. But as the company continues to increase the amount of debt there is a point where the increasing risk, and hence increasing cost of borrowing, starts to exceed the benefits, and the return on equity starts to decrease. The level of leverage that would maximize the return on equity is sometimes called the company's optimal capital structure. This optimal capital structure exists in theory but is more difficult to determine in the real world. It is true, however, that as you look across industries, different types of businesses have different average levels of debt financing (i.e., leverage). This indicates that, based on the risk characteristics of those industries, the companies in those industries borrow up to the point that they think is beneficial to their shareholders, and no further.
Case D: 20% Equity-Financed, Interest Rate 10%

In the notes to its financial statements, BIC discloses that interest rates on its borrowings varied from 2.80% to 11.50%, before taxes. Rates on different borrowings vary depending on the terms and conditions of the debt, as well as the length of time until its maturity and what the market interest rates were at the time the debt was issued. BIC's tax rate was approximately 32.4%, which means its after-tax interest rate ranged from 1.9% to 7.8%. If its ROA was 8.6%, BIC was earning a higher return on its assets than it paid to borrow money. Its ROE of 12.3% illustrates how BIC's use of leverage boosted its ROA into a higher return to its shareholders.
A company's use of leverage can be judged, to some extent, by the difference between its ROE and its ROA, as the hypothetical Baker Company example and BIC's results show. In addition, several other ratios are used to measure the amount of leverage the company employs, as well as how well it uses that leverage. These ratios include the debt to equity ratio and the times interest earned ratio, which are discussed in a later section on solvency.
The following story indicates that if a company gets an appropriate level of leverage and controls costs, the results can be an increase in its share price.

accounting in the news
Cott Has Caught Analysts' Attention
Prospects were not looking good for Cott Corp. in 2009, but the private-label beverage maker's recent transformation has changed some analysts' minds. Cott Corp. shares rose by as much as 7 percent in September 2010 after the company was rated “Buy” in new coverage from Deutsche Bank. Other analysts were also now recommending Cott as a buying opportunity. Their reason is management's return to basics–lean infrastructure, disciplined cost management, a quality low-cost product, healthy customer relations, and a sound balance sheet. In addition, Cott's acquisition of the private-label juice maker Cliffstar Corp. was seen as a significant strategic step forward, providing the company with a better product balance and making it more consistently profitable. Efforts to deleverage the company's balance sheet were also creating value in the short to intermediate term. So, although Cott is not likely to be a fast revenue grower, its improved cost discipline and synergies from Cliffstar should allow the company to generate a steady margin and free cash flow in the future.
Source: David Pett, “Cott Shares Soar,” Financial Post, September 21, 2010. http://business.financial-post.com/2010/09/21/cott-shares-soar/
Short-Term Liquidity Ratios
As discussed in Chapter 1, liquidity refers to a company's ability to convert assets into cash to pay liabilities. A basic understanding of the company's short-term liquidity position should result from a consideration of the financial statements, particularly the statement of cash flows, as well as the turnover rates discussed in the next section on activity ratios. Understanding the liquidity position requires knowledge of the leads and lags in the company's cash-to-cash cycle, discussed in Chapters 4 and 5. Managing a company's cash cycle is sometimes also referred to as working capital management. You will recall from earlier chapters that working capital = current assets − current liabilities. In addition, at least three ratios provide quantitative measures of short-term liquidity: the current and quick ratios, and the operating cash flow to short-term debt ratio.
Current Ratio
The current ratio is calculated by comparing the total current assets with the total current liabilities, as follows:

Remember that current assets are those that are going to be converted into cash in the next year (or the company's operating cycle, if it is longer than one year), and current liabilities are going to require the use of cash or other assets in the next year. As such, this ratio should be greater than 1; otherwise, it is difficult to see how the company will remain solvent in the coming year. The rule of thumb for this ratio for most industries is that it should be 1 or more, and, to be conservative, approximately 2. However, the size of this ratio depends on the type of business and the types of assets and liabilities that are considered current. For example, a company that sells primarily on a cash basis and does not have any accounts receivable, like a grocery store, normally has a low current ratio.
One caveat: the current ratio is subject to manipulation by a company at year end. This ratio may not, therefore, be a very reliable measure of liquidity. As a simple example, consider a company that has $100 in current assets and $50 in current liabilities at the end of a given year. Its current ratio would be 2 ($100 ÷ $50). Suppose that $25 of the $100 is in cash and the rest is in inventory. Suppose further that the company uses up all of its $25 in cash to pay $25 of current liabilities at year end. The current ratio becomes 3 ($75 ÷ $25) and the company looks more liquid. However, it is actually less liquid; in fact, it is virtually illiquid in the short term, because it has no cash and must sell its inventory and wait until it collects on the sale of that inventory before it will have any cash to pay its bills. In this case, the current ratio is deceptive.
The current ratios for BIC are as follows:
CURRENT RATIO—SOCIÉTÉ BIC

The current ratio of 3.42 in 2009 is a slight decline from the 3.72 of the previous year. With the ratio above 2 in both years, however, BIC appears able to comfortably handle its short-term obligations. Upon reviewing the components of current assets, we can see that cash and cash equivalents more than doubled over 2008 and is the largest current asset in 2009. There was also an increase in accounts receivable. Despite both these changes, which should increase liquidity, the current ratio decreased. This is because almost all of the current liabilities increased—accounts payable, current borrowings, and other current liabilities. The increase in the current obligations of the company offset the increase in assets and BIC is less liquid than in 2008. Despite this drop, the company appears to be healthy with respect to liquidity.
It is important to note that it is possible for a company to be too liquid—to have too much money invested in assets such as cash and accounts receivable that do not generate any returns for the company. Then again, an increase in cash and cash equivalents might be part of the company's strategy. Maybe the company needs liquid assets for a planned purchase or acquisition early in the next year. Finding answers to questions like these is why it is important for an analyst to understand the business and to talk to management or do additional research before drawing conclusions.
Quick Ratio
One problem with the current ratio is that some assets in the current section are less liquid than others. For example, inventory is usually less liquid than accounts receivable, which are less liquid than cash. In some industries, inventory is very illiquid, because of the long period of time that it may have to be held before sale. Consider, for example, the holding period in the manufacture of 12-year-old Scotch whisky. The current ratio in such cases will not adequately measure the company's short-term liquidity, because the inventory will not be converted into cash for a very long time. In this case, the quick ratio is a better measure of short-term liquidity. It differs from the current ratio in that only the most liquid current assets (cash, accounts receivable, and short-term investments) are included in the numerator. Other current assets, such as inventories and prepaid expenses, are excluded from this ratio. Prepaid expenses do not convert into cash. Instead they used cash in the past and the company will be saving cash in the future because amounts have been paid in advance. The ratio is calculated as follows:

The rule of thumb for this ratio is that it should be approximately 1 or more. A quick ratio of 1 means that the very short-term current assets are equal to the total current liabilities. Again, the desirable level for this ratio depends on the type of industry.
Some judgement is necessary when reviewing BIC's balance sheet to determine which current assets should be included in this ratio. Some of the account titles are not completely clear with respect to understanding how easily the asset could be converted into cash, and do not have accompanying notes to guide the user. The “other current financial assets” are most likely short-term investments, and hence should be included in the quick ratio. Recall from Chapter 6 that financial assets include marketable securities or short-term investments. The “income tax advanced payments” and “other current assets” are more likely similar to prepaids and would not be included in the ratio. The derivative instruments—“Current financial” and “Other”—are more difficult to discern. The quick ratio is intended to be a more stringent test of a company's liquidity than the current ratio; therefore, conservatism would dictate that if we are not certain about an item it is better to exclude it. The “Assets held for sale” will generate cash, but the timing and amount of the cash flow is uncertain, and the amounts are small. It is best to exclude this account as well. Based on those classifications, the calculation is as follows:
QUICK RATIO—SOCIÉTÉ BIC

The quick ratio of 2.50 in 2009 is slightly higher than the quick ratio of 2.27 in 2008, which should not be surprising. Remember that when we discussed the current ratio we noted major increases in BIC's most liquid assets—cash and receivables. The increase in these most liquid of assets is reflected in the increased quick ratio. In both years, the quick ratio is well above the 1.0 rule of thumb amount and brings us back to the concern that perhaps the company has too much invested in assets that do not produce much (if any) return.
Taken together, the current ratio and quick ratio indicate that BIC's liquidity position seems to be healthy but that more information would be useful. Just reviewing these two years illustrates the importance of time-series analyses in understanding a ratio. Going back further than the two years would enable you to see whether a current ratio above 3 and a quick ratio above 2 are normal. Cross-sectional analyses should also be undertaken with other companies that manufacture plastic consumer products.
Operating Cash Flow to Short-Term Debt Ratio
In Chapter 5, we discussed the importance of the information on the cash flow statement, how it is prepared, and how it should be interpreted. (You may want to refer to Chapter 5 to refresh your understanding of how to interpret the information on the cash flow statement.) The cash flow statement details the inflows and outflows of cash from operating, financing, and investing activities. The operating cash flow to short-term debt ratio is another measure of the company's ability to meet its short-term debt. It is calculated as follows:
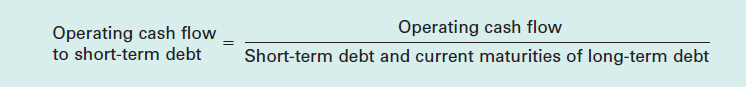
Like the current ratio and the quick ratio, the higher this ratio is, the better the company can meet its short-term debt obligations. For BIC, the results for 2009 and 2008 are as follows:

The operating cash flow to short-term debt ratio of 0.97 in 2009 has increased from the 0.92 of the previous year. The increase indicates that BIC can more comfortably handle its short-term debt obligations; in fact, BIC could almost completely pay off all of its short-term obligations with the operating cash flow generated in the year. Both long-term and short-term debt have increased in 2009 as a result of the acquisitions undertaken, but the cash from operations has also increased, so BIC's ability to meet its short-term obligations continues to look strong.
Activity Ratios
The activity ratios provide additional insight into the major decisions management makes regarding asset use and liquidity. The total asset turnover ratio, discussed earlier as a component of the ROA, is a measure of a company's total asset utilization. There are three other turnover ratios we will discuss to better understand liquidity and assess management's policies concerning accounts receivable, inventory, and accounts payable. They relate to the three policy decisions that were discussed in Chapter 5 regarding the company's cash flow performance. They are the accounts receivable, inventory, and accounts payable turnovers. These ratios provide some quantitative measures of the lead/lag relationships that exist between the revenue and expense recognition and the cash flows related to these three items.
Total Asset Turnover
The total asset turnover ratio measures the dollar amount of sales generated for each dollar invested in assets. Companies acquire assets to generate net earnings, and the first step in generating net earnings is to generate sales. Consider a business that has a single asset that will be used to produce the goods for sale. If management decides to expand by purchasing a second asset, would the sales level double? Perhaps the sales might not double immediately if the second machine were not yet operating at full capacity, but if the company wants to maintain the same level of efficiency its objective would be to have the sales level double. By examining the ratio of sales to assets, the asset turnover ratio, we can assess how efficiently the company is using its assets. This is a different measure than merely comparing net income to see if it has doubled, because other factors such as cost control influence net income. By differentiating between the effect on sales versus net income, managers and analysts can determine if the company's difficulties lie in generating sales, or in controlling costs. The solutions to those two problems are different, so determining which one is the source of the problem is important for effective management.
As calculated for ROA (on page 801), the total asset turnover for BIC in 2009 was 0.85, down slightly from 0.87 in 2008. It appears that with BIC's recent acquisitions, its efficiency has fallen slightly. Trend analysis would be useful to determine if the decrease is due solely to the acquisitions or is a longer term concern.
Accounts Receivable Turnover
The accounts receivable turnover ratio attempts to provide information about the company's accounts receivable policy. This ratio was introduced in Chapter 6, when the management of accounts receivables and other short-term liquid assets was discussed. This ratio measures how many times during a year the accounts receivable balance turns over—that is, how many times old receivables are collected and replaced by new receivables. It is calculated as follows:

When data from financial statements are used, the assumption is usually made that all sales were on account, because there is usually no information in the financial statements about the percentage of credit sales (or sales on account) versus cash sales. If the turnover ratio were being prepared for internal use by management, this type of information would be available and only credit sales would be used when calculating this ratio. It is probable that most of BIC's sales are credit sales, since it sells its products to retailers and wholesale distributors. Companies that sell directly to the public, like grocery stores, tend to sell primarily on a cash basis and hence have few (if any) credit sales. Additionally, the ratio should only include receivables related to credit sales, often referred to as trade receivables, and not other miscellaneous receivables (for example, receivables related to expected tax refunds or advances to employees). The description in BIC's balance sheet is “trade and other receivables,” and although the breakdown is available in the notes, for simplicity we will assume they are all related to sales.
Using BIC's data, the ratio is as follows:
ACCOUNTS RECEIVABLE TURNOVER—SOCIÉTÉ BIC

The level of the accounts receivable turnover depends on several factors, especially the normal credit terms granted by the company. If the company normally allows 30 days for customers to pay, and if customers actually pay in 30 days, the resulting accounts receivable turnover would be 12 times, because there would be one month of sales always outstanding in accounts receivable. If the normal credit term is 60 days, the resulting accounts receivable turnover would be 6 times (because 365 days ÷ 60 days is approximately 6 times). To determine how effectively a company is collecting its receivables, it is necessary to compare the turnover rate to the company's credit terms.
With an accounts receivable turnover of 4.62 times, it appears that BIC is collecting its receivables in 79 days (since 365 days ÷ 4.62 = 79). We do not know how this compares to BIC's actual credit terms, because we do not know the company's credit policies. If its credit terms are 60 days, the company is not collecting its receivables on a timely basis; that is, customers on average are taking longer to pay than the terms given. If the credit terms are 90 days, then it appears customers are paying more quickly and BIC is benefitting from the earlier cash inflows. BIC's 2009 turnover is higher than in 2008 (4.30 times), indicating that it is turning the receivables over more quickly—that is, the company is collecting the receivables a little faster than in 2008, improving the cash inflow. The increase would be a good signal of improving cash collections and maybe improved liquidity.
An accounts receivable turnover ratio that indicates the company is collecting its accounts receivable more slowly than the credit terms imply, or more slowly than others in the industry, could indicate that the company is having trouble collecting its accounts receivable. Is the company selling to customers that do not pay? Does the company still have old accounts receivable that should be written off on its books? Has it been making an adequate allowance for bad debts? Depending on the answers to these and other similar questions, a high level of accounts receivable may not always be associated with high levels of liquidity or good cash management.
The turnover number can also be converted into a measure of the days necessary to collect the average receivable, by dividing the numbers of days in one year by the turnover ratio. Although they measure the same thing, users may find that the average days to collect is easier to interpret than accounts receivable turnover numbers. Although companies probably do not sell goods or collect receivables every day of the year, the convention is to use 365 days. The average days to collect for BIC follows:
DAYS TO COLLECT ACCOUNTS RECEIVABLE—SOCIÉTÉ BIC

As noted earlier, you cannot simply look at the 79.0 days and decide whether it is bad or good. You need to know what the credit terms are, and if the average monthly sales are fairly equal, since large sales in the last month of the fiscal year would result in an apparently lower turnover (due to higher accounts receivable balances at year end) and a higher number of days to collect. You also need to know the proportion of total sales that are made on credit. To analyze both of these ratios more fully, we should also consider a time-series analysis and a cross-sectional analysis with competitors.
Inventory Turnover
The inventory turnover ratio gives the analyst some idea of how fast inventory is sold or, alternatively, how long the inventory is held prior to sale. This ratio was introduced in Chapter 7. The calculation of the turnover is similar to that of the accounts receivable turnover, with a measure of the flow of inventory in the numerator, and a measure of the balance in inventory in the denominator. It is calculated as follows:

Note that the numerator contains the cost of goods sold, not the sales value of the goods sold (revenues). Total sales revenue, while it does measure the flow of goods sold to customers, would be inappropriate in the numerator because it is based on the inventory's selling price, while the denominator is measured at cost. Cost of goods sold is measured at cost and is therefore more appropriate.
The number of days that inventory is held can be calculated from the turnover ratio in the same way as was the accounts receivable turnover ratio. BIC's results for both of these ratios follow:
INVENTORY TURNOVER AND DAYS IN INVENTORY—SOCIÉTÉ BIC

The average number of days that inventory is held depends on the type of inventory produced, used, or sold. In BIC's case, remember that its major operations are the sale of stationery, lighter, and shaver products to both retailers and wholesalers. The 131 days, therefore, refers to the average length of time that costs remain in inventory, from original processing to sale of the products to customers. Because the product is not perishable, this length of time could be reasonable. Before making this assumption, however, you would want to review this turnover over time and against the inventory turnover ratios of other companies producing and selling plastic consumer goods. BIC's 2009 inventory turnover is higher than in 2008, indicating that BIC is holding the goods for fewer days in 2009. The shorter the holding time, the less money tied up in inventory, which is generally a good sign.
One limitation that must be considered when interpreting the inventory turnover ratio is that many companies do not disclose the cost of goods sold amount on the statement of earnings. They will sometimes skip from the revenue amount directly to earnings before other operating expenses. In such cases, you will need to find the cost of goods sold by subtracting earnings before other operating expenses from gross revenue. Another problem with determining this ratio is that some companies combine the cost of goods sold with other operating expenses. The resulting figure is, therefore, larger than the cost of goods sold figure and the resulting inventory turnover is larger as well (making it look as if the company is turning it over more quickly). Under these circumstances, it is important to treat this ratio with some skepticism.
BIC is a manufacturing company, and the inventory turnover ratio that we calculated used all types of its inventory: finished goods, work in process, and raw materials. A more appropriate inventory turnover measure could be to use only the finished goods amounts, which could be done as BIC discloses the components of its inventory in Note 15-1. It would be interesting to see the impact of using just finished goods in this ratio, but for simplicity we will not recalculate the inventory turnover ratio here.
An inventory turnover ratio that is significantly different from that of others in the industry, or the company's in previous years, may be a warning sign. If the ratio is lower, it could indicate that the company is having trouble selling its inventory, or perhaps has obsolete inventory on hand that (similar to a low accounts receivable turnover) overstates the company's current ratio and levels of liquidity. If the inventory turnover ratio is too high, there is a risk the company's inventory level might be too low—it might be losing sales if it does not have enough items on hand to meet orders. Seasonal or unusual inventory transactions at the end of the year could also affect the inventory ratios. As with other ratios, we should consider both time-series and cross-sectional analysis of the inventory ratios.
Accounts Payable Turnover
The accounts payable turnover ratio is similar to the accounts receivable ratio, but provides information about the company's accounts payable policy. In its ideal form, it would be calculated as follows:

The problem with this calculation is that a company's credit purchases do not appear directly in the financial statements. An alternative formula sometimes used for this ratio is to use the cost of goods sold in place of credit purchases, because the cost of goods sold appears in the statement of earnings. If the level of inventories did not change dramatically during the period, this would be a good approximation.
However, the purchases can also be estimated by adjusting the cost of goods sold for the changes in inventory during the period. Recall from Chapter 7 that beginning inventory + cost of goods purchased − ending inventory = cost of goods sold. Rearranging this equation to solve for purchases gives the following:
Purchases = Cost of goods sold − Beginning inventory + Ending inventory
For BIC, the calculations are as follows:
ACCOUNTS PAYABLE TURNOVER AND DAYS TO PAY—SOCIÉTÉ BIC

When you interpret the activity ratios, remember that the turnover ratios and the “days to” ratios move in opposite directions. For example, a higher accounts receivable or inventory turnover ratio is normally good, because it indicates that the company is collecting receivables or selling inventory more quickly. However, an increase in the days to collect receivables or the days to sell inventory is normally bad, because it indicates a slowdown in those activities.
As with the accounts receivable, the accounts payable turnover ratio can be converted into a days to pay figure indicating, on average, how long it takes BIC to pay its payables. Also similar to the accounts receivable, the interpretation of the “days to pay” ratio depends on the credit terms. If the terms are 30 days, BIC appears to be taking significantly longer than this to pay; if the terms are 60 days, BIC appears to be paying too quickly. If a company is paying too quickly, it is not taking advantage of the fact that accounts payable normally do not charge interest and hence are “free” credit. However, if the company is paying too slowly, there may be interest charges for late payments. Again, cross-sectional and time-series analyses should be undertaken.
Another thing to consider is that for a manufacturing company many items other than purchases affect the cost of goods sold. For example, a manufacturing company such as BIC will probably include the amortization of its production equipment (which does not affect accounts payable) in the cost assigned to the inventory it produces. Therefore, the estimate of purchases will likely be overstated, and consequently the turnover ratio will be overstated. Also, as noted with the accounts receivable turnover ratio, we should only use accounts payable that arise from purchases and trade payables, and not other payable amounts that a company might have outstanding, such as interest payable. In BIC's case, the account title “trade and other payables” implies that other amounts are included. In BIC's case, we cannot really understand the payables ratios without knowing more details of the amounts that are included in the cost of goods sold and other payables.
Solvency Ratios
Solvency, or long-term liquidity, refers to the company's ability to pay its obligations in the long term (meaning more than one year into the future). A time-series analysis of the statement of cash flows and the patterns of cash flow over time should provide much of the insight you need to assess a company's abilities to pay its long-term debt. Two dimensions are used to assess solvency: (1) risk, based on the level of leverage in the company, and (2) coverage, based on the company's ability to meet its interest and debt payments. There are at least four ratios that are generally used in the assessment of long-term liquidity: the debt to equity ratio, the debt to total assets ratios, the times interest earned ratio, and the operating cash flow to total debt ratio. The first two of these are often referred to as leverage ratios, and the latter two as coverage ratios.
Leverage Ratios: Debt to Equity Ratio and Debt to Total Assets Ratio
From our earlier discussion about leverage, you know that leverage means a company uses debt to finance some of its assets and that the more leverage a company has, the riskier its situation is and the higher its fixed commitments to pay interest are. Comparing the amount of debt with the amount of equity in a company is important in assessing its ability to pay off these debts in the long term. There are different ratios that can be used to assess the extent to which a company is leveraged. We will use the two that have been introduced earlier in the book: debt to equity and debt to total assets.
The debt to equity ratio expresses the company's total debt as a percentage of its total shareholders' equity, and is calculated as follows:

BIC's debt to equity ratio follows:
DEBT TO EQUITY RATIO—SOCIÉTÉ BIC

The debt to equity ratio tells you that the amount of debt BIC uses in its financing has increased from 39% of the amount of its equity in 2008 to 56% in 2009. In other words, BIC's debt has increased to slightly more than half of its equity. Despite the increase in the use of debt, BIC still uses equity more than debt to finance its assets. If the ratio were equal to 1, it would indicate that equal amounts of debt and equity are used to finance assets.
The second ratio, debt to total assets, focuses on what portion of a company's assets is financed by debt. It is calculated as the ratio of the total liabilities to total assets (or total liabilities plus the shareholders' equity), as follows:

For BIC, this ratio is the following:
DEBT TO TOTAL ASSETS RATIO—SOCIÉTÉ BIC
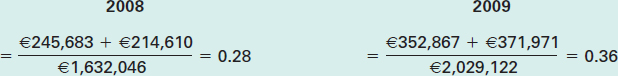
This ratio shows that for BIC the portion of its total assets financed by debt increased from 28% in 2008 to 36% in 2009—the same trend as the debt to equity ratio. A review of BIC's balance sheet indicates a large increase in non-current borrowings from 2008 to 2009 (from €11,078 to €161,466) and an increase in current borrowings (from €21,806 to €53,695). These increases, totalling €182,277, would explain the increase in both of the leverage ratios. Why has there been such a dramatic increase in the debt? Recall that BIC made acquisitions in 2009: a review of the notes to the financial statements indicates that the acquisitions were financed primarily by five-year loans. The increase in borrowings is a bit surprising, given the large amounts of cash and cash equivalents on hand that we identified in the analysis of short-term liquidity. BIC has more than enough cash on hand to pay off the long-term debt in full. Perhaps the company intends to use the funds in the near future for other projects or to pay dividends to shareholders. Having calculated these ratios, analysts would now try to find answers to the questions they raise. Ratio calculations are just the starting point for analysts when evaluating a company.
The two leverage ratios have portrayed similar messages to the user in different ways. Because of the variety of ways in which this information can be determined, you need to know exactly what formula was used so that you can appropriately interpret the results. Is the level of debt represented in these ratios appropriate for BIC? Again, a cross-sectional analysis could reveal whether the company has excessive debt compared with other companies. A time-series analysis could reveal the trend over time. As a general guide, however, the average corporate debt on the books of non-financial companies is somewhere between 45 percent and 50 percent of total assets. With a ratio of 36 percent in 2009, BIC is below that average—despite the increase from 2008.
Coverage Ratios: Times Interest Earned Ratio and Operating Cash Flow to Total Debt Ratio
In addition to determining the level of risk that a company is exposed to through its use of debt to finance its assets, users want to assess the company's ability to meet the interest and principal payments that arise from the debt obligations. Again we will use two ratios in our analysis, the times interest earned ratio and the operating cash flow to total debt ratio.
The times interest earned (TIE) ratio compares the amount of earnings available to pay interest to the level of interest expense. Because interest is tax-deductible, the earnings available to pay interest would be the earnings prior to the payment of interest and taxes. The easiest way to find the earnings before interest and taxes is to start with the net earnings amount and add the income taxes and interest expense to it. One complication in the calculation of this ratio is that companies capitalize interest when they construct long-term assets to use in operations. This means that instead of expensing interest, a company can record the interest in an asset account. This generally happens only when a company is constructing an asset and incurs interest on money borrowed to finance the construction. In such cases, the adjustment to the ratio is that the amount of interest capitalized should be added to the denominator. The ratio is therefore calculated as follows:

In the notes to the financial statements, BIC does not say anything about capitalizing interest on assets constructed over time. We therefore do not need to adjust the denominator. Earlier in the chapter, when calculating the ROA for BIC, we used Note 6 to determine what portion of the finance costs on the income statement is interest expense. The ratio for BIC is therefore calculated as follows:
TIMES INTEREST EARNED—SOCIÉTÉ BIC

Included in BIC's group net income is income from associates: investments that BIC has in other companies that allow it to influence the companies' operations but not control the companies (discussed in Appendix B). Our objective, however, is to determine the available earnings to pay interest expense, which are found higher up in the income statement. We could have started with group net income and then added back the income from associates, but it is easier to start with BIC's net income from consolidated entities. In fact, because BIC discloses income before tax separately on its income statement, we could also have just started there and not had to add back the income tax expense. Different companies choose to disclose different amounts of detail at the bottom of the statement of earnings. To be consistent with the definition given, we used a net income figure as a starting point, but as your experience and confidence in reading and interpreting financial statements grow you may find different ways to get to the same amount.
BIC's times interest earned ratios are very comfortable, despite the decrease from 33.1 in 2008 to 25.2 in 2009. The 25.2 indicates that BIC could pay its interest costs 25 times from its available earnings. This ratio helps potential lenders assess the margin of safety as it answers the question of whether the company will likely be able to meet its interest obligations. As a lender, a low times interest earned ratio would be a concern. While BIC's ratio did decline, it would only become a concern to lenders if it continued to decline by the same amount over several years. As it is, the results are consistent with the leverage ratios we examined earlier. BIC has taken on more long-term debt, so a user would expect that increase to cause an increase in interest payments and a decrease in the times interest earned ratio. Since earnings would have to drop to 1/25 of their current level for the company to have trouble paying its interest expense, lenders would see the current TIE ratio as a very positive indicator of BIC's solvency.
The second coverage ratio and final one in this solvency section is the operating cash flow to total debt ratio. This ratio measures the company's ability to cover its total debt with the annual operating cash flow. Like the operating cash flow to short-term debt, the higher this ratio, the stronger the indication of the company's ability to generate cash and pay its debt. The ratio is calculated as follows:

This ratio is broader than the previous operating cash flow ratio, which included only short-term debt. Because not all of the debt will need to be paid at once, this ratio can safely be less than 1.
For BIC, the ratio is as follows:
OPERATING CASH FLOW TO TOTAL DEBT—SOCIÉTÉ BIC

In the calculation of this ratio, we have assumed that BIC's total debt is the same as its total liabilities. Some analysts might prefer to focus strictly on the borrowing liabilities, such as long-term debt, and not include such items as warranty provisions, which may be satisfied by providing products or services as opposed to cash. The use of total liabilities is a more conservative approach, and results in a more stringent assessment of a company's solvency.
Operating cash flow increased from 2008 to 2009, but as we have noted, total liabilities also increased over the same period. The decrease in the ratio therefore is very small, from 0.49 to 0.47. What this ratio tells us is that almost half of BIC's total liabilities could be paid off with the current levels of operating cash flow.
Another way of looking at this ratio is to determine how many years of operating cash flow at the current level would be required to pay off the total debt. In 2009, the ratio of 0.47 could be converted into 2.11 years, by inverting the ratio (€724,838/€343,140). In other words, with the current level of operating cash flow, it would take the company just over two years to generate enough cash to pay off all the debt existing in 2009. Remember that some of the debt must be paid off in the following year and the rest over several years, depending on the maturity dates associated with the debt. You would need to read the notes associated with the long-term debt to determine if the current level of operating cash flow will be sufficient for the company's future cash needs. All of BIC's long-term debt is repayable in instalments over the next five years, which means that with an operating cash flow to total debt ratio of 0.47 the company is relatively comfortable in its ability to repay its debt from operating cash flows.
Investors use different ratios to screen investments for different factors they are interested in. The Accounting in the News story above explains how Warren Buffet uses ratios, including some we have talked about, to screen potential investments. Warren Buffett is an American investor, and the primary shareholder and CEO of Berkshire Hathaway, based in Omaha, Nebraska. He is sometimes referred to as the “Oracle of Omaha.” Through Berkshire Hathaway, a company with a market capitalization of more than US$200 billion, he follows a philosophy of value investing and holds investments in a large number of diverse companies, including The Coca-Cola Company, GEICO Insurance, The Washington Post, and Wells Fargo.
LEARNING OBJECTIVE 5
Calculate and explain the uses of the earnings per share ratio and the price/earnings ratio.
Equity Analysis Ratios
Equity analysts are interested in the long-term risk and return of the company, as measured by many of the ratios discussed so far. But equity analysts and investors are uniquely interested in the relative value of the company's shares. They use valuation techniques that you will learn about in finance courses to value a share, or an entire company, and compare those values to current market prices to determine if the company is an attractive investment. There are two ratios related to the financial statements that are used in their analysis, the earnings per share ratio and the price-earnings multiple.
Basic Earnings Per Share
The basic earnings per share ratio is quoted quite often in the financial press and is of great interest to shareholders. Introduced in Chapter 4 in its simplest form, it is the company's net earnings divided by the weighted average number of common shares outstanding. Although this ratio may be of some help in analyzing a company's results, its usefulness is limited. The major problem with using it as a measure of performance is that it ignores the level of investment. Companies with the same earnings per share might have very different rates of return, depending on their investment in net assets. The other limitation is that the shares of different companies are not equivalent, and companies with the same overall level of profit may have different earnings per share figures because they have a different number of shares outstanding. For these reasons, the best use of the earnings per share figure is in a time-series analysis rather than in a cross-sectional analysis.
accounting in the news
Buying Like Buffett

Everyone would like to know what Warren Buffett's next acquisition might be. The Oracle of Omaha makes no secret about what Berkshire Hathaway Inc. is looking for. Companies interested in having Mr. Buffett as a partner have to be large, with at least US$75 million in pre-tax earnings, demonstrated consistent earning power, good returns on equity, little or no debt, and a simple business. Considering the essential ingredients that catch Berkshire Hathaway's attention, the Financial Post sifted through the 3,261 companies included in the Google Finance stock screener to find those that might be attractive to Mr. Buffett and Berkshire. The criteria included financial health, steady growth, and consistent profitability.
The first criterion—a market capitalization of at least US$5 billion—weeded out the bulk, leaving 620 names. The criteria then applied included a return on equity of at least 8% over the past five years, a net profit margin of at least 10%, a five-year earnings per share growth of at least 10%, total debt of no more than 20% of equity, and a current ratio of at least 2.5. After the final two criteria regarding price—shares trading at no more than 1.5 times book value and twice sales per share—were applied, the screener provided one name, that of J.M. Smucker & Co. Based in Orrville, Ohio, and operating in Canada as Smucker Foods. The company began as an apple cider mill in 1897 and now makes jam, peanut butter, coffee, shortening and oils, canned milk, and baking mixes. Through a combination of expansion and acquisition, it holds the leading U.S. market share in seven food categories. The company's current ratio is a strong 3.74, debt is a modest 16% of assets, while the company's operating margin is a healthy 18.3%. Finally, the shares themselves trade at just 13.3 times trailing earnings, 1.34 times book value, and 1.57 times sales per share.
Smucker's relatively simple business, combined with its long history of steady growth and profitability, makes it attractive, but as Mr. Buffett has said, past performance is no indication of future profitability. As Mr. Buffett has also said, “If past history was all there was to the game, the richest people would be librarians.”
Source: Richard Morrison, “What Would Warren Buffett Buy?” Financial Post, September 11, 2010, http://www.financialpost.com/What+would+Warren+Buffett/3510564/story.html
Basic earnings per share is usually a very simple number that considers only the net earnings, preferred dividends, and weighted average number of common shares outstanding. Every published financial statement shows this figure.
The earnings per share calculation represents the earnings per common share. Therefore, if the company also issues preferred shares, the effects of the preferred shares must be removed in calculating the ratio. Similar to ROE, any dividends that are paid to preferred shareholders should be deducted from net earnings because that amount of earnings is not available to common shareholders. The number of preferred shares outstanding should also be left out of the denominator. The calculation of basic earnings per share then becomes the following:

The preferred dividends that should be deducted are the cumulative preferred dividends for the year, whether they are declared in the year or not, and any non-cumulative preferred dividends that have been declared in the year. As Chapter 11 stated, cumulative means that if a dividend is not declared on the preferred shares in one year, the dividends then carry over into the next year. In the second year, both the prior year's preferred dividends and the current year's preferred dividends must be declared before any common dividends can be declared.
Note in Exhibit 12-3B on the income statement for BIC that there is a basic earnings per share of €3.15 in 2009. If BIC had discontinued some of its operations during the year, there would have been earnings per share amounts on the statement of earnings both before the discontinued operations and after. The reason for multiple amounts is that the company would have removed this amount from the normal continuing operations and shown it separately. When users review the financial statements, it is usually with two objectives in mind: first, to see how the company did during the past year, and second, to assess how it might do in the future. Because of this focus on the future, it is important for companies to isolate discontinued operations from continuing operations as only the latter are a good indicator of future operations.
Diluted Earnings Per Share
In addition to preferred shares, another complicating factor in the calculation of earnings per share arises when the company issues securities that are convertible into common shares. Examples of these types of securities are convertible debt, convertible preferred shares, and stock options. The key feature of these securities is that they are all convertible into common shares under certain conditions. If additional common shares are issued upon their conversion, the earnings per share number could decrease because of the larger number of shares that would be outstanding. This is called the potential dilution of earnings per share.
At the end of a given accounting period, the presence of convertible securities creates some uncertainty about how to report the earnings per share number. Should the company report the earnings per share without considering the potentially dilutive effects of the convertible securities, or should it disclose some information that would allow readers of the financial statements to understand these effects? To provide the best information for users of financial statements, we should disclose information about the dilutive effects of convertible securities.
Diluted earnings per share is calculated assuming the worst-case scenario. This means that the company identifies all the dilutive securities that will have a negative effect on the earnings per share amount if they are converted. For example, if convertible preferred shares are converted to common shares, the number of common shares outstanding will increase, increasing the size of the denominator in the calculation. At the same time, the numerator (net earnings − preferred dividends) will also increase: if the preferred shares are now common shares, there will no longer be any preferred dividends, so all the net earnings will be available to the common shareholders. Because both the numerator and the denominator increase, the effect of a conversion on earnings per share is not always negative. Under the worst-case scenario for determining diluted earnings per share, the calculation includes only those conversions that would have a negative effect on earnings per share. The calculation of diluted earnings per share is a heads-up calculation for users. It attempts to tell them how much the earnings per share could decline in the future, if all the dilutive convertible securities were converted to common shares.
The calculation of diluted earnings per share is complex, and beyond the scope of an introductory text. At this stage, the important thing is that you understand what the amount of diluted earnings per share represents.
BIC has stock options and performance shares that are dilutive. Performance shares are shares that will be granted if certain performance objectives are met by executives. As a result of these items, in 2009, the company reported a diluted earnings per share amount of €3.14 (compared with the basic earnings per share of €3.15). If the company had discontinued operations, it would have disclosed a diluted earnings per share from continuing operations and from net earnings, for the reasons mentioned earlier. For BIC, stock options and performance shares have caused the diluted earnings per share amounts to be lower than the basic earnings per share amounts. However, the decline from €3.15 to €3.14 is not a very significant drop. Shareholders should not be very concerned about the potential future conversion of the stock options and performance shares to common shares, because they will have only a small negative effect on the earnings per common share.
In sum, financial statements may include several earnings per share figures, the main ones being the basic earnings per share and the diluted earnings per share. You will often find the earnings per share figures at the bottom of the statement of earnings.
Price/Earnings Ratio
The price/earnings ratio, or multiple, was introduced in Chapter 11 and compares the price per share on the stock market with the company's earnings per share. Calculated as the market price of a share divided by the current earnings per share, this ratio is thought of by many analysts as the amount that investors are willing to pay for a dollar's worth of earnings. The interpretation of this ratio is somewhat difficult because stock market price levels are affected by many factors and are not well understood. It might help to think of the multiple in terms of its inverse. If a company is earning $1 per common share and its shares are selling for $20 on the stock market, this indicates that the current multiple is 20 (i.e., the current price of the stock is 20 times the current earnings per share). The inverse of this multiple is 1/20, or 5%. This indicates that the shares are returning 5% in the form of earnings per share when compared with the market price.
On December 31, 2009, the company's year end, BIC's common shares were trading on the Euronext Paris Exchange at approximately €48.30 per share. Its price/earnings ratio at that date would therefore have been 15.3 (€48.30/€3.15). The other way of considering its earnings in relation to its share price is to consider the inverse. The company earned €3.15 on shares that were trading at €48.30, which is a return of 6.5%.
Remember that the earnings per share is the portion of the earnings that is attributable to an individual share: it is not the amount that the company normally pays out as a dividend to each shareholder. A shareholder earns a return from both receiving dividends and from the change in the price of the share. Therefore, the return calculated from the price multiple may differ from the return actually earned. Many factors affect the level of stock market prices, including the prevailing interest rates and the company's future prospects. It is sometimes useful to think that the market price reflects the present value of all of the company's future expected earnings. Companies with a low growth potential or higher levels of risk tend to have lower price/earnings ratios, because investors are not willing to pay as much per dollar of earnings if the earnings are not expected to grow much or are more risky. Conversely, companies with high growth potential or lower levels of risk tend to have higher price/earnings ratios. Many factors ultimately affect the price/earnings ratio, but the earnings per share figure serves as an important link between the accounting numbers produced in the financial statements and the stock market price of the company's shares.
LEARNING OBJECTIVE 6
Understand the differences that might affect the ratio analysis of non-manufacturing or non-retail companies.
NON-MANUFACTURING OR NON-RETAIL COMPANY ANALYSIS
Although the discussion in this chapter applies to most companies in most industries, some differences for non-manufacturing or non-retail companies should be noted. As an example of a non-manufacturing or non-retail company, consider the analysis of a financial services company such as a bank, an insurance company, or a finance company. These companies invest in very different kinds of assets than manufacturers or retailers, and they obtain their financing from different sources. The assets of financial services companies consist of almost no inventories and relatively little property, plant, and equipment. The majority of their assets are loans that they have made to their customers, or other investments. The assets of most non-financial companies consist mainly of property, plant, and equipment, inventories, and receivables.
The liability sections of financial services companies' statements of financial position are also very different from those of manufacturers or retailers. The first major difference is the debt to equity ratio. Financial services companies tend to have considerably higher debt to equity ratios than manufacturers or retailers because of the large amounts of cash received from depositors. The cash you put on deposit in a bank, an asset to you, is a liability to the bank. In the insurance industry, the high ratio results from amounts owed to policy holders. Second, the liabilities of financial services companies such as banks tend to be predominantly short-term in nature because of the deposits received from customers, which are normally payable on demand. Many customers, however, leave amounts with these companies for long periods of time. This means that, although they are technically short-term because the customer can withdraw the funds at any time, in reality they are often long-term in nature.
The higher leverage employed by financial services companies reflects, in part, the lower risk of the types of assets that they invest in. In addition to employing financial leverage, manufacturers also use something called operating leverage. Operating leverage involves investing in large amounts of property, plant, and equipment (capital assets with fixed depreciation costs). The property, plant, and equipment allow manufacturers to make their own inventory rather than buying finished goods from outside suppliers. When goods are purchased from suppliers the costs are essentially variable costs and if the sales fall costs can be easily reduced. However, when companies produce their own goods and use large amounts of capital assets, the production costs consist more of fixed costs, costs that do not change when the volume of production changes. The risk is that the manufacturers must operate at a sufficient volume for their profit from the sale of goods to cover their fixed costs. At large volumes, this makes manufacturing companies very profitable, but at low volumes, they generate large losses because the fixed costs cannot be covered at lower sales volumes. Partially because of the amount of operating leverage, lenders generally do not lend as much to manufacturers as they lend to financial services companies.
A complete analysis of financial services companies is beyond the scope of this book. However, it is hoped that this brief discussion of some of the differences between these companies and manufacturers and retailers will provide some insight into how an analysis of these companies may differ.
LEARNING OBJECTIVE 7
Understand the need to exercise caution when interpreting ratios.
INTERPRETING THE RATIOS
A final word of caution is necessary when interpreting the ratios you have calculated. The real value of a good analysis is in the interpretation, not merely the calculation, of the ratios. When interpreting ratios, you should be careful to say more than whether the ratio increased or decreased. It is necessary to interpret the change. As we have seen, some ratios are better when they increase, like the return ratios, while for other ratios an increase might indicate a worsening of a position. It may also be possible for a small increase in a ratio to indicate improvement, but too large an increase to indicate a concern. For example, a small increase in the debt to equity ratio may indicate an improved use of leverage; but if the ratio gets too big it might indicate that the firm is over-leveraged and becoming too risky. Similarly, an increase in the current ratio may indicate improved liquidity; but if it is too high there might be problems with too much inventory on hand, or collecting accounts receivable.
HELPFUL HINT
When commenting on ratios and trends, be sure to use evaluative or interpretative terms. Do not simply make superficial, mathematical observations; show that you understand what the figures mean. For example, do not simply say that a ratio or percentage is higher/lower or increasing/decreasing. Instead, try to use terms such as stronger/weaker, better/worse, improving/deteriorating, when you describe the numeric results.
You should also be careful not to draw conclusions too easily from limited amounts of data. In this chapter—due to time and space constraints—we were limited to only two years of ratios for BIC and no cross-sectional comparisons with other companies or the industry. Looking at longer time-series and cross-sectional comparisons with other companies or industry data would greatly improve the analysis.
Bear in mind that ratios are sometimes referred to as red flags, meaning that they can indicate areas that require further investigation or analysis, but they do not explain the change. For example, a decrease in inventory turnover does not explain why inventory turnover slowed down. In a complete analysis of our sample company, SOCIÉTÉ BIC, an analyst would seek more information and discussion with management before making any decisions.
SUMMARY
At this point in the book, we have discussed all the major financial statements and specific accounting methods and principles that apply to each category within the asset, liability, and shareholders' equity sections of the statement of financial position. We have devoted this final chapter to methods you can use to gain some insight into how to interpret the information that you find reported on the financial statements. By comparing amounts on one financial statement with related amounts on another financial statement, we are able to assess the impact of various items on a company's health and future prospects. We restricted the discussion to fairly simple companies to make it easier for you to learn the basics.
In Appendix B at the back of the book, you will find additional information about more complex organizations. These are companies (usually called parent companies) that buy an interest in other companies (called subsidiaries) to obtain control of the subsidiaries' resources. The majority of the real companies reported in this book are parent companies that have subsidiaries. A company is a parent company if it prepares consolidated (or group) financial statements. If you look back through the examples of financial statements that we showed you in the book, you will see that most of them are consolidated (or group) statements. Complex issues arise in accounting for parent companies, such as how to represent the resources controlled by their shareholders.
Ratio Summary
Exhibit 12-9 summarizes the ratios that were developed in the chapter.


Additional Practice Problems
The statements of earnings and retained earnings, cash flow statements, and balance sheets of Le Château Inc. are shown in Exhibit 12-10. As you will recall from earlier chapters, Le Château is a major, Montreal-based Canadian retailer of men's and women's clothing, footwear, and accessories. Calculate the following ratios for the year ending January 30, 2010, based on the data in the financial statements. Comment on what the ratios tell us about the financial position of Le Château and what further analyses you should undertake. Note that the financial statements are from the 2009 annual report but the fiscal year end for the company is January 30, 2010. Therefore, when reading the 2009 annual report, you will be calculating the ratios based on the 2010 column. With a January year end, the figures include 11 months of 2009—hence the title as the 2009 annual report.
EXHIBIT 12-10A LE CHÂTEAU INC. 2009 ANNUAL REPORT
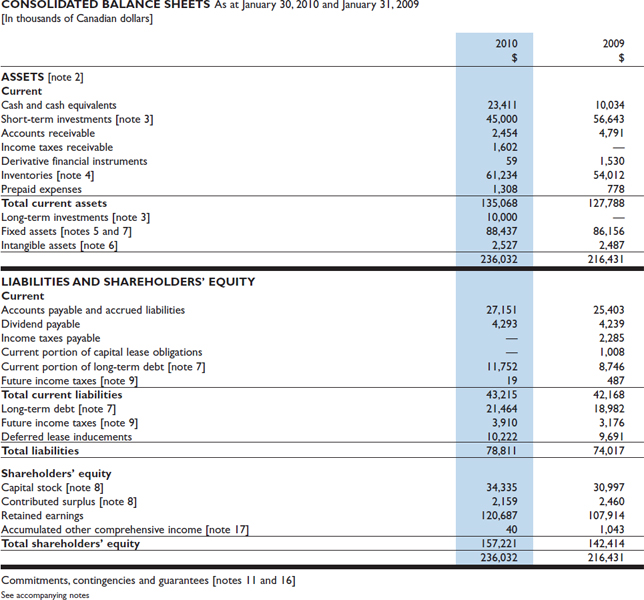
EXHIBIT 12-10B LE CHÂTEAU INC. 2009 ANNUAL REPORT

EXHIBIT 12-10C LE CHÂTEAU INC. 2009 ANNUAL REPORT

Profitability Ratios:
- a. Net profit margin
- b. Gross profit margin
- c. ROA (broken down into the profit margin ratio and total asset turnover, using 31% for the tax rate)
- d. ROE
Short-Term Liquidity Ratios:
- e. Current ratio
- f. Quick ratio
- g. Operating cash flow to short-term debt ratio
Activity Ratios:
- h. Accounts receivable turnover
- i. Inventory turnover
- j. Accounts payable turnover
Solvency Ratios:
- k. Debt to equity ratio
- l. Debt to total assets ratio
- m. Times interest earned ratio
- n. Operating cash flow to total debt ratio
LEARNING OBJECTIVE 8
Use ratios to assess a company's financial health through an analysis of its performance and financial position.
 Make a copy of the financial statements from Le Château and lay them out so that you can move easily between them without having to flip through the pages of the book. Next, open your textbook to the Ratio Summary (Exhibit 12-9) so that you have the formulae for the ratios close to you.
- Calculate each ratio by following the formula and finding the amounts on the financial statements.
- The comments on the ratios are the hardest part, because one ratio by itself tells you very little. Refer back to the discussion in your notes, or in the text, regarding what each ratio indicates, and then try to put in words what your calculated ratio amounts mean. The comments about BIC in the body of the chapter can also be used as guides on how to interpret the amounts you have calculated.
SUGGESTED SOLUTION TO PRACTICE PROBLEM
Ratios for Le Château Inc., for the year ending January 30, 2010:
(Amounts used in the ratios are in thousands of dollars.)
- Net profit margin

- Gross profit margin

- Return on assets

- Return on equity

HELPFUL HINT
Note that the ROE is larger than the ROA. As soon as you see this, you know that the company is using leverage.
- Current ratio

- Quick ratio

- Operating cash flow to short-term debt ratio

- Accounts receivable turnover
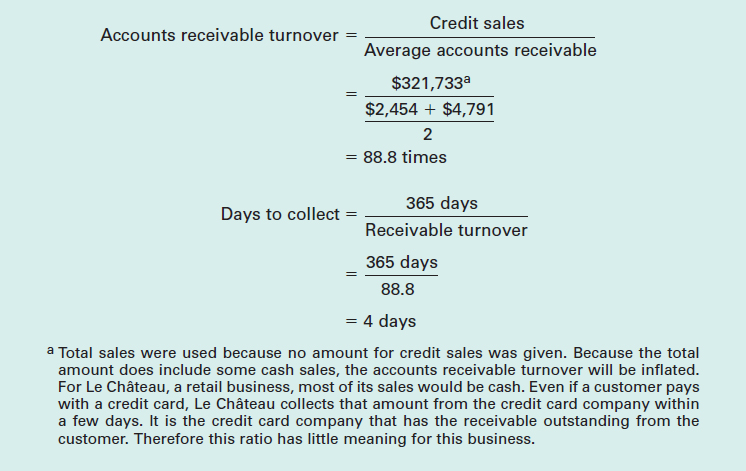
- Inventory turnover

- Accounts payable turnover
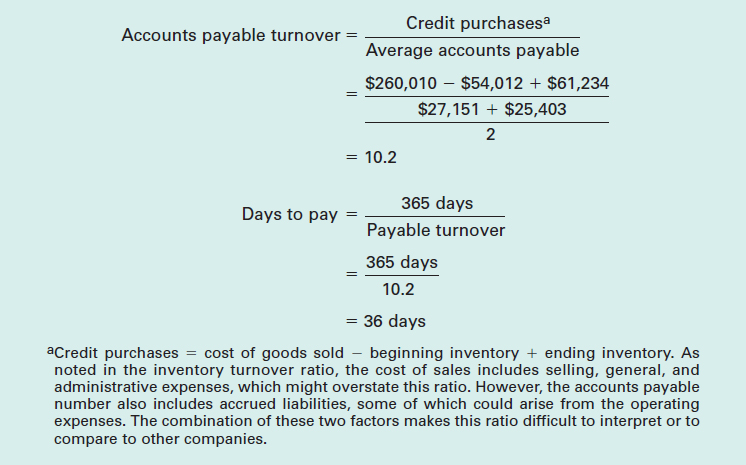
- Debt to equity

- Debt to total assets

- Times interest earned

- Operating cash flow to total debt

Profitability Ratios
In analyzing the performance of any company, first consider the net earnings and its trend. For Le Château, the net earnings amount is positive but lower than in 2009. On reviewing the statement of earnings, both sales and net earnings decreased from 2009 to 2010, a result of the difficult retail environment during the economic slowdown of the period. Net earnings decreased by more than sales (22% vs. 7%). The net profit margin of 9.3% is therefore likely lower than in 2009.
Next, consider the ROA and ROE ratios. Despite the drop in earnings, ROA and ROE appear to be good. ROA is 13.6% and the ROE is 19.9%. The ROE of 19.9% is significantly larger than the ROA and indicates that the company is using leverage effectively. From the breakdown in the ROA calculation, the strong performance by Le Château can be attributed to its profit margin (9.6%), and not its asset turnover (1.42 times). With a gross profit margin (after selling, general, and administrative expenses) of 19.2%, Le Château appears to have a reasonable markup on its merchandise, but comparing the results of previous years and competitors would be useful.
Further analyses would include common size financial statements to determine the trends in the cost of goods sold and other expenses (shown in Exhibit 12-11), and trend analyses of the ROA and ROE.
Common Size Income Statement

These common size statements show that, as expected, the net profit margin declined in 2010. Cost of sales and general expenses increased by 2.4% and total expenses by 3.4%, but lower income taxes resulted in the net profit margin decreasing by less than 2.0%. These common size earnings statements indicate some concern about the company's profitability compared to the previous year. If many of the costs are fixed, and if sales recover in 2011, profitability should improve as well; if sales do not recover, or 2010 reflects new rising costs, then profitability may continue at this lower level in the future.
Short-Term Liquidity Ratios
The current ratio is high at 3.13. The difference between the current ratio and the quick ratio of 1.68 indicates that the company has about half of its current assets tied up in inventory, which would be reasonable for a retailer. The high level of both the current ratio and the quick ratio shows that Le Château has a good liquidity position and will be able it to pay its liabilities as they come due. The cash flow from operations on the cash flow statement is positive and significantly larger than the net earnings amount. This, combined with the fact that the company's sales are primarily cash, provides evidence that the company does not have a cash flow problem. The operating cash flow to short-term debt ratio at 3.5 shows that the company generates enough cash from operations to settle short-term debt. Overall liquidity appears strong for Le Château, despite the decrease in sales and net earnings.
Activity Ratios
The turnover figures are interesting and some may be distorted. As a retailer, Le Château sells primarily for cash, which is confirmed in the accounts receivable turnover of 88.8 times, indicating there are only 4 days of sales in accounts receivable. In calculating the ratio, we were not able to use credit sales, because that amount was not disclosed. Most likely only a very small portion of sales are on credit. Using the total sales amount to calculate this ratio has obviously affected the turnover rate; by how much, we cannot determine. The inventory turnover of 4.5 times indicates that there is enough inventory on hand to cover 81 days of sales. In the retail fashion business, there are normally four selling seasons, and Le Château's turnover appears to indicate that inventory is sold once per season. This is likely similar to other fashion retailers.
The accounts payable turnover of 10.2 times indicates that the company pays its suppliers an average of 36 days after incurring the obligation. However, this ratio is obviously distorted by the inclusion of accrued liabilities in the denominator and the cost of sales and selling, general, and administrative expenses in the numerator. As there are more items included than just the amounts owed to suppliers of inventory, this ratio is impossible to interpret.
Solvency Ratios
Le Chateau Inc.'s debt to equity ratio is 50%, indicating that total debt is half of equity or, as the debt to total assets ratio indicates, the company is approximately one-third financed by debt, and two-thirds by equity. Looking at the balance sheet, you can see that approximately one-third of total liabilities are accounts payable. Large payables would be expected in a company with large amounts of inventory, such as Le Château. As noted in the discussion of the profitability ratios, Le Château has been able to make good use of leverage to increase its ROE above its ROA. Should Le Château increase its leverage more? High debt/equity ratios require a stable market for the products sold. With the fall in sales and earnings that the company has experienced in the past year, it is unlikely that an increase in leverage would be viewed favourably by the lending or equity markets. The company needs to maintain flexibility in case sales are slow to recover to previous levels. Le Château is probably not looking to increase its leverage, and with the strong short-term liquidity position noted earlier could even reduce its leverage if necessary.
The times interest earned ratio of 29.8 indicates that Le Château can pay its interest expense almost 30 times from its earnings before interest; this is a very strong position. The operating cash flow to total debt ratio of 0.53 indicates that the company could repay its entire debt in two years from operating cash flows. The high times interest earned ratio plus the strong operating cash flow to total debt ratio indicate that the current level of debt in the company is not a problem for Le Château; it is in a good position to pay its interest and meet its total debt obligations.
Interesting information can be found in the cash flow statement. In 2010, the cash inflow from operating activities was positive and did not decrease from 2009, even though net earnings decreased. Cash is being used to invest in property and equipment, and long-term investments, which is also a good sign. The company has both repaid long-term debt and been able to raise money from new debt. Le Château consistently pays large dividends. As an investor, if you were looking for an investment that would pay you periodically in the form of dividends, Le Château may be a good choice.
In conclusion, Le Chateau's sales and net earnings fell in 2010 compared to 2009, likely as a result of the economic slowdown. But the company has strong short-term liquidity and good solvency; it continues to pay dividends and appears to be well situated to weather the slowdown. Le Chateau's profitability in 2011 will be a key indicator of the company's future potential. Will sales recover and costs return to historical lower levels?
ABBREVIATIONS USED
| EPS | Earnings per share |
| P/E ratio | Price/earnings ratio |
| ROA | Return on assets |
| ROE | Return on equity |
| TIE | Times interest earned |
GLOSSARY
Accounts payable turnover The number of times that accounts payable are replaced during the accounting period. It is usually calculated as the credit purchases divided by the average accounts payable.
Accounts receivable turnover The number of times that accounts receivable are replaced during the accounting period. It is calculated as the credit sales divided by the average accounts receivable.
Basic earnings per share A measure of a company's performance, calculated by dividing the earnings for the period that are available to common shareholders by the weighted average number of common shares that were outstanding during the period.
Common size data Data that are prepared from the financial statements and which express each element of the statement as a percentage of a denominator value. On the statement of earnings, the denominator value is usually the net sales revenues. On the statement of financial position, the denominator is total assets.
Cross-sectional analysis A type of financial statement analysis in which one company is compared with other companies, either within the same industry or across industries, for the same time period.
Current ratio A measure of a company's short-term liquidity. It is measured as the ratio of the company's current assets divided by the current liabilities.
Debt to equity ratio A measure of a company's leverage. There are numerous definitions of this ratio, but the one used in this chapter is total liabilities divided by total equity.
Debt to total assets A measure of a company's leverage calculated as total liabilities divided by total assets.
Diluted earnings per share A type of earnings per share calculation whose purpose is to provide the lowest possible earnings per share figure under the assumption that all the company's convertible securities and options have been converted into common shares. It measures the maximum potential dilution in earnings per share that would occur under these assumed conversions.
Gross profit margin A profitability ratio that compares the gross profit to a company's sales. It measures what portion of each sales dollar is available to cover other expenses after covering the cost of goods sold.
Inventory turnover The number of times that inventory is replaced during the accounting period. It is calculated as the cost of goods sold divided by the average inventory.
Leverage A company's use of debt to improve the return to shareholders.
Net profit margin A profitability measure that compares a company's net earnings to its total revenues. It measures what portion of each sales dollar is left after covering all the expenses.
Operating cash flow to short-term debt ratio A short-term liquidity ratio that measures a company's ability to cover its short-term debt with the cash flow generated from operations.
Operating cash flow to total debt ratio A long-term liquidity ratio that measures a company's ability to cover all its debt with the cash flow generated from operations.
Operating leverage The replacement of variable costs with fixed costs in the operation of the company. If a sufficient volume of sales is achieved, the investment in fixed costs can be very profitable.
Optimal capital structure A theoretical point at which the company's leverage maximizes the return to the shareholders.
Price/earnings (P/E) ratio A performance ratio that compares the market price per share with the earnings per share.
Profit margin ratio A profitability measure that compares a company's after-tax but before-interest income with its revenues, used when calculating ROA.
Prospective analysis A financial statement analysis of a company that attempts to look forward in time to predict future results.
Quick ratio A measure of a company's short-term liquidity, calculated by dividing the current assets less inventories and, in most cases, prepaid items by the current liabilities.
Raw financial data The data that appear directly in the financial statements.
Retrospective analysis A financial statement analysis of a company that looks only at historical data.
Return on assets (ROA) A measure of profitability that measures the return on the investment in assets. It is calculated by dividing the earnings after tax but before interest by the average total assets during the accounting period. The ROA ratio can be split into the profit margin ratio and the total asset turnover ratio.
Return on equity (ROE) A measure of profitability that measures the return on the investment made by common shareholders. It is calculated by dividing the net earnings less dividends for preferred shares by the average common shareholders' equity during the accounting period.
Time-series analysis A type of financial statement analysis in which data are analyzed over time.
Times interest earned (TIE) ratio A measure of a company's long-term liquidity. It measures the company's ability to make its interest payments. It is calculated by dividing the earnings before interest and taxes by the interest expense.
Total asset turnover ratio A measure of company performance that shows the number of dollars of sales that is generated per dollar of investment in total assets. It is calculated by dividing the sales revenue by the average total assets for the accounting period.
Working capital The difference between current assets and current liabilities. It is a function of the company's management of the cash cycle and a component of short-term liquidity.
ASSIGNMENT MATERIAL
Assessing Your Recall
12-1 Explain why knowledge of a business is important when using ratio analysis. What aspects of the business should you learn more about?
12-2 Describe the information that a user can get from reading the auditors' report.
12-3 Would an investor find retrospective analysis or prospective analysis more useful in making investment decisions? Why is the other technique used?
12-4 Compare and contrast time-series analysis and cross-sectional analysis.
12-5 Identify the four main types of ratios used in this chapter to analyze a company. What does each group of ratios attempt to measure?
12-6 Write the formula for calculating each of the following ratios:
- Net profit margin
- Gross profit margin
- ROA (broken down into the profit margin percentage and total asset turnover rate)
- ROE
- Accounts receivable turnover
- Inventory turnover
- Accounts payable turnover
- Current ratio
- Quick ratio
- Operating cash flow to short-term debt ratio
- Debt to equity ratio
- Debt to total assets
- Times interest earned ratio
- Operating cash flow to total debt ratio
12-7 Explain how the accounts receivable and inventory turnover ratios can be useful in assessing a company's liquidity.
12-8 Why are ratios that use cash flows useful under accrual-based accounting?
12-9 Describe leverage, and explain how it is shown in the ROA and ROE ratios.
12-10 Explain, using the profit margin and total asset turnover ratios, how two companies in the same business (use retail clothing stores as an example) can earn the same ROA, yet have very different operating strategies.
12-11 Explain what an analyst might determine from preparing a common size statement of earnings.
12-12 Explain how the current ratio can be manipulated as a measure of liquidity.
12-13 Describe how earnings per share is calculated, and discuss the purpose of producing basic and diluted earnings per share ratios for a company.
12-14 What kinds of analysts are interested in the P/E ratio? Explain why the P/E ratios for two companies in the same industry might be different.
Applying Your Knowledge
12-15 (Common size analysis and differences in profitability)
Comparative financial statement data for First Company and Foremost Company, two competitors, follow:

- Prepare a common size analysis of the 2010 statement of earnings data for First Company and Foremost Company.
- Calculate the return on assets and the return on shareholders' equity for both companies. For the ROA, break it down into its two component ratios.
- Comment on the relative profitability of these companies.
- Identify two main reasons for the difference in their profitability.
12-16 (Common size analysis and differences in profitability and leverage)
Comparative financial statement data for Cool Brewery Company and Northern Beer Company, two competitors, follow (amounts in thousands):

Required:
- Prepare a common size analysis for 2008 for Cool Brewery Company and Northern Beer Company.
- Calculate the return on assets and the return on shareholders' equity for both companies. For the ROA, break it down into its two component ratios.
- Comment on the relative profitability of these companies.
- Identify two main reasons for the difference in their profitability.
- Calculate the debt to equity ratio for both companies.
- Compare the use of leverage by these companies.
12-17 (General financial statement analysis)
The following is an abbreviated balance sheet for Grizzly Grocers:
Grizzly Grocers Ltd.
Statement of Financial Position
As at December 31, 2010

The company had net earnings of $20,000 on sales of $180,000.
- Calculate Grizzly Grocers' current ratio.
- Calculate the company's debt to equity ratio.
- Calculate the company's working capital.
- Calculate the company's net profit margin.
- Assuming that you have just learned that a credit sale of $10,000 that was included in the sales amount actually occurred three days after the end of the fiscal year, revise the statement of financial position and sales amount to correct this error. Recalculate the ratios in parts “a” to “d.”
12-18 (Liquidity ratios)
The financial data for Alouette Resources are as follows (amounts in thousands):

Required:
- Calculate the current and quick ratios for 2009 through 2012.
- Comment on the short-term liquidity position of Alouette Resources.
- Which ratio do you think is the better measure of short-term liquidity for Alouette Resources? Can you tell? Explain. What would your answer depend on?
12-19 (Accounts receivable turnover)
The Super Gym Company Limited sells fitness equipment to retail outlets and fitness centres. The majority of these sales are on credit. The financial data related to accounts receivable over the last three years are as follows:

Required:
- Calculate the accounts receivable turnover for each year. For 2009, use the accounts receivable in 2009. For the other two years, use the average accounts receivable.
- Calculate the average number of days required to collect the receivables in each year.
- As a user of this information, describe what trends you see. What additional information would you like to have to help you understand the trends?
12-20 (Accounts receivable turnover)
The financial data for Michaels' Foods Inc. and Sunshine Enterprises Ltd. for the current year are as follows (amounts in thousands):

- Calculate the accounts receivable turnover for each company.
- Calculate the average number of days required by each company to collect its receivables.
- Which company appears to be more efficient at handling its accounts receivable?
- What additional information would be helpful in evaluating management's handling of the collection of accounts receivable?
12-21 (Inventory turnover)
Information on the activities of Novel-T Toy Company is as follows:

Required:
- Do a time-series analysis of the inventory turnover for each year. Also calculate the average number of days that inventories are held for the respective years.
- Is Novel-T Toy Company managing its inventories efficiently? Do you have enough information to answer this question? If not, what else do you need to know?
- Provide an example of a situation where management may deliberately reduce inventory turnover, but still be operating in the company's best long-term interests.
12-22 (Inventory turnover)
The financial data for Ken's Fresh Fruits Incorporated and Al's Supermarket Corporation for the current year are as follows:

Required:
- Calculate the inventory turnover for each company.
- Calculate the average number of days the inventory is held by each company.
- Knowing the type of inventory these companies sell, comment on the reasonableness of the inventory turnover. Which company manages its inventory more efficiently?
- Which company would be a more profitable investment? Can we tell? Explain.
- What are the potential problems with fast inventory turnovers? Would these be a concern for Ken's Fresh Fruits?
12-23 (Inventory turnover)
Clearwater Company and Sparkling Springs are competitors in the bottled water industry. Their financial data (in thousands of dollars) for the current year are as follows:

Required:
- Calculate the inventory turnover for each company.
- Calculate the average number of days the inventory is held by each company.
- Knowing the type of inventory these companies sell, comment on the reasonableness of the inventory turnover. Which company manages its inventory more efficiently?
- Which company would be a more profitable investment? Can we tell? Explain.
12-24 (Analysis using selected ratios)
The following ratios and other information are based on a company's comparative financial statements for a two-year period:

Required:
- What is the amount of current liabilities at the end of 2011?
- What is the amount of total debt at the end of 2011?
- What is the total shareholders' equity at the end of 2011?
- Do you think this company is a retail company, a financial institution, or a service organization? Explain.
- If the company has 1,650,200 common shares outstanding for most of 2011 and has issued no other shares, what are its net earnings for 2011?
- Based on the information available, what is your assessment of the company's liquidity? Explain.
- Given the limited information, what is your assessment of the company's overall financial position? Explain.
- What changes do you see between 2010 and 2011 that appear particularly significant? What explanations might there be for these changes?
12-25 (Analysis using selected ratios)
HomeStar Corp. is a national chain of retail hardware stores with total assets of $2.5 billion. Selected financial ratios for HomeStar are as follows:

Required:
The economic slowdown that started in 2008 was difficult for HomeStar. Briefly discuss what these financial ratios indicate about how HomeStar was affected by the slowdown. Which measures deteriorated over the period? Which ratios indicate positive action taken by HomeStar during the period?
The following financial information is for Ambroise Industries Inc.:
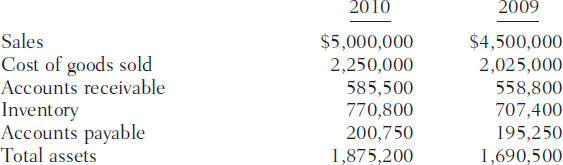
Ambroise is a distributor of auto parts operating in eastern Ontario that offers 30-day terms and has all sales on credit. The company has a large inventory due to the number of parts it stocks for different makes and models of cars. Most of its suppliers offer terms of 30 days, and Ambroise tries to stay on good terms with its supplies by paying on time.
Required:
- What is the average time it takes Ambroise to collect its accounts receivable? How does that compare with the credit terms that the company offers?
- What is the average length of time that inventory is on hand?
- What is the average length of time that it takes Ambroise to pay its payables? How does that compare to the credit terms it is offered?
- The operating cycle is the length of time from when a company purchases an item of inventory to when it collects cash from its sale. How long is Ambroise's operating cycle?
- Assume that Ambroise finances its inventory with a working capital loan from the bank. If Ambroise could improve its inventory management system and reduce the inventory holding period to an average of 50 days, how much lower would the company's bank loan be?
12-27 (ROE and ROA)
The following financial information relates to Smooth Suds Brewery Ltd. (amounts in thousands):

Required:
For each year, calculate the following:
- Return on shareholders' equity (ROE)
- Return on assets (ROA), broken down into (i) the profit margin percentage and (ii) the total asset turnover rate
- Comment on the profitability of Smooth Suds Brewery Ltd.
12-28 (ROE and ROA)
Cathay Glass Company's summarized statement of financial position is as follows:

The interest rate on the liabilities is 7% and the income tax rate is 35%. There are no preferred shares, and net earnings for the year are $13,650.
- What is the company's after-tax cost of debt?
- Calculate the ROE and ROA for Cathay Glass.
- Explain what causes the ROE to be equal to the ROA.
- How could Cathay Glass increase its ROE?
- Calculate the earnings before interest and taxes.
- Assume that the interest rate is now 9% and that the income tax rate remains at 35%. Calculate the net earnings, ROA, and ROE for Cathay Glass.
- Compare the ROE in parts “b” and “f” and explain why there is a difference.
12-29 (Debt to equity, debt to total assets, and times interest earned)
Artscan Enterprises' financial data are as follows:

Required:
- Calculate the debt to equity, debt to total assets, and times interest earned ratios.
- Comment on the long-term solvency position of Artscan Enterprises.
12-30 (Debt to equity, debt to total assets, and times interest earned)
Silver City Ltd.'s financial data are as follows:
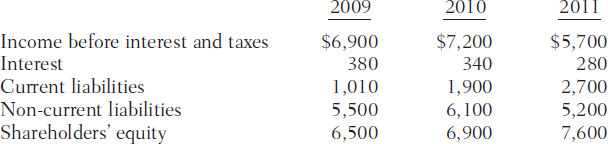
Required:
- Calculate the debt to equity, debt to total assets, and times interest earned ratios.
- Comment on the long-term solvency position of Silver City Ltd.
12-31 (Transaction effects on ratios)
Two lists follow: one for ratios and another for transactions.
Ratios:
- Current ratio
- Quick ratio
- Accounts receivable turnover
- Inventory turnover
- Debt to total assets
- ROA
- ROE
Transactions:
- Goods costing $200,000 are sold to customers on credit for $380,000.
- Accounts receivable of $140,000 are collected.
- Inventory costing $110,000 is purchased from suppliers.
- A long-term bank loan for $500,000 is arranged with the bank, and the company receives the cash at the beginning of the year.
- The bank loan carries an interest rate of 18% and the interest payment is made at the end of the year.
- The company uses $40,000 to buy short-term investments.
- New common shares are issued for $250,000.
State the immediate effect (increase, decrease, or no effect) of each transaction on each ratio. You may want to format your answer in a table with the ratios down the left, and the transactions across the top.
12-32 (Earnings per share)
In 2010, Signal Communications Ltd. reported earnings per share of $0.34. Signal had 28.1 million common shares outstanding during 2010 and 2011, and no preferred shares. In 2011, Signal reported net income of $10,926,000.
Required:
- What were the net earnings for 2010?
- Calculate the earnings per share for 2011.
- Will Signal also disclose a diluted earnings per share amount? Explain.
- Assume that in December 2010 Signal decided to split its common shares three for one. What effect will this have on the earnings per share amount calculated in “b”? Will the earnings per share amount for 2010 be affected as well? Explain.
12-33 (Equity analysis ratios)
Caltron Electronics has 3,000,000 common shares and 400,000 preferred shares outstanding. The preferred shares pay a dividend of $4.00 per share and are convertible into 800,000 common shares. During the year, Caltron earned net earnings of $9,800,000. The price/earnings ratio for the electronics industry is 12.5 times.
Required:
- Calculate the basic earnings per share that should be reported in the financial statements.
- Why is it important that the notes to the financial statements describe the preferred shares as convertible?
- If Caltron purchased its own preferred shares on the market and cancelled them, what impact would this have on earnings per share in future years?
- Estimate the market price of the common shares for Caltron at the end of the year.
- What return are Caltron's shares earning, based on the earnings per share?
- Lightning Electronics, a competitor of Caltron, reported earnings per share of $3.50 for the same period. Do you think Lightning is a better investment than Caltron? Explain your reasoning.
12-34 (Analysis of assets)
You have inherited money from your grandparents and a friend suggests that you consider buying shares in Galena Ski Products. Because you may need to sell the shares within the next two years to finance your university education, you start your analysis of the company data by calculating (1) working capital, (2) the current ratio, and (3) the quick ratio. Galena's statement of financial position is as follows:
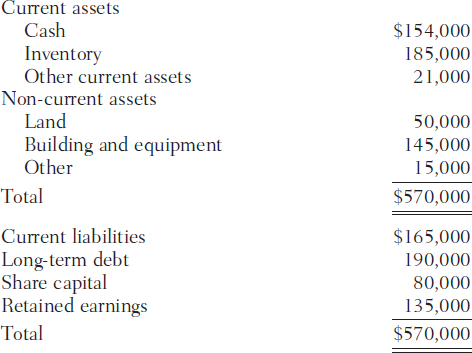
- What amount of working capital is currently maintained? Comment on the adequacy of this amount.
- Your preference is to have a quick ratio of at least 0.80 and a current ratio of at least 2.00. How do the existing ratios compare with your criteria? Based on these two ratios, how would you evaluate the company's current asset position?
- The company currently sells only on a cash basis and had sales of $900,000 this past year. How would you expect a change from cash to credit sales to affect the current and quick ratios?
- Galena's statement of financial position is presented just before the start of shipments for its fall and winter season. How would your evaluation change if these balances existed in late February, following completion of its primary business for the skiing season?
- How would Galena's situation as either a public company or private company affect your decision to invest?
12-35 (Ratio analysis over time)
The following information comes from the accounting records of Hercep Ltd. for the first three years of its existence:

In each of the three years, Hercep paid 10% interest on its long-term debt, and the current liabilities were non-interest bearing. In addition, the company made half of its first year's sales on credit, and made one-third of the second and third years' sales on credit. Hercep's shares sold for $12.75, $10.00, and $12.75 at the end of the years 2009, 2010, and 2011, respectively. The company also declared and paid dividends of $40,000, $30,000, and $40,000 in 2009, 2010, and 2011, respectively.
Required:
Based on this information, analyze and comment on the changes in the company's performance and its management of accounts receivable and inventory from 2009 to 2011.
12-36 (Ratio analysis of two companies)
You have obtained the financial statements of A-Tec and Bi-Sci, two new companies in the high-tech industry. Both companies have just completed their second full year of operations. You have acquired the following information for an analysis of the companies (amounts in thousands):

Required:
- Calculate the following ratios for the two companies for the two years:
- Current ratio
- Accounts receivable turnover
- Inventory turnover
- Total asset turnover
- Debt to equity
- Times interest earned
- Gross margin ratio
- Net profit margin
- ROA
- ROE
- Write a brief analysis of the two companies based on the information given and the ratios calculated. Be sure to discuss issues of short-term liquidity, activity, solvency, and profitability. Which company appears to be the better investment for the shareholder? Explain. Which company appears to be the better credit risk for the lender? Explain. Is there any other information you would like to have to complete your analysis?
12-37 (Compare ratios and comment on results)
Selected financial data for two intense competitors in a recent year follow (amounts in millions):


Required:
- For each company, calculate the following ratios:
- Average collection period (in days) for receivables
- Average holding period (in days) for inventory
- Current ratio
- Debt to total assets
- Times interest earned
- Return on assets
- Return on equity
- Compare the financial position and performance of the two companies, and comment on their relative strengths and weaknesses.
User Perspective Problems
12-38 (Use of ratios in debt restrictions)
Contracts with lenders typically place restrictions on a company's activities in an attempt to ensure that the company will be able to repay both the interest and the principal on the debt owed to the lenders. These restrictions are frequently stated in terms of ratios. For instance, a restriction could be that the debt to equity ratio cannot exceed 1.0. If it does exceed 1.0, the debt covered by the restrictions becomes due immediately. Two commonly used ratios are the current ratio and the debt to equity ratio. Explain why these might be used as restrictions. How do they protect the lender?
12-39 (Cross-sectional analysis)
In using cross-sectional analysis to evaluate performance, what factors should an investor match in choosing companies for comparison? Why are these factors important?
12-40 (Use of ratios for performance measurement)
A company's business strategy often leads to better performance on some financial statement ratios rather than others. For example, management of a high-volume retailer may deliberately keep prices low, reducing the gross margin percentage, in order to achieve a high inventory turnover. Give an example of another conflict between financial statement ratios, where management's attempt to improve one ratio may result in decreased performance on the other ratio.
12-41 (Use of ROA in performance measurement)
Management compensation plans typically specify performance criteria in terms of financial statement ratios. For instance, a plan might specify that management must achieve a certain level of return on investment—for example, ROA. If managers were trying to maximize their compensation, how could they manipulate the ROA ratio to achieve this goal?
12-42 (Use of ratios for investing decisions)
The Accounting in the News story on page 821 describes how Warren Buffet screens potential investments for his company, Berkshire Hathaway. Explain what each of the ratios mentioned in the article would tell Berkshire Hathaway about the companies being considered as potential investments. Are there any other ratios that Berkshire Hathaway could use to determine the same information about these companies? Explain your choices.
12-43 (Use of cash flow ratios)
There is judgement involved in preparing financial statements. For example, management must often estimate warranty expense and bad debts expense. Management may also need to select an accounting policy if generally accepted accounting principles allow a choice. Ultimately, these estimates and decisions affect the determination of net earnings. Do you believe that financial statement ratios using cash flows are more reliable than measures of performance that use net income? Discuss.
12-44 (Ratio analysis and auditors)
Auditors review the financial statements to determine whether the information reported has been collected, summarized, and reported according to generally accepted accounting principles. Although auditors are not expected to identify fraud, they do perform tests to see if there are any apparent abnormalities. If an auditor wanted to ensure that a company's sales revenues were not overstated, how might the auditor use ratio analysis to detect a possible overstatement?
12-45 (Using ratios to evaluate creditworthiness)
You are the lending officer in a bank and a new customer has approached you for a working capital loan. A working capital loan is intended to help a business finance the fluctuations in daily cash flows that arise from the lead-lag relationships of operating a business. Explain how you would use the accounts receivable turnover ratio, inventory turnover ratio, and accounts payable turnover ratio to assist you in your analysis.
12-46 (Use of ratios in decision-making)
Managers, investors, and creditors usually have a specific focus when making decisions about a business.
Required:
Each of the following independent cases asks one or more questions. Identify the ratio or ratios that would help the user answer the question and/or identify areas for further analysis:
- A company's net earnings have declined. Is the decrease in net earnings due to
- a decrease in sales or an increase in cost of goods sold?
- an increase in total operating expenses?
- an increase in a specific expense, such as tax expense?
- Is the company collecting its accounts receivables on a timely basis?
- Does the company rely more heavily on long-term debt financing than other companies in the same industry?
- In a comparison of two companies, which company is using its assets more effectively?
- In a comparison of two companies, which company has used the capital invested in it more profitably?
- Has the decline in the economy affected the company's ability to pay its accounts payable?
- Has the company been successful in reducing its investment in inventories as a result of installing a new ordering system?

Financial Analysis Assignments
Reading and Interpreting Published Financial Statements
12-47 (Ratio analysis for H&M)
The financial statements for H&M are in Appendix A. Alternatively, you can refer to Exhibits 1-3 and 1-4 on pages 23 and 26 to get the data needed for these questions.
Required:
Use the financial statements to answer the following questions:
- Calculate the following ratios for 2009 and 2010. For the 2009 ratios, use the year-end balance sheet amounts, rather than an average for the year.
- Gross profit margin
- Net profit margin
- Inventory turnover
- Debt to equity
- ROA and ROE. For the ROA, use the two components of the ratio.
- Comment on H&M's profitability and use of leverage over the period.
12-48 (Comparison of two companies in same industry)
The Practice Problem at the end of the chapter contains the financial statements and ratios for Le Château Inc. In Canada, Le Château and H&M are direct competitors in the fashion retail market for young adults.
Required:
Use the information from the Practice Problem, the financial statements of H&M in Appendix A, and the ratios calculated in problem 12-47 to answer the following questions:
- Compare the inventory turnover and gross margin for the two companies. Are there any factors that make this comparison less reliable?
- Compare the profitability and ROA for the two companies. What do you think explains the differences?
- Compare the ROE and use of leverage for the two companies. Which company provides a higher return to its shareholders? Which company has more financial risk from the point of view of the shareholders?
- Discuss the reasons doing a direct cross-sectional comparison of these two companies. Discuss the reasons for not doing one.
12-49 (Ratio analysis for Shoppers Drug Mart)
Shoppers Drug Mart Corporation is a licensor of over 1,170 full-service retail drug stores across Canada. The 2009 consolidated statement of earnings, balance sheet, and excerpts from the statement of cash flows for Shoppers Drug Mart are shown in Exhibit 12-12 (amounts in thousands).
Required:
Based on these financial statements, answer each of the following questions:
- Calculate the following ratios for both 2009 and 2008, and comment on the changes. For the 2008 ratios, use the year-end balance sheet amounts, rather than an average for the year.
- ROA (split into profit margin percentage and total asset turnover rate)
- ROE (no preferred shares outstanding)
- Times interest earned
- Operating cash flow to short-term debt
- Comment on the use of leverage by Shoppers Drug Mart, using appropriate ratios to support your analysis.
- The balance sheet of Shoppers Drug Mart includes intangible assets, which includes prescription files, developed technology, customer relations, and goodwill. How significant is the impact of these assets on the ROA calculated above? As a potential investor, would you have any particular concerns about the extent of intangible assets? Explain.
EXHIBIT 12-12A SHOPPERS DRUG MART CORPORATION, LIMITED 2009 ANNUAL REPORT

EXHIBIT 12-12B SHOPPERS DRUG MART CORPORATION, LIMITED 2009 ANNUAL REPORT

EXHIBIT 12-12C SHOPPERS DRUG MART CORPORATION, LIMITED 2009 ANNUAL REPORT

12-50 (Ratio analysis for Maple Leaf Foods Inc.)
Maple Leaf Foods Inc. is a major Canadian food processor with three major lines of business: meat products, agricultural feed, and bakery products. The company's 2009 consolidated statement of cash flows is presented in Exhibit 5-20 on page 374, and its consolidated balance sheet and statement of earnings are presented in Exhibits 10-21A and B on pages 705 and 706.
Required:
Based on these financial statements, answer each of the following questions:
- Calculate the following ratios for both 2009 and 2008, and comment on the company's profitability and use of leverage. For the 2008 ratios, use the year-end balance sheet amounts, rather than an average for the year.
- ROA (broken down into profit margin percentage and total asset turnover rate)
- ROE (no preferred shares)
- Calculate the following operating ratios for both 2009 and 2008 and comment on the results:
- Current ratio
- Quick ratio
- Accounts receivable turnover
- Inventory turnover
- Operating cash flow to short-term debt
- Examine Maple Leaf Foods' consolidated statements of cash flows and comment on any significant differences in the company's cash-related activities during 2006 and 2005.
- Based on your analysis in parts “a” and “b,” comment on the company's liquidity.
- The statement of earnings includes an expense related to “product recall and restructuring cost.” Note 11 describes this as the cost related to severance and lease termination in the processed protein operations, and from the consolidation of the pasta and sandwich operations in 2009. In 2008, $102.8 million was related to product recalls and ongoing restructuring costs. By showing the cost as a separate item on the statement of earnings, how is management hoping that investors will interpret this cost? How significant is the cost to the operating results in 2008 and 2009?
12-51 (Ratio analysis for Magnotta Winery Corporation)
Magnotta Winery Corporation has vineyards in Ontario and Chile, and produces, imports, exports, and retails beer and spirits, as well as wine and ingredients for making wine. The company's 2010 financial statements are shown in Exhibits 2-13A, B and C on pages 136 to 138.
Required:
- Prepare a common size income statement for both 2010 and 2009 and comment on any significant changes.
- Analyze the company's liquidity by calculating the following ratios for 2010 and 2009:
- Current ratio
- Quick ratio
- Accounts receivable turnover
- Inventory turnover
- Accounts payable turnover
- How does the nature of the business that Magnotta Winery is in help you to explain the ratios calculated in part “b”? Based on the accounts receivable turnover, what credit terms do you think Magnotta Winery offers its customers?
- The market prices of Magnotta Winery's shares on January 31, 2010 and 2009, were $1.70 and $1.40, respectively. What were the price/earnings multiples for those dates? If the P/E multiple had stayed at the 2009 level, what would the share price have been on January 31, 2010?
Beyond the Book
12-52 (Ratio analysis of company)
Choose a company as directed by your instructor and answer the following questions:
- Using the ratios given in the text, prepare an analysis of the company for the past two years with respect to profitability, liquidity, activity, solvency, and earnings per share ratios.
- Even though the ratios calculated in part “a” do not span a long period of time, discuss the company's financial health. Would you invest in it? Why or why not?
Cases
12-53 Cedar Appliance Sales and Service Ltd.
Cedar Appliance Sales and Service Ltd. owns several retail and service centres in northern British Columbia. Financial ratios for the company for the years ended December 31, 2010 and 2009, are provided below. For comparative purposes, industry averages have also been provided.
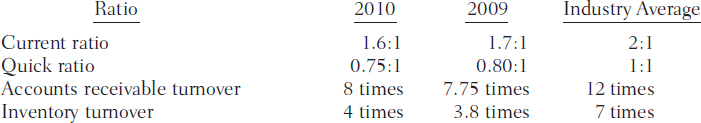
The company is in the process of opening two new retail outlets and will need to obtain a line of credit to finance receivables and inventory. To receive a competitive interest rate on its line of credit, it needs to ensure that its liquidity ratios are close to the average for the industry. In particular, the company would like to see the current ratio at 2:1. The company has hired you, an independent consultant, to suggest how it might improve its liquidity ratios.
In preparing your report, you have gathered the following additional information:
- The company's credit terms to its customers are net 45 days; no discounts are provided for early payment.
- The company policy is to pay accounts payable every 45 days regardless of the credit terms. Many supplier invoices offer discounts for payments within 30 days.
- Cedar's policy is to keep high amounts of inventory on hand to ensure that customers will have maximum selection.
Required:
Propose several steps that Cedar Appliance Sales and Service Ltd. might take to improve its liquidity. All suggestions must be ethical.
12-54 Albert Long
Albert Long has just been awarded a large academic scholarship. As he had already saved enough money from his summer job to pay for his current year's expenses, he has decided to invest the scholarship to maximize the funds he will have available for the next school year. Because he will need the money in about a year, Albert wants to invest in a fairly stable company and has decided that RBC Financial seems to be a very profitable investment.
Albert has obtained the company's annual report and has completed a very thorough ratio analysis. However, he has relied heavily on financial statements to perform the ratio analysis and only skimmed the other components of the annual report. You are a good friend of Albert's and explain to him that, although ratio analysis provides a good indication as to a company's financial strength, there is much more information available that an informed investor should consider before making any investment decisions.
Albert has asked you to help him investigate RBC Financial further. Other than ratio analysis, give him four examples of information that an investor might want to examine in order to fully understand a business. Where might this information be available?
12-55 Hencky Corporation
The management of Hencky Corporation is developing a loan proposal to present to a local investor. The company is looking for a $1-million loan to finance the research and development costs of producing a revolutionary new hand-held computer. Most of the loan proceeds will be spent on intangible costs, such as salaries, and this will therefore be a very risky investment. Because of the risk associated with the project, the investor is requiring some assurance that the company is currently solvent and operating as a going concern.
As the accountant for Hencky Corporation, you have used the most recent financial statements to calculate the following ratios:

Required:
Provide an explanation of how each of the above ratios should be interpreted and what they specifically tell you about Hencky's solvency and ability to continue as a going concern.
Critical Thinking Questions
12-56 (Discuss value of comparability)
One qualitative characteristic that underlies financial accounting is comparability. As you will recall, comparability refers to similarities of financial information between different companies, and consistency of the financial information produced by a company over time. Two of the many ways of achieving comparability are by limiting the number of different ways transactions may be recorded, and by specifying how assets, liabilities, equities, revenues, and expenses will be disclosed in the financial statements.
One argument against comparability is that it limits companies' ability to choose among accounting methods, and thus may result in disclosures that may not be agreeable to management or best suited to the particular circumstances.
Required:
Discuss the pros and cons of comparability, with reference to the analysis of financial statements.
12-57 (Use of subsidiaries to manage debt financing)
A major reason why companies such as General Motors form finance subsidiaries (separate companies that they control) is the potential to increase leverage as they seek ways to finance the manufacture and sale of their products. Such subsidiaries are referred to as “captive” finance subsidiaries.
Required:
Explain why a company that finances its operations through a subsidiary has greater debt capacity than a similar company that finances its operations internally.