
04
Project Reporting and Control
The ultimate aim in the management of an architectural practice is to ensure that the practice always has the financial resources in place that will allow the architects to do the sort of design work that they would choose to do. The practice must make sufficient overall profit to be self-sustaining. The best way to ensure this is to monitor the performance of each project as it progresses. By adopting the discipline of planning the financial targets of each new project as it comes in to the office, and then comparing its performance to what was planned, there is a far better chance of achieving the desired overall result.
However, it is often quite difficult to capture all of the necessary financial information at the outset of a new project. Still elated from having won the assignment in the first place, the team are naturally enthusiastic to ‘get stuck in’ to the design process and not to worry about what may seem to be peripheral paperwork. So this is one of those occasions when it is necessary to introduce the tension between the design process and financial reality which I described in the Introduction. If you don’t ensure at the outset that you know what the practice can expect to get paid for this project, and what needs to be spent to earn this fee, then there is a significant chance that you will reach the end of the project with only a vague sense of whether the project was financially worthwhile.
It is essential that the time is taken to think through the project plan in terms of what resources will be needed for each stage and for how long. This can then by translated into a cost plan by work stage against which you can monitor actual performance. You need to know from the beginning:
- How much is the overall fee?
- Are there other members of the design team that need to be paid from this fee (e.g. engineers or quantity surveyors)?
- Is there an agreed fee schedule?
- Is there a detailed resource plan that shows who is allocated to the project on a week by week and stage by stage basis?
- Are there significant other expenses involved (such as travel, hotel or printing costs) that will need to be absorbed as a part of the fee?
If this does not exist, the financial manager must risk unpopularity by continuing to ask for the information until they receive it. Once the information materialises, you can use it to develop a financial performance model that can be used to monitor the project as it develops.
The Calculation of Cost
The largest cost on a project of any size will be the architectural resources used – that is, the cost of the people working on the job. This may of course also include architectural services that are being bought in on a temporary or contract basis.
Architects are paid on a time basis – an annual salary is essentially a contract to purchase a package of professional hours over the course of a year. So the logical measure of the cost of resources is a time-based calculation, and for this to work it is crucial to have a robust time-recording system.
The detailed recording of time is one of those administrative activities that does not come easily to many architects. The advent of electronic time recording systems has made the process much easier in recent years. Yet in any practice, it seems that there will always be about 10 per cent of the staff who are always late in submitting their timesheets (and expenses). This is not restricted to architects by the way; every professional services firm encounters the same issue.
I have tried a wide variety of strategies to encourage these few miscreants to come into line: neither carrot nor stick seem particularly effective. The most workable solution that I have used is an automated reminder system, backed up with tenacity and a sense of humour. It is, however, essential for the integrity of the costing system that all time is properly recorded as soon as possible.
I am always concerned that there is a disconnection in the mind of the architect between the time they are spending on a project and the eventual profitability of that project. When the final reckoning comes there is often an element of surprise that the financial result for the project is disappointing. In my experience working with solicitors and accountants, who are usually obliged to record their time in six-minute units, there is a much greater awareness that time really is money.
Worked Example: Annual Costs for Employing one Staff Member

To arrive at the appropriate hourly rate for this staff member, you need to calculate the number of hours available for work in a year.
The general standard is to assume that there are 220 working days per year (i.e. excluding weekends, statutory holidays and, say, five weeks of paid leave) in a year, which equals 44 working weeks. If staff work a standard 35-hour week that is 1,540 hours per year.
Thus the calculation of the direct cost for this person would be:
£42,115 divided by 1,540 hours = £27.35 per hour.
The use of modern fully integrated project management and accounting software should make the financial position of each individual project and the practice overall much easier to track. However, there still seems to be a reluctance to engage fully with the process of keeping the information in the software up to date or to abandon the imperfect home-made tools such as spreadsheets. As an accountant, I am a great fan of the spreadsheet and use them extensively in my work every day. However, I am also aware that there comes a point where the amount of manipulation of data required is beyond the scope of the spreadsheet – or more accurately, beyond the skill level of the spreadsheet user. This is the point at which to acknowledge that project accounting software is going to be a worthwhile investment of time and money.
The practice finance manager needs to develop a direct cost rate for each person expressed in terms of £ per hour. The direct cost calculation needs to encompass not just the base salary and any regular overtime payments, if applicable, but also the add-on costs of benefits and employer’s national insurance contributions (NICs). Note, however, that this is only the cost of employing the person – it is not the same as the charge-out rate.
This direct cost calculation should be performed for each member of staff. Note, however, that problems can arise if individual rates are published, because there may be a close correlation with the underlying salary, so pay differentials could be accidentally exposed. To avoid this problem, I recommend that a standard average cost rate is used that applies to groups of people rather than individuals (e.g.‘all Part 3 students are costed at £20 per hour per person’). These rates will, of course, need to be recalculated when salaries change during the year.
The direct cost calculation uses only the elements that comprise the remuneration package, which is why it is termed the direct cost.
It is also possible to add in an allowance for a share of the office overheads, which are known as indirect costs. The overheads allowance can be calculated in a variety of ways, but is often derived by dividing the total overhead costs of the practice by the total number of planned chargeable hours. Thus, if all of the fee-earning staff performed the planned number of chargeable hours, then all the costs of the practice would be recovered.
Other than for the very smallest practices I prefer not to include indirect costs when working out the cost of employing staff, because the calculation of these charges (i.e. the non-staff overheads of the business) can be difficult and, since the calculation is constantly changing, the results can be misleading. I would recommend the simpler ‘contribution costing’ approach.
The contribution costing approach does not account for the non-staff overheads; instead we identify the ‘profit’ of each project by looking only at the direct resource costs, as calculated in the example above. That amount is deducted from the final fee, and the result equates to the contribution of that particular project to the rest of the overheads of the office. Applying this approach to all projects is an excellent aid to decision-making, because it means you can easily check, over the course of a financial year, whether the projects in hand/completed are making a contribution that is sufficient to cover the overheads and provide the desired level of overall profit.
As already mentioned, the direct cost is different from the charge-out rate. Charge-out rates should include an allowance for indirect costs, non-fee-earning time (i.e. practice administration, marketing, training) and also provide for a project profit margin.
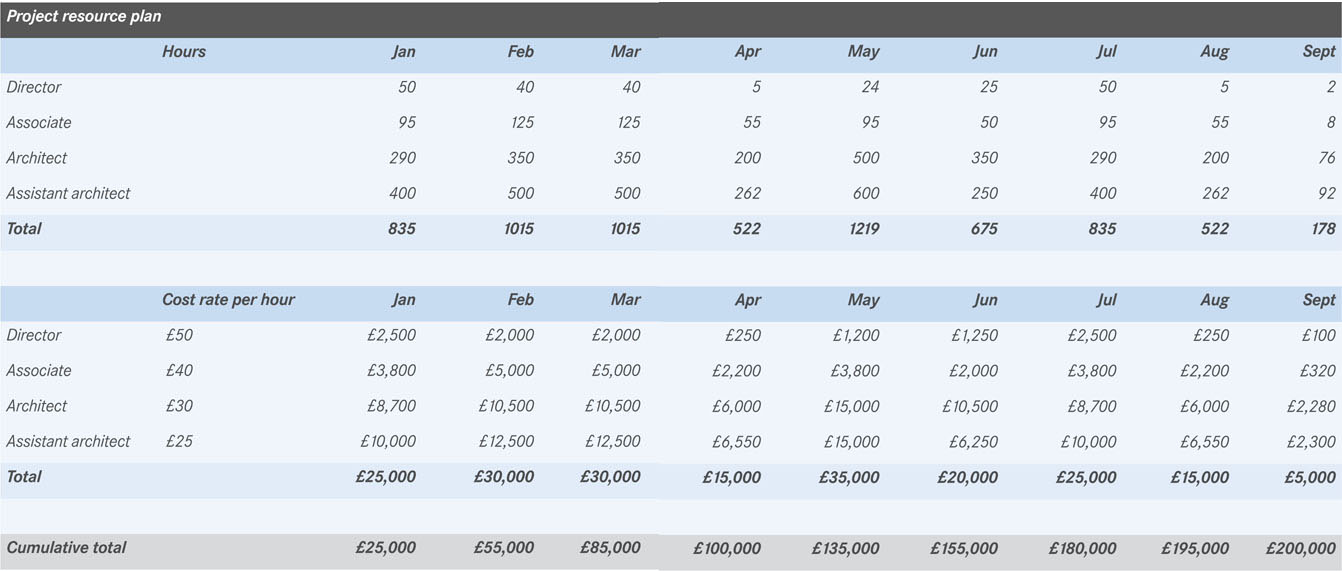
Armed with the data on total cost of all the employees, you can now work up a detailed project resource plan, as shown in the following examples.
Project resource plan
This spreadsheet shows the number of hours of each grade of person that will be needed on a month by month basis. The hours are translated into a cost by multiplying by the appropriate direct cost rate, as shown in the second half of the sheet.
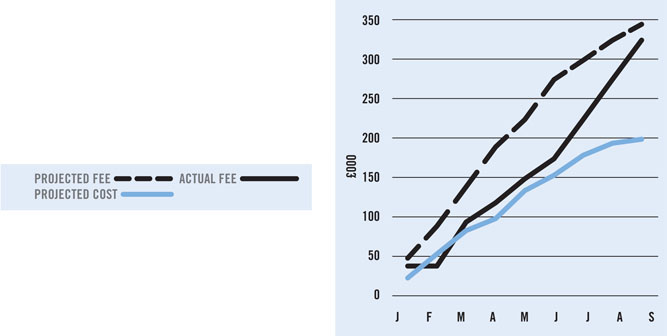
Projected fee and projected contribution (fee minus direct costs)
The values can be plotted onto a graph (as shown below) together with the projected fees. This project performance chart allows us to see how the planned contribution (planned fee minus planned direct cost) builds up over the course of the project.

Add in the actual fees
This graph illustrates the same project but with its actual fees now added. From this you can see immediately where the project has deviated from the original plan.
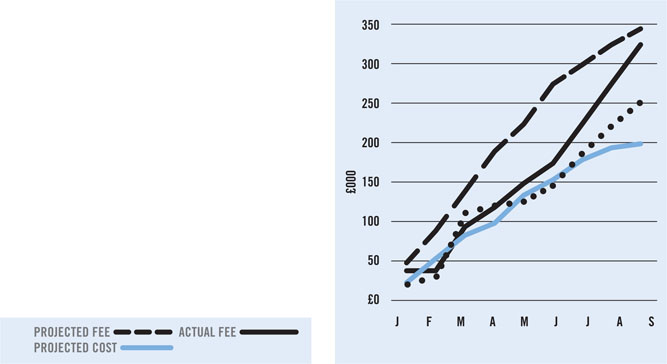
The whole picture: actual fees and actual costs
This final graph completes the picture by adding the actual costs extracted from the time recording system. This theoretical example does not make for happy reading. The final fee has turned out to be less than was originally planned, and the actual costs have turned out to be well over the original estimate. Consequently, the planned contribution of £145,000 has been reduced to an actual contribution of only £75,000.
Presenting the information in graphs enables you to see problems quickly as they arise. This should prompt an investigation of the situation until the cause of the deviation is understood. The approach also means that you can review many projects quickly. Hopefully, most will be more or less on track and not require any further attention, and your time can then be spent managing those projects that seem to be going off course.
It is important to note, however, that the graphs show when something is not going to plan, but this does not necessarily mean that things are going wrong. A squeezing of the planned contribution, as demonstrated by the narrowing of the gap between the actual fee and cost lines, is prima facie evidence of a problem. However, it may simply be that the client has expanded the scope of the work and that more people have been working on the project than was originally planned. As long as you pick up this sort of information before it is too late, and negotiate an additional fee for this work, this is potentially good news for the practice.
Over the course of time these project profiles can grow into a useful reference library, building up information so that you can look for patterns and trends. Does the practice experience particularly high or low levels of contribution in particular sectors or types of project? And you may soon learn that it is hard to make good levels of profit on small-scale projects, and profits tend to come from the larger projects. But you may decide to try to ensure that the practice maintains a healthy mixture of both.
Again this can result in tension in practice. A profitable project may well be one that is large in scale and contains a high degree of repetitive tasks or the use of standard room types etc. This type of work may well be seen as ‘boring’ by those working on the job who would be far more interested in spending their time on working out an interesting design challenge. The needs of the practice need to be managed and balanced with the needs of the individual architect.
Project performance is particularly prone to the effects of practice myth and rumour. I know of a practice that used to have its own ‘conventional wisdom’ that hotel work was unprofitable and should be avoided. Hotel work was duly turned away for the next few years. Yet when some brave soul undertook to analyse the actual figures of projects that had been completed, it emerged that the work on hotels was of average profitability after all. It is often surprising to discover that projects which ‘everybody knows’ are unprofitable may not actually turn out to be so, when actual historical data becomes available for analysis.
Every project is different and one of the few things that we can say with certainty is that situations and problems will arise that no one could have imagined at the outset. It is therefore important to have a monitoring tool available so the financial effect of these events can be seen and responded to as rapidly as possible.
I’ve always encouraged the sharing of project performance information with the team working on the job. People enjoy the sense of involvement that this brings and allows them to understand how their own activity fits into and affects the project performance overall.
Architects tend to take their work to heart and like to be part of a successful project. If you can provide them with an awareness of the job’s ongoing financial status there is far more chance they will align their own performance with the overall needs of the project.
Summary
- Overall practice profitability is only likely to be achieved if individual projects are targeted and monitored. By ensuring that the majority of projects stay on track and deliver the planned contribution there is a far greater chance of ending up with a profitable business.
- Calculate the cost per hour for each person who is working on the job.
- Develop a detailed resource plan that shows the people required and the periods of time when they will be needed. Apply their hourly cost rates to develop an overall cost for the project.
- Monitor the actual performance of the project against the plan as the project progresses.
- Charts or some other form of graphic reporting enable you to quickly pass over those projects that are on course and to concentrate attention on the few that are not.
- Sharing information with the members of the design team gives them a sense of involvement and responsibility and will allow them to align their own actions with the best interests of the project overall.