
06
Forecasting Future Fees
If you have followed the advice set out so far in this book, your practice will be set on a solid financial foundation and you will know where you are and how you got there. Now we are ready to move on to the uncertain world of forecasting the future.
I have always promoted the idea that accounting is much more of an art than a science – indeed the picture of the past that it paints is much more in the style of the Impressionists than the Realists.
Financial statements have a comforting and seductive air of accuracy and authority. Yet those of us who have been involved in their production know that there has been considerable scope for judgement and interpretation in putting the numbers together. This means that the resulting figures are the best approximation of the business situation as it stands. Others may have taken a different view and would have produced an equally ‘accurate’ yet different set of financial results.
The accountancy bodies have worked for many years to produce a series of standards that would result in financial statements being produced in a consistent way. This quest has been expanded to a global level with the recent development of international accounting standards designed to apply across all borders. Yet the problem remains that businesses are so diverse it is impossible to formulate a single set of rules that will apply and be appropriate in all cases.
Hence, there will always be a need for judgement and differences of opinion and approach.
If arriving at an accurate image of the past is so difficult, how are you to approach the task of working out what the future will hold? The starting point has to be taking a look at the prospects for income represented – in the case of an architecture practice – by a schedule of future fees.
Captive fees
This spreadsheet shows the fees which the practice plans to invoice in the coming six months (although in practice, it could be up to twelve months). This is the best indicator we have of how busy the practice is likely to be in the short to medium term.

The term ‘captive’ means that the fees are agreed, fully documented, contractually binding and scheduled for current projects. Only when projects have achieved this degree of certainty are they added to this chart. Prior to achieving this status the projects form part of a mixed bag of ‘possible fees’ (see page 50).
Experience has taught me that my architect colleagues do suffer from excessive optimism when it comes to the subject of fees. I have been lulled into a false sense of security many times on being told that a project has been won and therefore a fee is going to be forthcoming, only to discover that this was not the case. Clients can change their mind at the last moment or simply decide not to go ahead with the project or to delay the start date. From the financial point of view this all amounts to the same end result: no fee is shown on the current captive fee chart.
The example below shows the fees that we expect to be able to invoice on a monthly basis by individual project. These are then added to arrive at a total for each month.
As the year elapses the forecast figures are replaced with the actual figures achieved, and the balance of the forecast is revised accordingly. It’s an interesting exercise to compare the forecast billing in each month with the actual figures achieved to see what differences arose and why.
As noted earlier, the ability to invoice is often delayed by events on the project that are beyond the control of the practice. Consequently, it may be necessary to slide a project’s fee profile sideways to the right of the chart, indicating that those invoices will now be raised in later months.
It is a good idea to take steps to stop this ‘slippery’ process from becoming too much of a habit. If a culture arises in the practice whereby it is considered acceptable or even expected that fee schedules will slip, this can lead to a dangerous short-term cash flow position. It’s good practice to promote a culture of fee commitment in which everyone understands that an entry on the captive fee schedule is taken as a promise to deliver that fee for the practice in that particular month. Fee slippage is then viewed in a poor light and discouraged by peer pressure.
As with the majority of financial reports, the captive fee schedule is most easily read from the bottom up.
Monthly expenses and a monthly cash breakeven figure were already developed during the budget process. (The cash breakeven figure is simply the accounting breakeven figure with non-cash items such as depreciation added back.) So it is possible to quickly scan across the months in the total line on the captive fee forecast and see if there may be a problem in meeting the budgeted commitments.
For example, let’s assume that the cash breakeven figure in the above example is £180,000. Looking at the chart, April and May appear to be fine, but there is currently a problem in June and July, so we would like to see more fees in those columns to at least bring us up to the £180,000 figure. Beyond that, August and September are currently a long way below what they need to be. If the reality worked out in line with this forecast the practice would soon have a very serious financial problem!
This would typically be visible as a ‘cliff edge’ profile as shown below.
Cliff edge profile
The cliff edge profile reflects the normal work winning/delivery cycle. Most architects find themselves in the position of being too busy today, reasonably busy for the next few months and then potentially seriously short of work thereafter. The trick is to ensure that this cliff edge does not advance too close.

At SEH we have found that all will be well, as long as we can keep our captive fees forecast at breakeven level or above for the coming six months. If the cliff edge does start to become uncomfortably close (e.g. only two or three months away), that is the time for us to devote substantial energy on the sales and marketing fronts, to see if any of the possible jobs that have been incubating for some time can be encouraged to hatch.
Happily, the gloomy scenario predicted six months or so ahead rarely happens.
The comfortable position for the ‘cliff edge’ will vary from practice to practice, depending on the nature of its work. Practices working on smaller, more short-term ‘quick-fire’ projects can be comfortable with a cliff edge of say three to six months. For a practice focusing on larger longer-term projects that take longer to secure, such as hospitals or infrastructure projects, a cliff edge closer than twelve months may be a serious cause for concern.
Future Possible Fees
All of the future fees that the practice hopes to earn and which are anything other than completely certain (i.e. captive) should be classified as ‘possibles’. These possibles can often form quite a long list and will include many different projects and potential work situations, ranging from projects that are all but won, but which are just awaiting the final sign off from the client, to a project in which the practice has done no more than express an initial interest.
It is essential to keep a written record of all these opportunities and to track their progress. Hopefully, there will be a constant, gradual conversion process happening, taking projects off the possible list and onto the captive fees list.
The mixed nature of these projects presents the practice with a problem, in accountancy terms, because some are much more likely to become real jobs than others. Therefore it is important to develop a way of quantifying the probability of winning each job and deriving some form of weighted average total that can be compared from month to month.
The possible fees forecast is one way to achieve this.
Possible fees forecast

This spreadsheet estimates the likelihood of future fee levels by taking all of the potential work that is currently being pursued and applying a ‘success probability factor’ to each project. All of these probabilities and time-adjusted values are then totalled to produce a value that can be compared with the equivalent value that was calculated in the previous months. The aim is to attempt to predict medium-to long-term fees.
Worked Example: Possible Fees
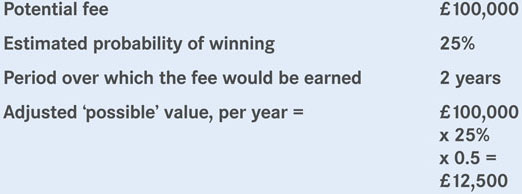
The example shown opposite represents a wide variety of projects in terms of both size of fee and likelihood of success. For example, Project A has a 25 per cent probability of success; this could be because the practice is on the final shortlist of four firms. Project B is shown with a 75 per cent probability of success (perhaps this represents a new instruction from an existing client, where there is no other architect involved and hence no competition), but the project still needs budget approval before it can begin. Project F is considered to have just a 5 per cent chance of happening; perhaps this is a project this just at the ‘expression of interest’ stage.
Furthermore, if these fees were to be won, they would be delivered over different periods of time. Some will happen in the coming year, but others will have fees that are spread over a number of future years. Therefore it is important to have a method that attempts to reconcile these variables and presents an indicative value that can be monitored from month to month, to see if a trend is emerging.
The simplest way to do this, is to derive an adjusted value for each project by taking the fee value, applying a probability factor, then annualising it by dividing by the number of years that the project would run, as shown above.
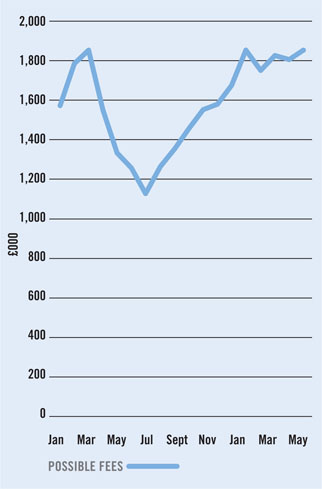
The same calculation is performed for each potential project and a total figure is derived. In itself this total figure has no great meaning. Ultimately a potential fee is either won or it is not. However, when it is tracked over a number of months it can be a useful predictor of future fee levels with resulting charges shown in the graph on the proceeding page.
Each practice should develop its own model to suit its own particular needs. What is important is that some attempt is made to predict the future levels of fees that will result from all of the current marketing activity.
The method described above is just one possible suggested solution, which I have found useful in our practice. We have been working with this particular method of evaluating possible fees for many years now and have found it to be a reasonably reliable predictor of future captive fees. There does seem to be a measurable nine- to twelve-month correlated lag between an increase or decrease in the total ‘possible’ figure and a similar effect mirrored in the actual fees achieved.
The possible fees chart can be strangely cruel. Imagine that you just won a major new project which you had been pursuing for some time. The successful team involved in the bid are rightly congratulated and the celebratory champagne is duly sipped; the design team is assembled and work duly begins. But when, a few days later, you revisit the updated possible fees chart you discover, somewhat to your dismay, that it has now suddenly plunged downwards.
The winning of the job means that it has become a ‘captive’ fee and therefore it has disappeared from the possibles list and the overall total. This serves as a reminder of the harsh reality of the situation: it is great to have won the work, but now you need to begin again, to win the work needed to keep the business going for the next twelve months.
A Combined Fee Forecast
Smaller practices may find it helpful to prepare a combined fees forecast, as shown opposite.
Combined fees forecast
This shows the overall picture for both captive and possible fees on a month by month basis. It is of course important to continue to appreciate the distinction between those types of fees shown in the top of the chart which are already contractually agreed, and those in the bottom half which you can only hope will happen.
In this example the overall monthly total seems to be reasonably consistent throughout the period of the forecast. However, in the latter months (August and September) the forecasts are still heavily dependent on fees that are yet to be confirmed and therefore it is important to try to convert these into captive fees as soon as possible.
Combining these two fee forecasts can a good indication of how busy the practice is going to be in the short and medium term. It is easy to see whether more resources will be needed to do the work on hand, or perhaps that the marketing drive needs to increase to ensure a flow of new work in the future.

The Resources Forecast
The captive fees forecast described above shows how much work is on hand and indicates how full the order book is for the next three to six months. This information can then be linked through directly to the cash inflow section of the cash flow forecast (Chapter 7), to illustrate the solvency position over the next nine to twelve months.
Next you need to know whether the practice has the right number of people available to be able to deliver the work lined up in the captive fees forecast. A resources forecast will provide this information.
Resources forecast
This is a rolling, weekly forecast of the people that will be needed on a project by project basis, compared with the total number of people available.

This forecast spreadsheet shows immediately where shortages or surpluses may occur. Like the captive fees forecast, it needs to be updated regularly (e.g. weekly) to accurately reflect the way that the resourcing needs of projects tend to fluctuate as the work progresses. These are not only project-related changes, but people changes too – to take account of holidays, study leave, sickness and so on. These factors are deducted in order to arrive at the ‘people available’ figure.
Someone in the practice needs to make a commitment to invest the time in keeping the details up to date, but in my experience this effort is well rewarded because it gives you the ability to see resource problems coming two or three months ahead. This is generally early enough to solve the problem before it becomes a crisis.
It is also important to plan for some flexibility so that there are always some resources available to help with the general marketing effort such as submissions for new work, working on design competitions or perhaps updating the practice’s website or promotional material.
This can be very hard to achieve, especially when there is great pressure on teams to deliver against a deadline. But it is just another aspect of the constant need to keep winning new work for the future to ensure that the practice survives. The forecast may show that two people are allocated to ‘marketing’. However, what this usually means is that ten people will each be spending some part of their time on these activities over the course of the week, blended in with their other project activities. When all of these pieces of individual marketing activity are aggregated they will amount to the equivalent of two people working full time on the marketing front.
A graphical view of the resources data will tend to echo the shape of the captive fees graph. But whereas the captive fees has a cliff edge some six to nine months away, the resources chart will have the reverse of this – a ‘cliff face’ that also appears in about six to nine months’ time, when it seems as if there will be a lot of people free with no project work to do.
Resources cliff face

Like all of the charts described in this book, the resources charts are most useful when showing trends over time. The resources chart tends to follow a familiar pattern. There always seems to be more work to do right now than we have the people to do it. The weekly column may well show a net position of –2 or –3, which means that the practice could really do with a couple of extra people now and next week.
However, it does seem that things will calm down shortly and that balance will be restored – the chart shows 0. So everyone will have to get their heads down (again) for the next week or so to meet the deadlines, comforted by the knowledge that it will get easier soon as the cavalry arrives in the form of people becoming free from their other current project commitments – the chart starts to show +2 or +3. Then we hit the cliff face in about six months’ time where it looks as if over half of the practice will be sitting around drinking coffee and reading magazines waiting for the phone to ring.
In reality this tends to be a fairly constant position. As new smaller pieces of work filter in or current projects expand or change, there is always more to do than we had anticipated. So at SEH, when we see a consistent number of weeks with a –2 or –4 ahead we know that it is time to look for some extra people – either by recruitment or by arranging to get in some temporary resources to meet some specific project deadlines.
The process begins with the chart below, which shows who will be working on each project over the next few weeks. The resulting net available figures are then linked through to the overall resources chart.
In my experience, projects rarely run to their expected timetable. They can quite suddenly accelerate when a client brings a deadline forward, or be temporarily frozen, perhaps when an unexpected delay occurs in gaining a planning consent, or funding is not becoming available when expected. Each of these events causes a rapid shift in the resources balance and the need for some swift revisions to the plan.
Overlaid on this is the desire to meet the aspirations of the individual architect or team member.
Allocation of staff resources

Understandably, the individual wants the stimulation of new challenges and to gain experience of working on a variety of building types across a range of sectors. Yet from the practice’s point of view the most efficient way to resource a project is to use people who have recent experience of working on a similar sort of project and who have gained expertise that will allow them to achieve a good result swiftly.
The need to manage this potential conflict successfully makes the resource planning process critical to the success of the practice. It requires a detailed knowledge of how projects work, complemented by sensitivity to the needs and desires of the individuals involved, and combined with an eye to how a particular group of people will function as a team.
Frustratingly, once this elusive balance is achieved, the chances are that something will come along to upset it in a matter of days, so that the whole plan will need to be re-addressed so that a new balance can be reached.
The allocation of people to projects is always going to be one of the most challenging tasks that the management of an architectural practice will face.
Summary
- Fees are either firm/captive (i.e. covered by a contractual agreement and are, as far as anyone can predict, definitely going to happen at a predictable time) or possible (with various levels of certainty).
- Captive fees tend to be predictable for the next three or six months, but beyond that they fall off the edge of the cliff. The constant mission of the practice is to ensure that this cliff edge does not come too close, but is kept at a constant distance in the future.
- Possible fees can be compared from month to month by applying a simple calculation to give a single indicator.
- By monitoring captive and possible fees you can obtain a good sense of the short- and medium-term prospects for work that can be invoiced.
- These charts need to be constantly updated as events change, if they are to retain their relevance and usefulness.
- Projects are often delayed or rescheduled and this will have a knock-on effect on fee billing, which needs to be kept under constant review.
- It is essential to develop a resource plan, as a way to predict whether there are people with the right level of skills available to deliver the work.
- Resources planning needs to take account of all the other essential but non-fee-earning tasks, especially marketing.
- Resources planning also needs to take account of the professional aspirations of the individual architect.
- Resources planning is the most difficult part of the whole process of financial forecasting, but it is crucial because so much money is invested in people.