
Chapter 12
Autosomal DNA (atDNA) Testing
IN THIS CHAPTER
![]() Getting your ethnicity estimate
Getting your ethnicity estimate
![]() Finding cousins with autosomal DNA
Finding cousins with autosomal DNA
![]() Using utilities for autosomal DNA results
Using utilities for autosomal DNA results
Wouldn’t it be great if you could take a single DNA test and then immediately see your genetic connection to all your ancestors? That day isn’t here quite yet, but testing your autosomal DNA is a step in the right direction. Over the course of this chapter, we look at the various uses of autosomal DNA (atDNA) and check out some of the utilities that can help you sort out the pieces of the puzzle that is autosomal DNA.
But First a Quick Review
You might remember from Chapter 10 (if not, feel free to flip back there for a quick look), that humans have 23 pairs of chromosomes. One pair of those chromosomes are the sex chromosomes (X and Y chromosomes). The remaining 22 pairs are referred to as autosomal chromosomes. Autosomal chromosomes are inherited from your parents — one chromosome in each pair from your father and one from your mother. As you are inheriting only one chromosome in each pair from each parent, you are inheriting about half of your parent’s DNA. As you go back further in time, each successive generation is only inheriting half of the previous generation.
Your parents inherited about half of their DNA from each of their parents, therefore you inherit about one-quarter of each of your grandparent’s autosomal DNA, 12.5 percent of each great-grandparent’s DNA, and so forth. We use the term “about” because it isn’t an exact number, and it varies from person to person. For example, Figure 12-1 shows the results of autosomal DNA inheritance of two girls who are sisters. Notice that Daughter 2 received far less DNA from her paternal grandmother than Daughter 1. Conversely, Daughter 1 received almost exactly a half split of her maternal DNA.

FIGURE 12-1: Percentage of DNA inherited by two girls.
Not only did each girl receive a different percentage of DNA, they also did not receive contribution of DNA from the grandparents on exactly the same locations on the chromosome. Figure 12-2 shows the amount and location of the inherited DNA from each grandparent on each chromosome. Notice that for any given chromosome, the location and length of the segments (a segment is the DNA contained between two points on a chromosome) are different. And, on Chromosome 20, notice that Daughter 2 did not inherit any DNA from her paternal grandmother, whereas Daughter 1 has a good amount of DNA from each paternal grandparent. We think it is interesting that there is a strong tendency for Daughter 2 to inherit all or almost all of the DNA from a single grandparent on Chromosomes 20, 21, and 22, where Daughter 1 tends to be a mix.

FIGURE 12-2: Locations of DNA inherited by two girls.
It is important to keep in mind that, except for identical twins, autosomal DNA is different in every individual. You might recall this is because of the process of recombination (for quick review on recombination, refer to Chapter 10). Two sisters won’t match as a result of recombination; neither will cousins, aunts, uncles, and so on. Nor will each person inherit DNA from the same set of distant ancestors — this becomes important in analyzing autosomal DNA results, as we discuss later in this chapter. Just because your sibling matches a distant ancestor and you don’t doesn’t mean that you aren’t related to the ancestor — just not through genetic family history.
Testing Process
You might be asking, “How does DNA testing work?” After you submit a saliva sample, the testing company inspects the sample to ensure it is useable. Then DNA is extracted from the sample and several copies are made. The copies are then examined to determine the nucleotide (or base) value at certain locations — or single nucleotide polymorphisms (SNPs). These values are either A, T, C, or G. For a quick recap on SNPs, revisit Chapter 11. And for a review of nucleotides and bases, check back in Chapter 10. Figure 12-3 shows what the raw output looks like from the testing service 23andMe.
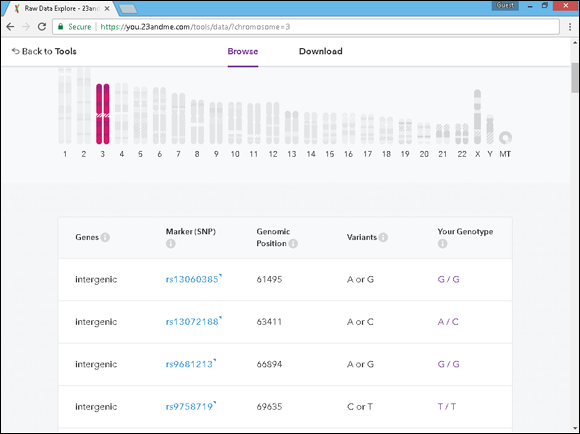
FIGURE 12-3: The raw data view of a chromosome at 23andMe.
The Marker (SNP) column shows the name of the marker and contains a link to the National Center for Biotechnology Information (NCBI) page for that SNP (containing a lot of scientific details). The Genomic Position column contains the location of the marker on the chromosome. The variants column lists the nucleotide value that can be contained in that position — it will be two of the four nucleotides. The final column shows the nucleotides that are present in the tester’s DNA sample.
As autosomal DNA is composed of more chromosomes than Y-DNA or mitochondrial DNA, a lot more SNPs are tested — numbering in the hundreds of thousands. Now, you are probably thinking that you don’t have the time to compare the values of hundreds of thousands of SNPs. And, you’re absolutely right. Fortunately, you don’t have to because the testing company does it for you.
To establish whether someone is related, the testing company looks at how many SNPs are the same along an area of the chromosome. This is different than how it’s done when testing for Y-DNA or mitochondrial DNA, which both compare the individual values of SNPs. In other words, when comparing autosomal DNA, the testing company looks to see how long a segment of like-DNA is between two individuals. The longer the segment on a chromosome and the more shared segments across all chromosomes, the more DNA is shared and therefore, the greater the probability is that two individuals are related. We show a practical example of this later in the chapter.
When the sequencing is complete, the testing company then runs an algorithm to determine what samples in its database match your sample. The algorithm varies between testing companies, so you can have two samples that are exactly the same, but yield a slightly different degree of relatedness between companies. The tester can then look at results from the database in the matches section of their reports.
What Can I Learn from Autosomal DNA Testing?
The two major uses for autosomal DNA in terms of family history are ethnicity estimation and “cousin matching.” Ethnicity estimation is what you likely have seen on television commercials for DNA testing companies — “I found out that I am x percent Scottish.” Cousin matching is using autosomal DNA to find people who are related to you genetically. By finding a third or fourth cousin, sometimes you can learn a great deal about a part of the family you may not even know existed.
Other uses for autosomal DNA testing are to map the DNA of your ancestors, once you find enough cousins who share DNA, and to look at inherited traits and health conditions.
Ethnicity Estimation
When forensic scientists began looking at DNA, they recognized that certain genetic markers were common to particular ethnicities. After enough markers were identified with ethnicities, they could begin to assess what percentage of ethnicity a person might possess. Family historians picked up on this and believed the same types of tests might be able to shed some light on the ethnicities of their ancestors — especially in the areas of identifying Native American, Jewish, and African ancestry.
The first important thing to notice is that we use the term ethnicity estimate. This is because it is just an estimate; not a comprehensive examination of the ethnicity of all of your ancestors. It is simply an estimate based upon the sample that you provided. And, keep in mind, you may not match the ethnicity estimate of your sibling. Remember, we all recombine differently leading to different results.
So, how do testing companies create the ethnicity estimates, you ask? They test the DNA of reference populations, then compare that DNA to your DNA. A reference population can be created when a testing company surveys a group of people in a specific location. They may ask questions about how long the family has lived in the location that they currently live, and so forth. After the testing company determines that the person is a good candidate for a reference population, their DNA results are added to others in the same area or with the same ethnicity to create a reference sample (much like the reference sample that we talked about with mitochondrial DNA in Chapter 11).
When you take an autosomal DNA test, your results are compared to the sample from reference populations. If you share enough of the segment of a reference population, then that reference population is included in your ethnicity estimate. Figure 12-4 shows ethnicity estimates overlaid on the chromosomes of a tester — what 23andMe calls chromosome painting. As you can see, there are different ethnicities estimated on each pair of chromosomes. Notice that one of the pairs of Chromosome 3 has a lot of mixture of ethnicities, including British and Irish, Native American, West African, broadly Northwestern European, and Southern European. The other pair on that chromosome is all British and Irish.

FIGURE 12-4: Ethnicity estimates shown at 23andMe.
If you take an ethnicity test, you can expect to receive a copy of the sequences examined and an interpretation of the results. The interpretation usually comes in the form of a percentage of a certain ethnicity. For example, Figure 12-5 shows a view of a person’s ethnicity at Family Tree DNA. In this case, it shows the following general ethnic percentages:
- European: 95%
- West Africa: <2%
- Central Asia: 2%
- South America: <2%
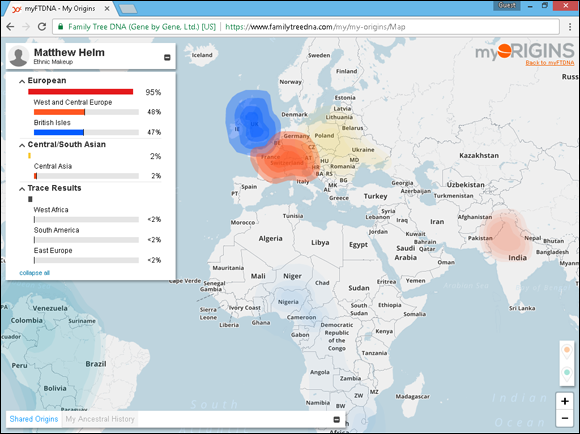
FIGURE 12-5: myOrigins ethnicity results from Family Tree DNA.
 The controversy with autosomal testing is that the DNA in each individual recombines differently. This means two children born from the same two parents could measure with different ethnicities because their DNA does not recombine the exact same way. Also, the percentages quoted by testing companies can often have a significant error rate or change over time as new research comes to light. And, the estimates are heavily dependent upon the reference population that it is compared against. Things such as migration patterns can have a large effect on the reference population. As a result, you could get different findings from different companies. For example, Figure 12-6 shows the findings of the same person tested at Family Tree DNA, 23andMe, and AncestryDNA.

FIGURE 12-6: Comparison of ethnicity estimates at three testing companies.
Another testing company, Living DNA (https://www.livingdna.com/en-us) is focusing on creating reference populations on a more localized level. Currently, they have defined 80 world regions, including 21 in Britain and Ireland. They recently announced an effort to create local level populations in Germany.
A slight twist on ethnicity estimates is Genetic Communities at AncestryDNA. Genetic Communities are defined by Ancestry DNA as groups of testers who are connected through DNA because they descend from a population of common ancestors. A lot of these communities are based on geographic locations or migration paths of the population. An example of a Genetic Community — Early Settlers of the Lower Midwest and Virginia — is shown in Figure 12-7.
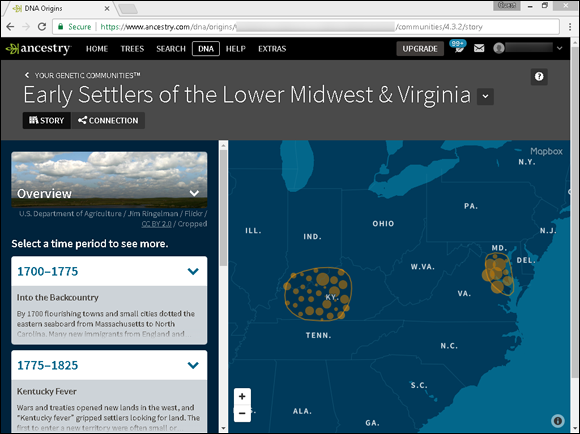
FIGURE 12-7: A Genetic Community at AncestryDNA.
Relationship Testing
As we mention earlier, Y chromosome testing is useful for tracing the direct male line. Mitochondrial testing is good for tracing a direct female line. Autosomal testing is useful for tracing ancestors anywhere in your pedigree, as shown in Figure 12-8.
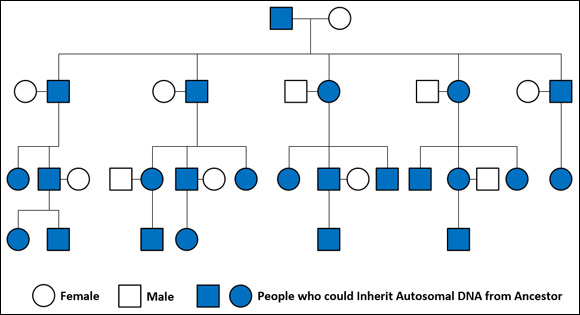
FIGURE 12-8: Individuals who can potentially inherit autosomal DNA.
However, before autosomal DNA testing can find a match between two testers and an ancestor, important things need to be in place:
- Tester 1 must have inherited DNA from Ancestor A.
- Tester 2 must have inherited DNA from Ancestor A.
- Tester 1 and Tester 2 must have inherited DNA from Ancestor A at the same location on the same chromosome (a matching segment).
- The length of the matching segment between Tester 1 and Tester 2 must meet or exceed the matching criteria of the testing company.
As we mentioned before, there are reasons why someone who is descended from a specific ancestor did not receive DNA from that ancestor — recombination being a principal reason. Each time a new generation is born, the likelihood of recombination reducing inherited segments to a length beneath the matching criteria increases.
Having said that, it is almost a “guarantee” that second cousins and closer will share DNA. If they don’t, a non-paternity event (such as adoption or misattributed paternity) should be investigated. However, after second cousins, the chance of matching starts decreasing rapidly. By the time you get to a sixth cousin, you have a probability measuring in the single digits of matching their autosomal DNA with enough length to show as a match. Before we get started on how to analyze autosomal DNA results, there are a few terms that you need to know.
- A segment of DNA is considered identical by state (IBS) if two individuals possess segments containing identical nucleotides. For a review of nucleotides, see Chapter 10.
- If the IBS segment can be shown to come from a common ancestor of the two individuals unchanged by recombination, then it is considered identical by descent (IBD). All IBD segments are IBS, but not all IBS segments are IBD.
- A method to help figure out whether a segment is IBD is called phasing. Phasing consists of identifying whether a particular DNA segment came from the mother or father of the tester.
- When three or more testers share a matching DNA segment (same location on the same chromosome) and have documented descent from an ancestor(s) it is called triangulation. The more individuals that can triangulate a segment, increases the confidence in the assignment of that segment to the ancestor.
We know all these definitions can be confusing. To reduce a little of the confusion, going forward we will refer to two types of segments — identical by descent (IBD) or non-identical by descent (non-IBD). Either the segment can be matched to an ancestor through triangulation (IBD segment) or it can’t be matched (non-IBD segment). We won’t refer to IBS anymore, but we gave you the definition earlier in this chapter in case you see it in the future.
Back to a familiar family
You probably thought you had heard the last of William Henry Abell and Elizabeth “Lizzie” Pickerell (our faithful example ancestors from earlier in this book). Well, they’re back! To give you real world examples of how to interpret autosomal DNA results, we’ll use results from testing descendants of William Henry and Lizzie, as well as descendants of Lizzie’s sister Mary and her husband William. To orient you to the family tree and the descendants, take a look at Figure 12-9.
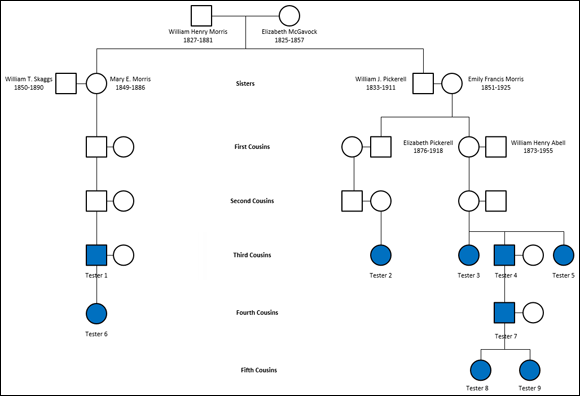
FIGURE 12-9: Family tree of William Henry Morris and Elizabeth McGavock annotated with DNA testers.
You probably already realized that William as a first name was popular with this family, so we’ll do our best to add last names to clarify who we are talking about. At the top of the family tree are Lizzie’s grandparents, William Henry Morris and Elizabeth McGavock. William Henry Morris and Elizabeth McGavock had more than two children, but to simplify things we only included those that were relevant to our analysis. Two of their daughters were Mary E. Morris who married William T. Skaggs and Emily Francis Morris who married William J. Pickerell. William J. Pickerell and Emily Morris were the parents of our Lizzie Pickerell.
There are nine testers involved in this analysis. They are indicated as shaded shapes on the above chart. They come from three different family lines and represent three generations. We included descriptions down the middle so you can see at a glance the relationships between the family in the left column and the family in the right column. In this example, Tester 1 and Tester 2 are third cousins. In truth, only three testers were needed for triangulation, however; we show you as we go along why using more testers provides more opportunities for discovery.
Objectives of the test
We want to accomplish a few things with this analysis. First, we want to provide evidence of Matthew’s descent from William Henry Morris and Elizabeth McGavock. Although we have census records, marriage records, and birth records to substantiate this, we want another piece of evidence to help confirm the relationship.
Second, as Lizzie Pickerell died early in her life, Matthew’s family lost touch with the Pickerell side. We don’t know much about the family and want to find distant cousins who might know more information about the family that wouldn’t be found in the records that we already have.
Third, in their “spare” time, Matthew and his daughter are working on a project to estimate what the genome of his grandparents looked like. Matthew’s grandparents passed away before DNA testing became an “in” thing. Thus we need to test his father, aunts, and uncles, as well as, members of the extended family to help recreate the genomes as best we can. As his family has double cousins, it is difficult to sort out what DNA segments belong to what family. By comparing the results of extended family members, we can begin to sort out the genomes.
Fourth, we want to begin constructing the genomes of Matthew’s distant ancestors — Emily Francis Morris and Elizabeth Pickerell. By identifying what segments are from these ancestors, we can identify other researchers who have DNA matches, but don’t know how they are related.
Playing the match game
To launch the analysis, we identified individuals who were related along the Pickerrel and Morris family lines using match lists on two different websites. We found Tester 2 using the match list at 23andMe and found Tester 6 at the GEDmatch site (we discuss GEDmatch later in the chapter).
Each of the three major testing companies maintains a database of results. They use algorithms to compare the results between two individuals and determine whether they are related in a genealogically relevant time period (that is, a time period where the relationship could be confirmed through historical records). When testers decide to find relatives, they consult match lists. Figure 12-10 shows the match list on the AncestryDNA (https://www.ancestry.com/dna) website.

FIGURE 12-10: AncestryDNA match list.
The AncestryDNA match list contains the username of the individual, a calculation of the relationship, a confidence level of the match, and a link to a family tree of the individual if they maintain one. If you see the shaky leaf, then AncestryDNA has calculated who it thinks is the most recent common ancestor(s). Clicking on the username gives you additional information such as the date last logged in (very useful to see if the person is an active researcher), pedigree and surnames (if the individual has posted a public family tree you can reach it from here), shared matches, map and locations (shows birth locations that are in common in both the individual’s and your family trees) and a button to send the individual a message. To see the amount of shared DNA between you and the individual, click on the information (i) button next to the confidence level. It will show you the number of centimorgans and shared segments. This can be a little misleading depending on the length of the segments. We talk more about segment length in a minute. AncestryDNA shows a person as being a match if they share at least one segment of 5 cM. Unfortunately, at that level, you may see some false positives.
The Family Tree DNA FamilyFinder match mechanism works in a similar way. The match list contains the name of the tester, a link to a pedigree (if they have posted one), a link to email the tester directly, match date, relationship calculation, amount of shared centimorgans, longest shared block, an indicator of whether there is a match on the X chromosome, a link to add the individual to the family tree stored on the Family Tree DNAWeb site, and a list of ancestral surnames (if the tester has designated those). Clicking on the plus sign on the right side of the match will show the tests that have been taken by the tester, and the mitochondrial and Y-DNA haplogroups of the tester. The FamilyFinder will show a match if the largest segment of matching DNA is at least 5.5 cM. The site cautions that it is rare to be able to show genealogical relationships in a match where the largest segment is less than 7 cM.
23andMe’s match list is in the DNA Relatives section. Here you can see the individual’s name, sex, relationship calculation, the side of the match (this appears if a parent has tested and you have connected them with your results) and the sharing status (if the person is not sharing Ancestry Reports, there is limited information that you can view). If you are sharing Ancestry Reports with the tester, clicking on the match will show you how much DNA you share with the individual, which segments you share DNA on, ancestor locations (available if the tester submitted them), ethnicity estimates shared with the tester, haplogroups of the tester, and a list of names shared in common with the tester. If you are not sharing reports, you will see how much DNA you share with the individual, a button to request sharing, ancestor locations (available if the tester submitted them), ethnicity estimates shared with the tester, haplogroups of the tester, and a list of names shared in common with the tester. 23andMe DNA Relatives will show matches where at least one segment is 7 cM or greater, plus matches on 700 single nucleotide polymorphisms (SNPs).
Set your phasing to stun
In Chapter 10, we discussed that you receive one chromosome from your father and one from your mother. When testing companies look at your DNA, they record the nucleotides and their position on the chromosome, but they don’t know which parent contributed the DNA. To figure that out, a process called phasing can be done by the testing company or by the tester themselves.
Phasing is the process of attributing your DNA as being inherited from your father or your mother. This becomes critical for assigning things like ethnicity estimates to a parent or for figuring out whether a segment match is on the DNA contributed by your father or mother (or both).
Two things that phased results can do for you include reducing the number of false positive (non-IBD) results among your matches and helping to assign segments to specific ancestors (chromosome mapping).
There are a few ways to phase your DNA:
- Trio phasing: This is phasing that can be done when both parents and a child have been tested (hence the trio). To increase confidence of the phasing, you can also include siblings in the phasing process.
- Family phasing: If both parents are not available for testing, you can test one parent and all of the children of those parents. Also, testing grandchildren and the parents’ first cousins can help fill in the gaps.
- Statistical phasing: Testing companies sometimes use statistical phasing based upon the frequency of alleles in reference populations. Statistical phasing is most accurate for longer segments.
For more on phasing, see the International Society of Genetic Genealogy Wiki entry on Phasing at https://isogg.org/wiki/Phasing. You can also find a list of phasing utilities towards the end of the article.
As we had DNA test results from a father, mother, and son, we could do trio phasing for this project (the mother isn’t listed on the diagram as being a tester but we had her results for phasing purposes).
We have something In Common With you
One of the ways to reduce the amount of time spent assessing how a match is related to you is to use the In Common With functionality on the testing company’s website. As you might have guessed, In Common With functionality indicates other testers who share DNA with the same individual that you match.
If your parents have tested and they show up as having DNA in common with another individual, then you know which side (or potentially, sides) the tester matches. If results from your parents are not available, you can use another person (aunt, uncle, cousin, etc.) for whom you know the ancestry to determine whether the match is on the maternal or paternal side.
In the case of 23andMe, after selecting the individual from the DNA Relatives list, you will see the relatives in common section at the bottom of the page. The table lists the relative in common, how they are related to you, the calculated relationship between the tester and the relative in common, and a link to show the shared DNA segments in the chromosome browser (if sharing is enabled).
There are two ways to use the In Common With functionality in Family Tree DNA. The first way is to check the box next to a match on the Family Finder matches page and then click the In Common With button at the top of the page. The page will refresh showing all the matches that share DNA between you and the selected tester. A second and more targeted way is to use the Family Finder Matrix tool. You can find a link to the Matrix Tool on the Family Tree DNA dashboard page in the Family Finder section, just under the myOrigins button. Within the Matrix tool, you can select a group of up to ten people and it will show you a grid of the relationships between each individual (see Figure 12-11).

FIGURE 12-11: Family Finder Matrix showing matches with DNA in common.
In AncestryDNA, you can use the Shared Matches tab. When you click on a username in your match list, you are taken to the tester’s page. In the middle of the page are three buttons, Pedigree and Surnames, Shared Matches, and Map and Locations. Click on the Shared Matches button and you are shown a list of shared matches sorted by the relationship calculation.
Just because a person shows up with the In Common With tool doesn’t mean all three people share a common ancestor. It is possible that Tester A shares Ancestor 1 with Tester B. However, Tester B shares Ancestor 2 with Tester C. Tester C will still show up in the In Common With results because they indeed share DNA with both — just not the same DNA with both.
In our case, we knew we were on the right trail with Tester 2, when we used the In Common With section of the 23andMe site. Testers 3, 4, 5, 8, and 9 were listed as sharing DNA with Tester 2. So, we knew that it was probable that Tester 2 was on the paternal side of the family
Sticking with tradition
Before getting too far down the road, it’s important to establish the paper trail, so that we were sure we were investigating the correct family line. We needed to make sure that we could document that Tester 2 and Tester 6 were descended from William Henry Morris and Elizabeth McGavock.
Tester 2 had posted four surnames in the relatives section of her page on 23andMe. One of these names was Pickerrell, a variant spelling of Pickerell. Pickerell is not a common name, so we thought this was a promising lead — knowing that Matthew was descended from William Henry Morris and Elizabeth McGavock through Lizzie Pickerell. Matthew used 23andMe’s internal message system to contact Tester 2. Tester 2 confirmed that their common ancestors was William J. Pickerell and Emily Francis Morris.
It was a little bit easier to find the link with Tester 6. Tester 6 had posted her family tree on the GEDmatch site. Matthew just had to identify the common ancestor in the tree. In this case, the common ancestors were William Henry Morris and Elizabeth McGavock.
A quick check of supporting documentation showed the descent of both individuals, so we were off and running.
Browsing through the chromosomes
After we located suitable candidates with evidence of descent, it was time to analyze the chromosomes to determine the location and length of all the shared segments. We could do this through a chromosome browser.
Unfortunately, only Family Tree DNA and 23andMe have chromosome browsers. The lack of a chromosome browser on AncestryDNA is a big hurdle to overcome when trying to triangulate results. To get around this limitation, if you find a match on AncestryDNA and wish to triangulate the results, you will have to ask the tester on AncestryDNA to submit their results to a third-party utility site (see the section on utilities at the end of the chapter for more information).
You can find a button for the Family Tree DNA Family Finder chromosome browser on the myDashboard page. Once on the chromosome browser page you can select up to five matches to see where and how much DNA testers share.
On 23andMe you first must be sharing Ancestry Reports to use the chromosome browser to compare results with another tester. Once you are sharing Ancestry Reports, you can click on a tester from the DNA Relatives page. A static version of the chromosome browser is available showing the number of overlapping segments and their locations. For a more interactive chromosome browser, click on the DNA link at the top of the DNA Relatives page. From this page, you can select six testers to compare. Figure 12-12 shows the comparison of Tester 2 and Tester 7 using the 23andMe chromosome browser.
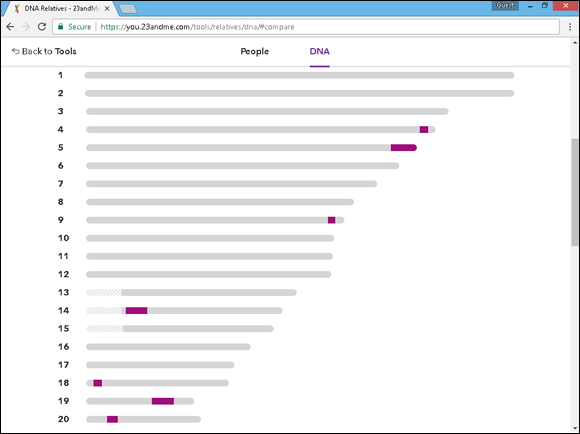
FIGURE 12-12: The 23andMe chromosome browser.
In the case of Tester 6, we were able to use the chromosome browser on GEDmatch to compare our results. GEDmatch allows testers to import the results from the major testing services into their website for comparison. AncestryDNA results are accepted on the site — the workaround for the lack of a chromosome browser on the AncestryDNA site.
Triangulating the data
Now that we could view the data of the testers through chromosome browsers we could analyze the data. When two or more testers share a matching DNA segment and have documented descent from an ancestor(s) it is called triangulation. Triangulation is the objective in an autosomal DNA test. So, we want know the location of the triangulated segments for each tester. We used Kitty Munson’s segment mapper utility (www.kittymunson.com/dna/SegmentMapper.php) to generate Figure 12-13. The figure shows the locations of some of the shared segments of the testers. These are not all the shared segments. To keep things simple we only included the locations on five chromosomes in the figure. Also, the segments that are mapped are not to scale. The length of the lines representing the segments are in proportion to the overall size of the chromosome. So, a small line on one chromosome may actually be a segment that is longer than a segment with a longer line on another chromosome. We analyze each of the five chromosomes to show you how triangulation works.
- Chromosome 2: Tester 1 and Tester 3, who are third cousins, matched with a segment length of 8.1 cM (marked as segment A on Figure 12-13). As neither Tester 2 (from another branch of the family) or Testers 4 or 5 (siblings of Tester 3) matched at that same location, we wouldn’t immediately say that the result is triangulated. It is possible that it is a non-IBD segment (a segment that does not match through descent, but rather by recombination). Consulting Tim Janzen’s probability table (
https://isogg.org/wiki/Identical_by_descent#Ranges_of_total_centiMorgans_of_IBD_segments_based_on_family_relationship), there is a five percent chance that Tester 1 and 3 share a common ancestor in the last six generations with a segment match of this length. We could triangulate this segment in the future, if we found more testers with proven descent that matched at this location. - Chromosome 3: Tester 2 and Tester 5, who are second cousins, matched on two segments — one segment with a length of 9.3 cM and the other 8.6 cM (segment C). Tester 2 and Tester 3, also second cousins (Testers 3 and 5 are siblings), matched with a segment length of 26.2 cM (segment B). The overlap of segment B and the second segment C of 8.6 cM is a definite triangulation. However, it is quite probable that the first part of segment C and the last un-overlapped portion of segment B are IBD, as well. Probably what we see here is that a recombination occurred with Tester 3 that eliminated the first segment that would have matched Tester 5’s first segment C. Also, Tester 5 seems to have had a recombination at the end of segment C, otherwise it would have been as long as Tester 3’s segment B. Because Tester 3 and Tester 5 are siblings segments B and C should have been the same length — except that recombinations (where the black arrows are located) occurred changing the DNA that was inherited from their mother. And Tester 4 (Tester 3 and 5’s brother) recombined the entire segment out of his DNA. If we were only testing Tester 4 and his descendants, we wouldn’t have found this shared segment. This is a good example of why it is useful to test more than one person from a family group. Tester 4 did match Tester 2 near the end of the chromosome (segment D) at 8.7 cM. Segment E is Tester 4’s son, Tester 7 who matched at 8.4 cM. Tester 7 lost some of the DNA, perhaps to recombination. Tester 7’s daughter (Tester 9) shares the same amount at 8.4 cM, so no recombination occurred. But what about Tester 8, Tester 7’s other daughter? Due to recombination, she no longer has DNA that matches Tester 2 at that position in the chromosome. We mentioned there was a triangulation on this chromosome. However, we can’t triangulate this to William Henry Morris and Elizabeth McGavock. As no one from the Mary E. Morris line triangulated, the best we can do is triangulate these segments to the nearest common ancestor to Testers 2, 3, 4, and 5 — William J. Pickerell and Emily Francis Morris. In the future, it may be possible to triangulate this to a more distant ancestor with test results from someone outside of the Pickerell-Morris line. But for right now, we don’t know whether the segments are from the Pickerell or Morris line (or both).
- Chromosome 4: Tester 2 matches segment G with Testers 3, 4, and 5. But again, it can only be traced back to William J. Pickerell and Emily Francis Morris. In this case, all of Tester 4’s descendants match on the segment, so this part of the DNA was handed down relatively unchanged.
- Chromosome 19: Tester 1 matched Tester 2 on a 13.8 cM segment K. Tester 1 also matched Tester 4 on a 66.1 cM segment L that encompassed segment K. Tester 5 (Tester 4’s sister) matched on a segment that was only one-third of the size of Tester 4. Tester 7 (Tester 4’s son) inherited only about half of the DNA segment at 34 cM. Tester 7’s daughter (Tester 9) inherited the same DNA unchanged at 34 cM. The segments labled N are those matches between Tester 1’s daughter Tester 6 and the rest of those matching Tester 1. From this, we can triangulate most of the segment shared by Testers 1 and 4 as belonging to William Henry Morris or Elizabeth McGavock. We can’t tell whether the segment comes from the Morris or McGavock side, or both. We would need additional testers to reach a more distant ancestor.

FIGURE 12-13: Locations of shared segments on five chromosomes.
Meeting the objectives
We know triangulation is enough to make your head spin. But the question is did we meet our objectives? Here is how we fared.
The first objective was to provide evidence of Matthew’s descent from William Henry Morris and Elizabeth McGavock. By triangulating with the descendant of Mary E. Morris we had two documentary paths to William Henry Morris and Elizabeth McGavock, plus the DNA evidence of a relationship between the lines. Finding additional testers among descendants of the other children of William Henry Morris and Elizabeth McGavock will help solidify the evidence.
Second was to find cousins that might know more information about the family. Through DNA testing, three new relatives were found (Testers 1, 2, and 6), all of whom had information about the family.
Third was to recreate the genome of the grandparents. A lot more work will have to be done to accomplish this, but we did get a start on identifying DNA from the Pickerell and Morris families. So, we can reasonably say that the grandparent descended from the Pickerell and Morris families possessed the segments shown in Figure 12-14.

FIGURE 12-14: Segments mapped to a grandparent.
Fourth was to construct the genomes of Emily Francis Morris and Elizabeth Pickerell. Similar to the grandparent, Elizabeth Pickerell would also have possessed the DNA in Figure 12-14. Emily Francis Morris would have at least had the DNA segment pictured in Figure 12-15. By finding a segment at a time, in theory we could construct enough of the genome for testing purposes, if we found enough other testers — although we wouldn’t be able to reconstruct the entire genome.

FIGURE 12-15: Segment mapped to Lizzie Pickerell.
X-Chromosome DNA Testing
X-chromosome testing can fill in some of the gaps between what Y-chromosome and mitochondrial testing can show. But, it can only do so for a portion of the family tree. The test is usually part of autosomal testing, so you normally don’t need to run a separate test.
As we mention earlier, females have two X chromosomes and males have one X and one Y chromosome. The mother’s X chromosomes act like autosomes in that the two X chromosomes can recombine, and one X chromosome is passed from the mother to each child, regardless of sex. The mother can pass on an X chromosome that is identical to her mother’s X chromosome, identical to her father’s X chromosome, or a recombined X chromosome. Figure 12-16 shows the possible inheritance of the X chromosome from a female ancestor.

FIGURE 12-16: Mothers pass an X chromosome to all their children.
The father passes a copy of his X chromosome only to his daughters. Because he has only the one X chromosome, no recombination takes place. Figure 12-17 shows the possible inheritance of the X chromosome from a male ancestor.

FIGURE 12-17: Fathers pass a non-recombined X chromosome only to their daughters.
The methods of analysis of X chromosome results are the same as the autosomal methods that we discussed in the last section. The difference being that possible matches are smaller than the potential autosomal matches. You can view the matched segments using the chromosome browsers at 23andMe and Family Tree DNA.
The criteria for X chromosome matching from the testing companies is also different than the threshold for autosomal tests. 23andMe compares the X chromosome for each person meaning that you may find X-chromosome-only matches. The criteria for matching depends upon who is being tested. If two males are compared, a match needs to be a segment of 1 cM in length and 200 single nucleotide polymorphisms (SNPs). If a male and female are compared, a match is 6 cM and 600 SNPs. If two females are compared there are two possible thresholds. If the two females share DNA on just one copy of the chromosome (half-IBD), they must match at least 6 cM and 1200 SNPs. If they match at the same location on both chromosomes (full-IBD), they must match at least 5 cM and 500 SNPs.
Family Tree DNA reports matches on the X chromosome, only if there is also a match in autosomal DNA. For the match to be apparent, autosomal DNA must match at 7.7 cM and 500 SNPs and the X chromosome must be 1 cM with 500 SNPs.
AncestryDNA does not use X chromosome when creating its match lists.
Utilities to the Rescue
At some point in your genetic research, you will encounter the need to examine DNA kits from multiple testing companies or to see results in a different manner than the testing companies allow. Genetic genealogists have constructed utilities to help you with analysis and with keeping track of all the results that you discover along the way.
GEDmatch (www.gedmatch.com) is a website with several useful utilities. Testers can upload the results from their testing company and run analyses on multiple kits, run triangulation reports, and view results through chromosome browsers. The site has some free utilities and you can pay to upgrade to the Tier 1 utilities. It accepts uploads of AncestryDNA kits so it can compensate for the lack of a chromosome browser at the testing company. We used this site to compare kits from both AncestryDNA and 23andMe for the earlier portions of this chapter.
DNAGedcom (https://dnagedcom.com) also contains valuable utilities including KWorks, which creates a spreadsheet of possible triangulations. And GWorks that compares family tree information to identify ancestors who are shared between individuals.
Another utility worth exploring is Genome Mate Pro (www.genomemate.org). Genome Mate Pro is a tool that you install on your computer to track your genetic research. You can import data from 23andMe, Family Tree DNA, and GEDmatch. We will warn you that it is a complex program and before using it, we highly recommend you watch the series of YouTube video tutorials that explain the features of the tool. We use it to keep track of our research, including correspondence from other researchers and view overlapping segments of other testers. Also, we find the segment map utility particularly handy (see Figure 12-18).
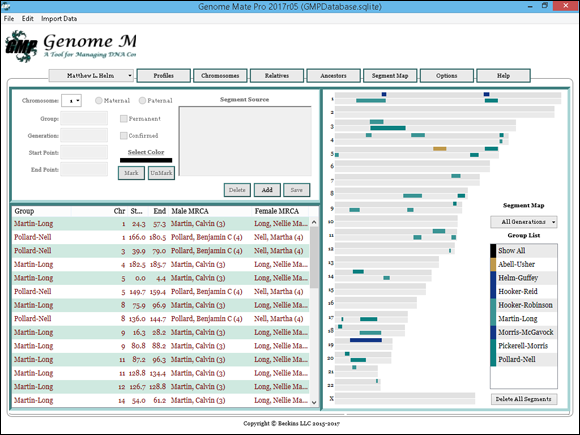
FIGURE 12-18: Segment map tab in Genome Mate Pro.