
Chapter 11
Direct-Line Genetic Tests
IN THIS CHAPTER
![]() Understanding Y-chromosome testing
Understanding Y-chromosome testing
![]() Getting information from mitochondria
Getting information from mitochondria
![]() Comparing results
Comparing results
Have you hit a brick wall with researching either your father’s or mother’s direct-line ancestors? Before you give up all hope of finding those elusive ancestors, why not try a direct-line ancestor DNA test? This chapter focuses on genetic testing of the Y chromosome (used for direct-line male ancestors) and mitochondrial DNA testing (used for direct-line female ancestors). We take you through the process of analyzing the results of both types of tests and point you to some sites that can help you find others with similar results.
Upfront we have to ask you to keep in mind that both tests are very limited in their scope. They are designed to provide evidence on a specific line of ancestors. For tests that apply to a broader set of ancestors, see Chapter 12.
Y chromosome (Y-DNA) testing
The Y chromosome is part of the one chromosomal pair that is not common between males and females; in males, the pair has an X and a Y chromosome, whereas in females, the pair has two X chromosomes. Because the Y chromosome isn’t paired with another Y chromosome, it doesn’t go through recombination in the same way that autosomal chromosomes do. For a quick refresher on recombination, flip back to Chapter 10. As it doesn’t go through recombination with another Y chromosome, it changes little over time as it is passed from father to son, unless a mutation occurs. Having said that, there are small areas where the Y chromosome can recombine with the X chromosome. However, these areas are not used in the Y chromosome DNA tests discussed in this book.
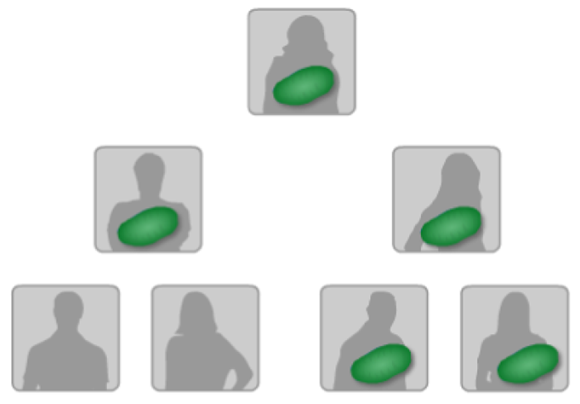
The Y-DNA test is available only for men (as only they carry the Y chromosome) — although women can participate in Y chromosome projects by using a father, brother, or male cousin as a proxy. (Figure 11-1 shows how the Y chromosome is passed from one male to another.) Now it’s time to get into the details of the test.
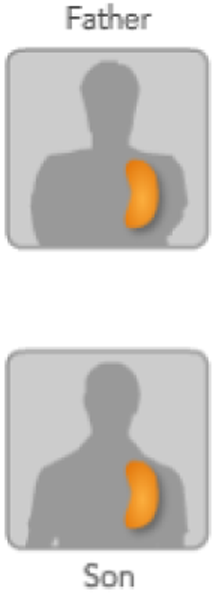
Courtesy of the Sorenson Molecular Genealogy Foundation, the scientific backbone of GeneTree.com
FIGURE 11-1: A Y chromosome is passed from father to son relatively unchanged.
“Junk” DNA is worth something
When scientists began studying chromosomes, they discovered that not all the base pairs were used as instructions for the cell. These noncoding regions, sometimes referred to as “junk” DNA because they seem to just be hanging around without helping guide the cell to fulfill its larger purpose, contain alleles that differ from person to person. This means that the junk DNA has characteristics that distinguish individuals from each other. Scientists soon began to use these alleles to identify individuals, especially in criminal investigations.
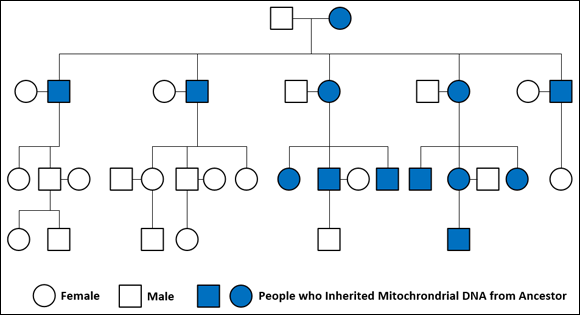
As more research was performed on the Y chromosome, scientists found that the noncoding regions could be used to define not only individual characteristics but also characteristics of larger populations into which individuals with these characteristics fit. In essence, these scientists discovered how to determine what population a particular human was a member of by using the noncoding regions of the DNA. They also discovered that the Y chromosome changes (or mutates) very little or not at all between fathers and sons. Because the Y chromosome is passed only from father to son, it is useful for tracing the direct paternal line of an individual’s ancestry (as illustrated in Figure 11-2).
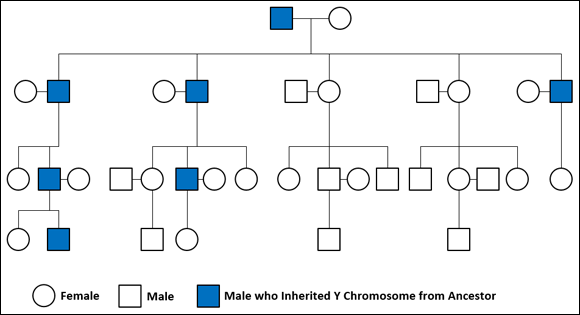
FIGURE 11-2: The path of the Y chromosome through a family.
The testing process
If you are interested in testing only testing Y-DNA, Family Tree DNA (www.familytreedna.com) may be your best bet. There are two methods of testing the Y chromosome — Y-STR and Y-SNP. Both tests can be conducted using the same sample.
The process of testing the Y chromosome starts with a man swabbing the inside of his cheek with a sample collection device that usually looks something like a Q-Tip cotton swab. The swab collects cheek cells, which serve as the source for the DNA. After the laboratory receives the swab, the DNA is extracted using a process called polymerase chain reaction (PCR). This process makes thousands of copies of the DNA so that it can be analyzed.
In Y-STR (Y-short tandem repeat) testing, after copies of the DNA are made, short segments of DNA along the Y chromosome are analyzed. These sequences are called markers, and the location of the markers on the chromosome is called the locus (or plural loci). The markers are read by the sequence of the bases. (Remember, as we mention in Chapter 10, the bases are abbreviated A, G, C, and T.)
Each marker is given a name that usually begins with DYS — short for DNA Y-chromosome segment. When analyzing the markers, laboratory technicians look for the number of times that a segment of bases (usually three to five bases long) repeats. These segments of repeating bases are called short tandem repeat polymorphisms (STRPs).
Is your head spinning yet from all the definitions? Try using the book analogy again: Think of this book as the Y chromosome and this chapter as a gene on the chromosome. This page would be the locus where the segment is located — that is easily found by using the page number. The DNA Y-chromosome segment is the following sentence:
- I like this book VERY VERY VERY much.
The short tandem repeat is the phrase VERY VERY VERY in the sentence — a set of letters that repeat.
Now see whether you can make sense of a real sequence of bases for the marker DYS393, keeping in mind that you can refer to the book example if needed:
- gtggtcttctacttgtgtcaatac AGAT AGAT AGAT AGAT AGAT AGAT AGAT AGAT AGAT AGAT AGAT AGAT AGAT AGAT AGAT atgtatgtcttttctatgagacatac ctcattttttggacttgagttc
To make it easier for you to see, we capitalized the letters and inserted spaces between the base segments composing the STR (which are AGAT). If you count the number of times the bases AGAT repeat, you find that the number of repeats for DYS393 for this individual is 15.
Comparing the results
After the number of repeats within a marker is calculated, we can compare the results of that marker plus a few other markers to see whether two or more individuals are related. We recommend testing at least 37 markers, so that you can differentiate your results from other individuals, especially if you have a common haplotype. (We discuss haplotypes in more detail in a minute). Family Tree DNA currently tests up to 111 markers. Table 11-1 shows a comparison between the markers of four individuals.
TABLE 11-1 A Comparison of 12 Markers for 4 Individuals
|
ID |
DYS393 |
DYS390 |
DYS19/394 |
DYS391 |
DYS385a |
DYS385b |
DYS426 |
DYS388 |
DYS439 |
DYS389-1 |
DYS392 |
DYS389-2 |
|
A |
13 |
25 |
14 |
11 |
11 |
11 |
12 |
12 |
13 |
13 |
13 |
29 |
|
B |
13 |
25 |
14 |
11 |
11 |
11 |
12 |
12 |
12 |
13 |
13 |
29 |
|
C |
13 |
25 |
14 |
11 |
11 |
11 |
12 |
12 |
12 |
13 |
13 |
29 |
|
D |
13 |
25 |
14 |
11 |
11 |
11 |
12 |
12 |
12 |
13 |
13 |
29 |
|
Modal |
13 |
25 |
14 |
11 |
11 |
11 |
12 |
12 |
12 |
13 |
13 |
29 |
If you compare the results between Individuals A and B in Table 11-1, you can see that they have the same number of repeats in 11 of the 12 markers. Only at DYS439 is there a difference in the number of repeats, commonly called a mutation. Based on this information, we would say that a genetic distance of 1 exists between these two individuals. At 37 markers, a genetic distance of 1 would indicate that these two individuals are probably related; however, testing more markers would certainly give a better indication of how closely they may be related. A higher probability exists that Individuals B, C, and D are related because they match on all 12 markers — however, testing more markers would provide more conclusive evidence.
The result of a set of markers for an individual is called a haplotype. So, in the preceding chart, the haplotype for Individual A is DYS393 – 13, DYS390 – 25, DYS19/394 – 14, DYS391 – 11, DYS385a – 11, DYS395b – 11, DYS426 – 12, DYS388 – 12, DYS439 – 13, DYS389-1 – 13, DYS392 – 13, DYS 389-2 – 29.
After you have haplotype results for an individual, it’s important to get results from relatives of that individual. More specifically, it’s important to get the haplotype results for relatives whose relationships can be documented by primary sources, including those in the extended family. These results help confirm the results of Individual A and establish an overall specific haplotype for the family. For example, say that all the individuals in Table 11-1 are related, and the fact is well documented with primary sources. After analyzing the results, a modal haplotype can be calculated by looking at the number of repeats that have the highest occurrence for each marker. Because all the results are the same for 11 out of 12 markers, the modal values for these are the same as the number of repeats for that marker. That leaves only one marker to calculate — DYS439. The results for DYS439 include one 13 and four 12s. That makes the modal value for that marker 12 — because it appears the most. So, the row marked Modal in Table 11-1 shows the haplotype for Individual A’s family.
The modal haplotype for a family can be used to compare that family to other families with the same surname to determine the probability that the two families are related. A good way to see these relationships is to join a surname DNA project — we talk about how to find these projects later in this chapter.
Assessing the probability of a relationship
After the test is taken and the results compared, it’s time to figure out the probability that two individuals are related. This probability is calculated by determining how often a change might occur to a marker over time. Fortunately, the testing companies calculate this for you and typically give you a tool (in the form of an online chart or written instructions) to compare two results.
Reviewing the data in Table 11-1, say that you want to determine how closely related Individual A may be to Individual B. To do this, you need to identify the Time to Most Recent Common Ancestor (TMRCA) for the two individuals. The TMRCA is pretty much what it sounds like — a calculation to determine when two individuals may have shared the same ancestor. As you’ll see from this example, the calculation is not extremely precise, but it is close enough to point you in the right direction as you begin looking for supporting documentation.
The easiest way to determine the TMRCA between two individuals is to use an online utility. If you used Family Tree DNA, you can use the Time Predictor (TiP) tool that accompanies your results. The TiP tells you the probability that you matched another individual within a particular set of generations. If your testing company doesn’t have one — or you’re comparing results from more than one testing company — you can use the Y-Utility: Y-DNA Comparison Utility at www.mymcgee.com/tools/yutility.html. You have a lot of options with this utility, so we take it a step at a time.
-
Point your web browser to the Y-Utility website at
www.mymcgee.com/tools/yutility.html.The page has a number of options and ways of displaying the data. We adjust some of these to make it easier to see the results.
-
Ensure that the Marker table includes those markers necessary for the calculation.
In the table at the top of the screen, you can see 100 markers. In this example, you work with the first 13 markers from the left. Make sure that the following markers are selected for Exists and Enable: DYS393, DYS390, DYS19/394, DYS391, DYS385a, DYS385b, DYS426, DYS388, DYS439, DYS389-1, DYS392, and DYS 389-2. Be sure that DYS19b is not selected. You can leave the rest of the markers selected.
-
Select the options that provide the appropriate calculation.
You are looking only for the TMRCA, so deselect the check boxes next to Ysearch, SMGF, Ybase, Yhrd, and Genetic Distance. Under the General Setup column, deselect the Create Modal Haplotype checkbox.
-
Enter the marker values into the Paste Haplotype Rows Here field.
Make sure that you separate the values with a space, as shown here:
A 13 25 14 11 11 11 12 12 13 13 13 29
B 13 25 14 11 11 11 12 12 12 13 13 29 -
Click Execute.
A new browser window appears with the calculation. In this example, the time to most recent common ancestor between Individuals A and B is estimated at 1,110 years. (The box with the TMRCA contains a blue background.)
Figure 11-3 shows the estimated TMRCA for Individuals A and B. Essentially, the results show a 50 percent probability that Individuals A and B shared a common ancestor within the past 1,110 years. So, as you can see, just testing on 12 markers doesn’t give you conclusive evidence of how closely two people are related. However, it can certainly indicate that two individuals are not related — especially if more than 2 markers out of 12 don’t match.
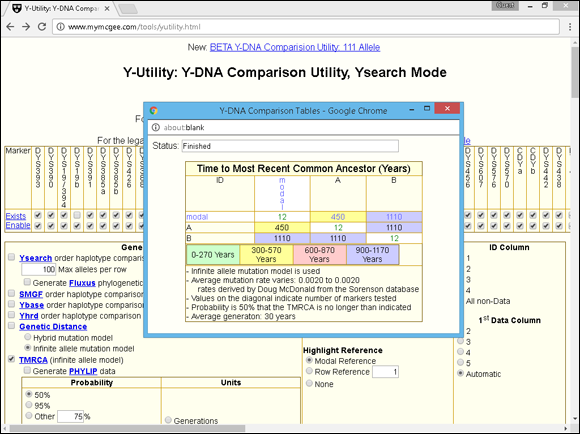
FIGURE 11-3: Estimated TMRCA from the Y-Utility website.
Haplogroups
We mention earlier in this chapter that haplotypes are a set of results of markers for an individual. When several similar haplotypes are categorized together, they compose a haplogroup. Haplogroups are useful for deep ancestry research (that is, research that is further back than the advent of surnames) and for placing a geographical context around the possible origin of the individuals in the haplogroup.
Y chromosome haplogroups are categorized by the letters A through T. You can find the current Haplogroup Tree at www.isogg.org/tree/. These letter designations are based on mutations of certain locations of the Y chromosome. For instance, if an individual has a mutation at the M89 locus, that individual falls into a haplogroup between F and J. If the individual has a mutation at both the M89 and M170 loci, the individual is classified in the I haplogroup.
Haplogroups can also be used to show the genetic distribution of individuals in a geographic area. For example, Doug McDonald maintains a map of the distribution of haplogroups at www.scs.uiuc.edu/~mcdonald/WorldHaplogroupsMaps.pdf. So, if you’re interested in finding out the distribution of Haplogroup I in Europe, you can match the color (pink) on the pie charts to determine how prevalent the haplogroup is in a particular area. From this chart, you can see that Haplogroup I has a strong concentration in Scandinavia and Northwest Europe.
Because haplogroups are large collections of haplotypes, it is useful to break down haplogroups into subgroups that have common traits. These subgroups are referred to as subclades. Subclades can help genealogists get a clearer picture of the geographical setting of that portion of the haplogroup.
Although the typical Y chromosome test can suggest a haplogroup and perhaps a high-level subclade, it normally takes additional testing to refine the subclade. In these additional tests, specific positions of the Y chromosome are examined for differences called single nucleotide polymorphisms (SNPs, or “snips”). Some SNPs are common and apply to a large population of people within a haplogroup. Other SNPs can be unique to an individual or a family — referred to as private SNPs. New SNPs are constantly being discovered, and that sometimes results in changes to the labels of subclades or the discovery of new subclades. To find the most up-to-date list of subclades, take a look at the International Society of Genetic Genealogy (ISOGG) Y-DNA Haplogroup Tree at www.isogg.org/tree/.
To illustrate how subclades work, look at the Haplogroup I example. Haplogroup I has a concentration in Northern Europe and a concentration in the Balkans. If you’re in that haplogroup, you might be curious about which region your direct male ancestor came from. To find this out, SNP tests would be conducted on several areas of the Y chromosome and compared with the Y-DNA Haplogroup I and Its Subclades chart at www.isogg.org/tree/ISOGG_HapgrpI.html. (See Figure 11-4.) If the individual had mutations at the positions L41/PF3787, M170/PF3715, M258, P19_1, P19_2, P19_3, P19_4, P19_5, P38, P212, U179, that individual would be in the Haplogroup I (also referred to as I-M170). If further mutations were found at locations L64, L75, L80, L81, L118, L121/S62, L123, L124/S64, L125/S65, L157.1, L186, L187, L840, M253, M307.2/P203.2, M450/S109, P30, P40, S63, S66, S107, S108, S110, S111, the individual would be classified in the subclade I1 (or I-M253). Discovery of a mutation at DF29/S438 would put the individual in the subclade I1a (or I-DF29), and so on.
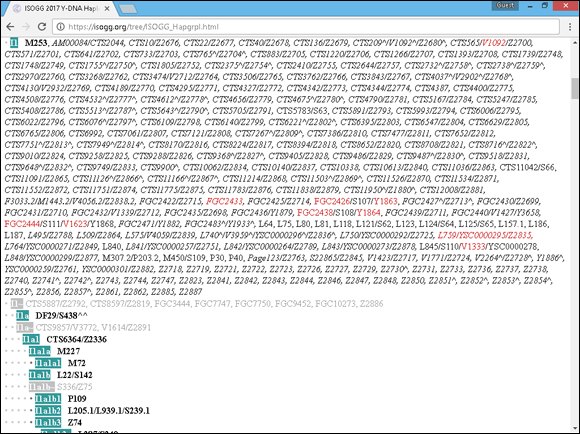
FIGURE 11-4: The subclades of Haplogroup I from the ISOGG website.
With the subclade in hand, you can consult a haplogroup distribution map to see where the subclade has the highest distribution. Figure 11-5 shows the distribution of Haplogroup I from a map on Family Tree DNA (https://www.familytreedna.com/public/I1d/default.aspx?section=results). Note that subclade I1 is listed as M253 on the map and that its greatest concentration of the subclade is found in Norway, Sweden, and Denmark, with lesser concentrations in eastern England and Normandy. This information can give you a hint as to where your ancestors may have originated.

FIGURE 11-5: Haplogroup I distribution map on Wikipedia.
After you discover the haplogroup of your results, you can join a Y-chromosome project for a particular haplogroup. Through a haplogroup project, you might be able to find out more about the origins of the haplogroup or the subclade within the haplogroup and communicate with others who are studying the same genetic group. To find a project for your haplogroup, see whether your DNA testing company already has a project for it or do a search using a general Internet search engine, such as Google, for something like “Y-DNA Haplogroup I project” or look for a haplogroup project hosted by the company that conducted your testing.
Locating others with the same results
Spending the money to perform a Y-chromosome test doesn’t do you much good unless you have something to compare the results with. The first place to look is your testing company. A list of matches will show you the test results of those who matched you exactly or were close matches. For example, Figure 11-6 shows a match list from Family Tree DNA. The table lists the genetic distance, name of the individual (we’ve blurred that column for privacy), the tests the person has taken, the most distant ancestor, Y-DNA haplogroup, terminal SNP, and match date.
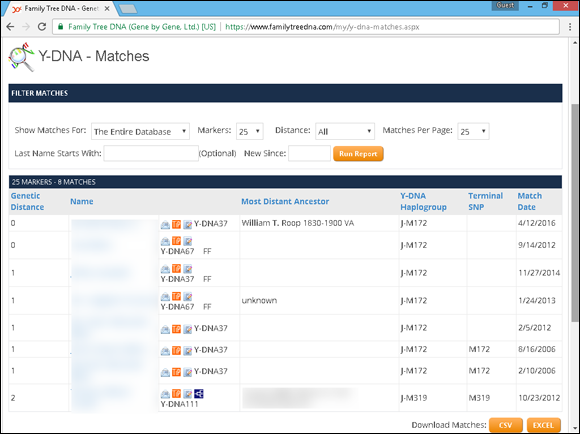
FIGURE 11-6: List of Y-DNA matches at Family Tree DNA.
To find others who have tested and received results that may match your results, you should look for a surname project currently under way for your direct male line. Some of the testing companies have established mechanisms for people to set up the projects that are housed on the testing companies’ servers. For example, you can find a list of projects at the Family Tree DNA site at https://www.familytreedna.com/projects.aspx.
Even if you’re a member of a surname project, you may want to distribute your results to a wider audience in the hopes of locating others with matching results. Ysearch (www.ysearch.org) allows you to enter your results, which can be then searched by other researchers.
If you don’t want your results to be publicly accessible, you can use these sites to search for others with your same haplotype and contact them directly. Say that you want to see whether any matches exist for the surname Abell in Ysearch. Follow these steps:
-
Open your web browser and go to
www.ysearch.org.At the top of the page are blue tabs with labels such as Create a New User, Edit an Existing User, Alphabetical List of Last Names, Search by Last Name, Search for Genetic Matches, Search by Haplogroup, Research Tools, and Statistics.
-
Click the Search by Last Name tab.
The resulting page contains two ways to search. You can search by entering a surname or by using a user ID. Also, you can limit the search to a specific geographic area.
-
In the Type Last Names to Search For field, type the surname you’re researching, type the two words in the Captcha box, and click Search.
Note that you can search for multiple names at the same time using commas to separate them. It’s a good idea to do this if the last name has some common derivations. For the purposes of this example, type Abell, Abel, Able.
- Click the numeral in the Name or Variants results box.
-
Choose a match by clicking a link in the results table.
In our example, the results page shows seven results. When we click the Abell result, the screen shows us brief information on each name, including an Abell from Maryland in Haplogroup I1.
-
Click the User ID link to see the DNA results for this individual.
Figure 11-7 shows the test results for this individual. You also find a link on the page where you can email the individual who submitted the result to Ysearch.

FIGURE 11-7: Results from Ysearch.org for the surname Abel.
A general reference database is also available. The Y Chromosome Haplotype Reference Database, at www.yhrd.org, allows you to see the distribution of a particular haplotype. However, it is a scientific database geared toward DNA researchers, so it doesn’t contain a lot of information useful to genealogists. Oxford Ancestors (www.oxfordancestors.com) also allows you to search its database if you log in as a guest.
Mitochondrial (mtDNA) testing
In the preceding section, you look at Y-chromosome DNA testing that assists in the genetic identification of the direct male line of a family. In this section, you look at mitochondrial DNA testing, which allows the identification of the genetic information of the direct female line of a family.
The mitochondrion is the power plant of the cell. It’s outside the nucleus and has its own distinct genome, called mtDNA, which is inherited from the female parent by both male and female children. (Figure 11-8 shows the inheritance.) Because it also mutates at a very slow rate, the mtDNA is good for identifying genetic relationships over many, many years and generations, as shown in Figure 11-9.
Courtesy of the Sorenson Molecular Genealogy Foundation, the scientific backbone of GeneTree.com
FIGURE 11-8: Mitochondrial DNA is passed from the mother to her children.
Courtesy of the Sorenson Molecular Genealogy Foundation, the scientific backbone of GeneTree.com
FIGURE 11-9: The path of the mitochondrial DNA through a family.
Testing method
For testing, mitochondrial DNA is divided into three regions — a coding region, a Hypervariable Region One (HVR1), and a Hypervariable Region Two (HVR2). Genealogical tests are usually conducted on a sequence of Hypervariable Region One, a sequence of both Hypervariable Regions One and Two, or the full mtDNA. The results from these sequences are compared with a sample from either the Cambridge Reference Sequence (CRS), revised Cambridge Reference Sequence (rCRS), or the Reconstructed Sapiens Reference Sequence (RSRS). The CRS is the mitochondrial sequence of the first individual to have her mitochondrial DNA sequenced. The differences between the sample and the CRS are considered mutations for the purposes of assigning a haplogroup to the sample.
How is this accomplished in practical terms? At the beginning of the previous chapter, we mention that DNA testing was used to identify the remains of the family of the last Czar of Russia. The results of the remains thought to be Czarina Alexandra were compared with Prince Philip, and the results matched. (Prince Philip and Czarina Alexandra were both descended from Queen Victoria.) The results were listed as the following:
HVR1: 16111T, 16357C HVR2: 263G, 315.1C
In Chapter 10, we talk about how DNA is coded. In that section, we mention that a DNA sequence contains four bases: adenine (A), guanine (G), cytosine (C), and thymine (T). These same bases are used in sequencing mitochondrial DNA.
The first result for Czarina Alexandra was 16111T. This result is interpreted as the substitution of thymine in the location 16111 of the Hypervariable One region. The second result translates as the substitution of cytosine at location 16357 of the same region. The next result, 263G, shows a substitution of guanine at location 263 in the Hypervariable Two region. The fourth result is a bit different in that it contains a .1, indicating that an extra base was found at that location. This means that the fourth result shows that an extra cytosine is found at the 315 location in the Hypervariable Two region. Based on the changes between Czarina Alexandra’s sequence and the Cambridge Reference Sequence, her sample was classified in mitochondrial Haplogroup H.
 Keep in mind that although they’re named in the same manner, Y chromosome haplogroups and mitochondrial haplogroups are two different entities.
It is worth noting that 23andMe (www.23andme.com) tests mitochondrial DNA using SNP sequencing. However, it doesn’t publish the results as differences with the reference sequence. If you want to know the difference, you need to download the mitochondrial result from 23andMe and compare it to a reference sequence yourself.
Making sense of the results
Mitochondrial DNA changes (or mutates) at a slow rate. This makes its uses for genealogical purposes very different than the uses for Y chromosomes, which change at a faster rate and can link family members together at closer intervals. However, mtDNA is useful for determining long-term relationships, as in the case of the Romanov family.
When two individuals have the same mutations within the Hypervariable One region, it is considered a low-resolution match. If the individuals have a low-resolution match and are classified in the same haplogroup, there is about a 50 percent chance that they shared a common ancestor within the past 52 generations (or about 1,300 years). If they have a low-resolution match and the haplogroups are not the same, it is considered a coincidence, and the probability is that the two individuals did not share a common ancestor within a measurable time frame. Depending on your result set, you might get a lot of low-resolution matches. To see whether a connection really exists, it is useful to test both the Hypervariable One and Hypervariable Two regions.
A high-resolution match occurs when two individuals match exactly at both Hypervariable One and Hypervariable Two regions. Individuals having high-resolution matches are more likely to be related within a genealogically provable time frame. With a high-resolution match, there is about a 50 percent probability of sharing a common ancestor within the past 28 generations (about 700 years).
Finding others with the same results
Similar to Y chromosome testing, you might want to post your mitochondrial DNA results to some public databases. One place to post results is at www.mitosearch.org, shown in Figure 11-10. To find more information on mitochondrial DNA scientific databases, check out MITOMAP at www.mitomap.org.
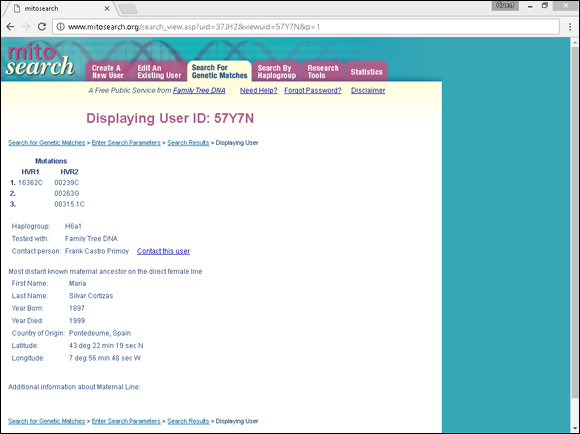
FIGURE 11-10: An entry from MitoSearch.org.