
Chapter 5. Debugging and testing
This chapter covers
- Capturing debugging information
- Using a logger to log error and debugging information
- Working with stack traces
- Writing unit tests
- Creating acceptance tests
- Detecting race conditions
- Running performance tests
One of the advantages of working with a modern language is tooling. Over the years, developers have created fantastic tools that streamline the development process. Go is designed as a language for system developers, and it’s loaded with tools designed to make your job easier. This chapter focuses on those tools and strategies for building resilient software. We talk about logging, debugging, and different sorts of testing.
In the preceding chapter, we talked about errors and panics. It seems fitting that we begin this chapter with techniques for finding the sorts of bugs that lead to unexpected errors and panics. We’ll begin with debugging.
5.1. Locating bugs
Sometimes you see a bug and know immediately what caused it. More often, you need to spend a short amount of time in the code hunting for the problem. And every once in a while, you hit those frustrating beasts that take hours or even days to track down.
That third category of bug usually warrants the use of special tools or tactics to track down the issue. This section covers some of those tools and tactics.
5.1.1. Wait, where is my debugger?
The go-to debugging tool of choice for many software developers is (surprise!) the debugger. This magnificent tool executes your code and walks you through each step of the way at whatever pace you desire.
Before we dive headlong into the discussion, there’s one thing worth noting. Despite the plethora of developer-oriented features in Go, it doesn’t yet have a fully functional debugger. The core team has focused on other things, and the closest thing to an official Go debugger is the GNU Debugger (GDB) plugin. You can use the venerable old GDB to do some debugging, but it’s not as reliable as many developers desire.
Tip
If you’d like to get GDB configured for debugging Go, the golang website has a great introduction (http://golang.org/doc/gdb).
The Go community has also stepped in, and one project in particular looks good to us. Delve (https://github.com/derekparker/delve) is a new Go debugger under active development. As of this writing, the Delve installation process is tricky, especially on a Mac. But if you’re looking for a full-featured debugger that does an admirable job of tracing goroutines, Delve is a sound bet. Our guess is that Delve will supplant GDB as the choice debugger for the Go community.
Another alternative is the slightly less traditional Godebug tool (https://github.com/mailgun/godebug). Although breakpoints have to be coded into your source, Godebug instruments your code and allows you to get a deeper view into what’s going on.
With all of that said, maybe we’re a little bit old-school, but we haven’t found the debugger situation to be much of a drawback. Go provides great libraries and tools that have gotten us out of even our most sticky situations. With that caveat behind us, let’s dive into some good code-quality practices in Go.
5.2. Logging
It has long been the accepted practice that long-running processes write status information to a log file or subsystem. If you take a look at any popular programming language, you’ll find libraries that provide common logging features. Go is no exception. In fact, the Go designers decided to include logging in the core libraries.
Typically, logs are intended to capture certain pieces of valuable information that developers, system administrators, and other programs can use to learn about an application’s running lifetime. For example, a quick peek at a web server’s log file should reveal when the server was last started, whether it has encountered any abnormal conditions, and whether it’s handling requests.
5.2.1. Using Go’s logger
Go provides two built-in packages for logging: log and log/syslog. We’ll talk about the main package first, and in section 5.2.2 we’ll turn to the syslog package.
The log package provides basic support (mainly in the form of formatting) for writing log messages. In its simplest usage, it formats messages and sends them to Standard Error, as shown in the following listing.
Listing 5.1. Simple log usage
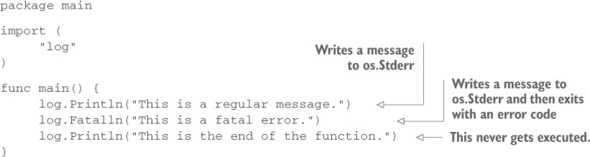
If you were to run this code, the output would look something like this:
$ go run simple.go
2015/04/27 08:18:36 This is a regular message.
2015/04/27 08:18:36 This is a fatal error.
exit status 1
We have a few things to point out about this example. The first is that the error messages are all sent to Standard Error, regardless of whether the message is an actual error or an informational message. If you glance at the godocs for the log package, you’ll notice that it doesn’t distinguish between message types. But it does make a second distinction, and that leads us to our other point.
When you call log.Fatalln or any of the other “fatal” calls, the library prints the error message and then calls os.Exit(1), forcing the program to quit. Additionally, log.Panic calls log an error message and then issue a panic.
The log functions all have printf-style variants so that you can insert information into your log message string: log.Printf("The value of i is %s", i).
Practically speaking, we haven’t found the basic logging functions to be all that useful. Although some momentum exists in the Docker/container world behind logging to Standard Out and Standard Error, the prevailing wisdom seems to be that log messages should be sent to either a logging service or a designated file. To that end, we’ve gotten a lot more use out of the log.Logger type that’s also in the package.
Technique 22 Logging to an arbitrary writer
Sending messages to Standard Error is useful for simple tools. When you’re building servers, applications, or system services, you need a better place to send your log messages. Later in the chapter, you’ll look at writing directly to the system log, but here you’ll look at using the log package to write to any io.Writer.
Problem
You want to send logging messages to a file or to a network service without having to write your own logging system.
Solution
Initialize a new log.Logger and send log messages to that.
Discussion
The log.Logger provides features for sending log data to any io.Writer, which includes things like file handles and network connections (net.Conn). The next listing shows a brief example that illustrates setting up a log file and sending messages.
Listing 5.2. Logging to a file
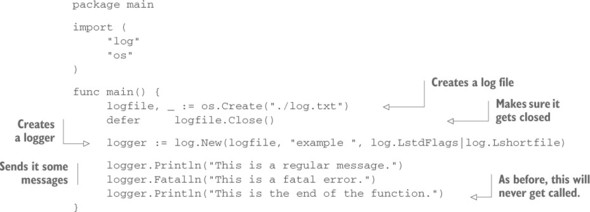
This example begins by creating a log file and then using it as a destination for log messages.
Note
The way we set up this example, the log file will get overwritten every time because we used os.Create. This is nice for our example, but you may want to open an existing log file instead of clobbering it.
When creating a new log.Logger, you can pass three pieces of information to it. The first is the io.Writer where you want to send messages. The second is a prefix for log messages, and the third is a list of flags that determines the format of the log message. To understand the second and third, let’s take a look at some sample log data from the log.txt file generated by the preceding program:
$ cat log.txt
example 2015/05/12 08:42:51 outfile.go:16: This is a regular message.
example 2015/05/12 08:42:51 outfile.go:17: This is a fatal error.
As before, only two of the three logger.Log calls succeed because the second one also generates a fatal error. But you can see from the file how the Go logger logs the data. Roughly speaking, you can break a log message into three parts: the prefix, the automatically generated information, and the log message itself, as shown in figure 5.1.
Figure 5.1. Components of a log file
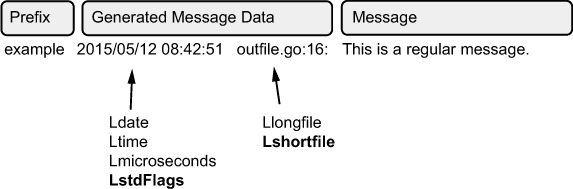
You can control the prefix field with the second argument to log.New. As you may have noticed, when we created our logger, the prefix had a trailing whitespace (after example). That wasn’t an accident. By default, the logger doesn’t put any space between the prefix and the generated data.
When it comes to the generated information, you don’t have direct control over the information, but you have some degree of indirect control. For example, although you can’t format the date and time fields exactly as you’d like, you can set flags that determine how specific the log message is. When creating the log.Logger, the third argument is a bitmask of flags. As you saw in this example, we passed in the flags log.LstdFlags | log.Lshortfile. This sets the date format and then instructs the logger to show the file and line info. (You might notice that those are also highlighted bold in figure 5.1.)
For the most part, only two pieces of information are automatically generated for you: information about when the event happened and information about where it happened. With the date and time information, you can set the precision of the timestamp:
- Ldate controls printing the date.
- Ltime prints the timestamp.
- Lmicrosends adds microsecond precision to the time. This automatically results in the time being printed, even if Ltime isn’t set.
- LstdFlags turns on both Ldate and Ltime.
Then a pair of flags deals with the location information:
- Llongfile shows a full file path and then the line number: /foo/bar/baz.go:123.
- Lshortifle shows just the filename and the line number: baz.go:123.
Although you can combine flags with a Boolean OR, some combinations are obviously incompatible (namely, Llongfile and Lshortfile).
Logging to files is usually straightforward, but sometimes logging to different sources can introduce complexity. We’ll start with one of the more difficult cases—working with network-based loggers—and then return to more straightforward cases in which existing logging tools cover our needs.
Technique 23 Logging to a network resource
The previous technique showed how to log to a generic io.Writer. The code we wrote used a simple file as a destination for the log message. But these days, many of the applications we write—especially servers—run in the cloud inside Docker images, VMs, or other resources that have only ephemeral storage. Furthermore, we often run servers in clusters, where it’s desirable to aggregate the logs of all servers onto one logging service.
Later in this chapter, you’ll look at using syslog as an external logger. But right now you’ll look at another option: logging onto a network resource.
Many popular logging services, including Logstash (http://logstash.net/) and Heka (http://hekad.readthedocs.org/en/v0.9.2/), aggregate logs. These services typically expose a port to which you can connect and stream log messages. This style of logging has been popularized in the influential Twelve-Factor App paradigm (http://12factor.net/), whose eleventh factor is “Treat logs as event streams.” As simple as all that sounds, some bugaboos arise in sending log messages as streams.
Problem
Streaming logs to a network service is error-prone, but you don’t want to lose log messages if you can avoid it.
Solution
By using Go’s channels and some buffering, you can vastly improve reliability.
Discussion
Before you can get going on the code, you need something that can simulate a log server. Although existing services such as Logstash and Heka are available, you’ll avail yourself of a simple UNIX tool called Netcat (nc). Netcat ships standard on most UNIX and Linux flavors, including OS X. A Windows version is also available.
You want to start a simple TCP server that accepts simple text messages and writes them to the console. This is a simple Netcat command:
nc -lk 1902
Now you have a listener (–l) listening continuously (-k) on port 1902. (Some versions of Netcat may also need the –p flag.) This little command will do a fine job of simulating a log server.
Now you can get some code running by adapting listing 5.2 to write to a network socket, as shown in the following listing.
Listing 5.3. Network log client

Surprisingly, little needs to be changed to write to a network connection instead of a file. Go’s network library is convenient and simple. You create a new TCP connection with net.Dial, connecting it to the port you opened with Netcat. It’s always recommended to close a network connection in a defer block. If nothing else, when a panic occurs (as it will in this demo code), the network buffer will be flushed on close, and you’re less likely to lose critical log messages telling you why the code panicked.
Again, you use the log package to log to the remote server. Using the logging package here gives you a few advantages. The first is that you get a timestamp for free, and when logging to a network server, it’s always a good idea to log the host time and not rely solely on the log server’s timestamp. This helps you reconstruct a record of events even if the log messages are delayed on their way to the log server. Second, as you can see by comparing listings 5.2 and 5.3, when you stick with the logging system, it’s trivially easy to swap out the underlying log storage mechanism. This is great for testing and running developer environments.
Did you notice that we also changed log.Fatalln to a log.Panicln in this example? There’s a simple reason for this; the log.Fatal* functions have an unfortunate side effect: the deferred function isn’t called. Why not? Because log.Fatal* calls os.Exit, which immediately terminates the program without unwinding the function stack. We covered this topic in the preceding chapter. Because the deferred function is skipped, your network connection is never properly flushed and closed. Panics, on the other hand, are easier to capture. In reality, production code for anything but simple command-line clients should avoid using fatal errors. And as you saw in the previous chapter, there are specific cases in which you should call a panic.
With all of this in mind, when you execute the preceding code, your nc instance should receive some log messages:
$ nc -lk 1902
example 2015/05/27 log_client.go:23: This is a regular message.
example 2015/05/27 log_client.go:24: This is a panic.
These messages made their way from the example client to the simple server you’re running on nc. You have a nice, simple network logging utility. But you may also have a problem here in the form of a culprit commonly known as back pressure.
Technique 24 Handling back pressure in network logging
In the previous technique, you saw how to log messages to a network server. Logging to a network offers compelling advantages:
- Logs from many services can be aggregated to one central location.
- In the cloud, servers with only ephemeral storage can still have logs preserved.
- Security and auditability are improved.
- You can tune log servers and app servers differently.
But there’s one major drawback to sending your log messages to a remote logging server: you’re dependent on the network. In this technique, you’ll see how to deal with network-based issues in logging.
Problem
Network log services are prone to connection failures and back pressure. This leads to lost log messages and sometimes even service failures.
Solution
Build a more resilient logger that buffers data.
Discussion
You’re likely to run into two major networking issues:
- The logger’s network connection drops (either because the network is down or because the remote logger is down).
- The connection over which the logs are sent slows down.
The first problem is familiar to us all and is clearly a problem to be addressed. The second is a little less obvious.
Listing 5.3 detailed a rough sequence of events. Let’s trace it out at a high level, as shown in figure 5.2. (The network mechanics are a little more complicated, but you don’t need to know them to understand the situation.)
Figure 5.2. Sending messages over TCP

Your application first opens a TCP connection, then sends messages, then closes the connection. But something you don’t see in your code is the response from the logger. This is because things are going on at the TCP layer that don’t bubble up into the application code.
Specifically, when a message is sent as a TCP/IP packet, the receiver is obligated to respond to the packet by acknowledging (ACK) that the message was received. It’s possible (and even likely) that one log message may become more than one packet sent across the network. Say a log message is split into two separate packets. The remote logger would then receive the first part and send an ACK. Then the client would send the second half, to which the logger would also send an ACK. With this system, the client gains some assurance that the data it sent was indeed received by the remote host.
That’s all well and good until the remote host slows down. Imagine a log server that’s receiving thousands of messages from many clients at once. With all of that data coming in, it may slow down. But while it slows, the quantity of logs coming in doesn’t diminish. And with TCP, the log server must send an ACK for each new message that comes in. When it delays sending the ACK, the client sits waiting. The client must slow down too, as its resources are tied up waiting for log messages to send. This is the scenario known as back pressure.
One solution to the back-pressure problem is to switch from TCP to UDP. By doing this, you get rid of connection overhead at the protocol level. And most significantly, the application doesn’t need to wait for ACK messages from the log server. Figure 5.3 illustrates this method.
Figure 5.3. UDP log messages

UDP requires no network connection maintenance. The client sends information to the server whenever it’s ready. And altering the Go code from listing 5.3 is simple, as you can see in the next listing.
Listing 5.4. UDP-based logging

The changes to the code are minimal. Instead of using the regular net.Dial, this code has net.DialTimeout, which adds a nicety to the regular net.Dial call: it specifies how long it’ll wait for the connection before giving up. You set this to 30 seconds. With TCP, the timeout includes time to send the message and receive the ACK. But with UDP, you set the timeout largely for just how long it takes your app to resolve the address and send the message. Setting a timeout gives you a little bit of a safety net when the network isn’t functioning as expected.
To run the preceding code, you also need to restart your nc server as a UDP server: nc -luk 1902.
Using UDP for logging has distinct advantages:
- The app is resistant to back pressure and log server outages. If the log server hiccups, it may lose some UDP packets, but the client won’t be impacted.
- Sending logs is faster even without back pressure.
- The code is simple.
But this route also has some major disadvantages. Depending on your needs, these drawbacks may indicate that this is the wrong route for you:
- Log messages can get lost easily. UDP doesn’t equip you to know whether a message was received correctly.
- Log messages can be received out of order. Large log messages may be packetized and then get jumbled in transition. Adding a timestamp to the message (as you’ve done) can help with this, but not totally resolve it.
- Sending the remote server lots of UDP messages may turn out to be more likely to overwhelm the remote server, because it can’t manage its connections and slow down the data intake. Although your app may be immune to back pressure, your log server may be worse off.
Based on our own experiences, UDP-based logging definitely has a time and a place. It’s quick and efficient. If you can predict with relative accuracy how much work your log server needs to do, this method provides a useful and simple path to network logging.
But a few cases might definitively tilt your decision away from UDP logging. You may not want to use UDP logging when you can’t accurately predict how much logging data will go from the app server to the log server, or when losing occasional log messages is unacceptable.
TCP logging is prone to back pressure, but UDP logging won’t guarantee data accuracy. It’s a conundrum that we’re used to dealing with from image encoding: do you want precise images at the expense of large file sizes (GIF, PNG), or compact images that lose some data (JPEG)? With logging, you may need to make a similar choice. This isn’t to say that nothing can be done to make things better. For example, backpressure stress can be delayed by creating a large buffer for logs to be temporarily stored in case of network saturation.
5.2.2. Working with system loggers
In the previous sections, we took it upon ourselves to write a logging system. In many cases, though, existing system loggers may be adequate for the task at hand. In this section, you’ll look at system loggers.
Note
Powerful third-party logging packages are available for Go. Logrus (https://github.com/Sirupsen/logrus) and Glog (https://github.com/golang/glog) are two popular examples.
The ideas behind logging have solidified over the decades, and one idea that’s now firmly entrenched in our code is the concept of assigning a log level to a message. The level indicates the importance of the information in the log message and at the same time often indicates the kind of message being logged. Typical log levels include Trace, Debug, Info, Warn, Error, and Critical, though you’ll sometimes see others including Notice, Alert, and Emergency.
Although applications may deviate from the norm, the following list represents common types of log messages that applications write, together with the typical name or names of the log level:
- Informational message —These tend to include information on the application’s current status, when it started, and when it stopped. Metrics are usually logged as informational messages too. The Info log level is designated for this kind of message.
- Problems —When an application encounters an error, the error message (and supporting information) is sent to a log. Typically, log levels are Warn, Error, and Critical, depending on severity.
- Debugging information —As developers write code, it’s often convenient to send debugging information into the log. This information is targeted specifically to the programmers (not usually the operators or sys admins). It’s assigned to the Debug log level.
- Stack dumps or deep info —Sometimes you need to get at extremely detailed information about a program. For a particularly complex portion of code, you may want to dump a stack trace or information about the goroutine. The Trace level is used for this.
Many systems, including all modern UNIX-like systems, support these log levels in the system logger. Go itself also provides a system logging library. We’ll look at that now.
Technique 25 Logging to the syslog
Logging is a well understood problem, and over the decades, standard facilities have emerged for system-wide logging. Unsurprisingly, Go includes out-of-the-box support for such facilities.
Syslogs provide some major advantages to creating your own. First, they’re mature and stable products that are optimized for dealing with latency, redundant messages, and archiving. Most contemporary system loggers handle periodic log rotation, compression, and deduplication. These things make your life easier. Additionally, system administrators are adept at using these log files for analysis, and many tools and utilities are available for working with the log files. These are compelling reasons to log to the standard facility rather than creating your own.
Problem
You want to send application log messages into the system logger.
Solution
Configure Go’s syslog package and use it.
Discussion
Go’s logging package includes support for syslogs. In fact, a dedicated package is available for this: log/syslog. The syslog package gives you two ways of working with the system log. First, you can use it as a logging back end to the logger you’ve looked at already. This is a great way of taking code that you already have and redirecting it into the syslog.
Second, you can use all of the defined log levels and facilities directly in a syslog-specific style. This second route isn’t as portable, but it’s closer to what syslog expects.
Although we’ll focus on this second method of doing things, the following listing is a quick example of generating a Go logger that’s backed to syslog.
Listing 5.5. A logger directed to syslog

When you run this code, your syslog should have a message that looks something like this:
Jun 30 08:34:03 technosophos syslog_logger[76564]: 2015/06/30
     syslog_logger.go:18: This is a test log message.
This message formatting is less than ideal, but it captures what you need to know. Let’s walk through the highlights of the code.
When you map a Go logger’s front end to a syslog back end, you need to make some simplifications. Syslog’s rich notion of facilities and priorities isn’t adequately represented in Go’s logger, so you have to specifically tell the Go logger how to set facility and severity. And unfortunately, you get to do this only once, at creation time. In this example, you tell Go where to log the messages (the LOG_LOCAL3 facility), and how important the log message is. Because you can set this only once, you set it to LOG_NOTICE, which is important enough to get it logged by default, but not important enough to trigger any alarms.
UNIX-like sysloggers (including those in Linux and OS X) rely on configuration files to indicate where the logs will be written. On a Mac, for example, the preceding messages are written to /var/log/system.log, whereas some flavors of Linux write it to /var/log/messages.
When you first create the Go logger, not only do you have to set the priority (the combination of facility and severity), but you also pass it the formatting flags that other instances of the Go logger use. For simplicity, you’ve used the same flags used in previous examples.
Now, any messages you send to the logger—regardless of their severity—will be written to the log file as notices.
Using Go’s logger is convenient, but setting the severity correctly and using more of syslog’s capabilities would be more useful. You can do that by using the log/syslog logging functions directly, as shown in the next listing.
Listing 5.6. Logging to the system log

This code sets up a system logger and then sends it messages with a variety of severity levels. Setting up the logger is straightforward. Logging locally requires you to provide two pieces of information: the facility that you want to log to (LOG_LOCAL3) and the prefix you want every message to begin with (narwhal). Normally, the prefix is the name of the service or application that’s running.
Go also provides a syslog.Dial function that allows you to connect to a remote syslog daemon. Network-attached syslog daemons are useful for aggregating logs across a variety of servers. Many times, the local syslog is proxied to such a remote server. But the syslog.Dial function is there for the occasions when you need to connect directly to a remote logging server.
The Go syslog library comes with various logging functions, most of them mapping to severity. Each call to a logging function sends the message to the system logger, which can then decide (based on its own rules) what to do with the message.
If you run the preceding example and then look at the syslog file, you should see something like this:
Jun 30 08:52:06 technosophos narwhal[76635]: Notice message.
Jun 30 08:52:06 technosophos narwhal[76635]: Warning message.
Jun 30 08:52:06 technosophos narwhal[76635]: Alert message.
The first few fields are the timestamp and hostname. Those are generated by the syslog. Next comes the label, which you set as narwhal. After that, the system adds the process ID (PID). Finally, it sends your message. The order and format of the syslog-generated fields vary depending on the configuration of the logger.
You logged four messages, but only three are displayed. The call to syslog.Debug isn’t present. The reason is that the system log used to run the example is configured to not send debug messages to the log file. If you wanted to see debug messages, you’d need to alter the configuration of your system’s syslog facility. The nice thing about this setup is that you, as the developer, don’t have to make decisions about what’s displayed and under what circumstances. You can leave that choice up to those who use the application.
This section has covered many of the common log message types, but there remains one common tool we programmers often value for debugging. Sometimes it’s handy to log a stack trace.
5.3. Accessing stack traces
Many languages provide access to the call stack. A stack trace (or stack dump) provides a human-readable list of the functions being used at the time the stack is captured. For example, imagine a program in which main calls foo, which then calls bar. The bar function then dumps a stack trace. The trace would be three calls deep, showing how bar is the current function, called by foo, which is in turn called by main.
Technique 26 Capturing stack traces
Stack traces can give developers critical insight into what’s happening on the system. They’re useful for logging and debugging. Go makes it possible to access the stack trace at any given point in program execution.
Problem
You want to fetch a stack trace at a critical point in the application.
Solution
Use the runtime package, which has several tools.
Description
Generating stack dumps in Go isn’t a particularly difficult exercise when you know how to do it. But how to get one seems to be a commonly asked question. If all you need is a trace for debugging, you can easily send one to Standard Output by using the runtime/debug function PrintStack, as the next listing shows.
Listing 5.7. Print stack to Standard Output

Running the code prints a stack trace like this:
$ go run trace.go
/Users/mbutcher/Code/go-in-practice/chapter5/stack/trace.go:20 (0x205b)
     bar: debug.PrintStack()
/Users/mbutcher/Code/go-in-practice/chapter5/stack/trace.go:13 (0x203b)
     foo: bar()
/Users/mbutcher/Code/go-in-practice/chapter5/stack/trace.go:9 (0x201b)
     main: foo()
/usr/local/Cellar/go/1.4.2/libexec/src/runtime/proc.go:63 (0x12983)
     main: main_main()
/usr/local/Cellar/go/1.4.2/libexec/src/runtime/asm_amd64.s:2232 (0x37711)
     goexit:
This can be helpful for simple debugging cases. But if you want to capture the trace to send it somewhere else, you need to do something slightly more sophisticated. You can use the runtime package’s Stack function, shown in the next listing.
Listing 5.8. Using the Stack function

In this example, you send the stack to Standard Output, but you could just as easily log or store it. Running this code produces output like this:
$ go run trace.go
Trace:
 goroutine 1 [running]:
main.bar()
     /Users/mbutcher/Code/go-in-practice/chapter5/stack/trace.go:18 +0x7a
main.foo()
     /Users/mbutcher/Code/go-in-practice/chapter5/stack/trace.go:13 +0x1b
main.main()
You may notice that this version is shorter than the other. The lower-level system calls are left out of Stack’s data. We have a few quick things to point out about this code.
First, with Stack, you must supply a presized buffer. But there’s no convenient way to determine how big the buffer needs to be to capture all of the output. (And in some cases, the output is so big that you might not want to capture it all.) You need to decide ahead of time how much space you’d like to allocate.
Second, Stack takes two arguments. The second is a Boolean flag, which is set to false in this example. Setting it to true will cause Stack to also print out stacks for all running goroutines. This can be tremendously useful when debugging concurrency problems, but it substantially increases the amount of output. The trace of the preceding code, for example, runs an entire printed page.
If all of this isn’t sufficient, you can use the runtime package’s Caller and Callers functions to get programmatic access to the details of the call stack. Although it’s quite a bit of work to retrieve and format the data, these functions give you the flexibility to discover the details of a particular call stack. Both the runtime and the runtime/debug packages contain numerous other functions for analyzing memory usage, goroutines, threading, and other aspects of your program’s resource usage.
In the last part of this chapter, we switch from debugging to testing.
5.4. Testing
Testing and debugging are exercises that require learning the details about a program. But whereas debugging is reactive, testing is proactive. This section covers a few strategies for making the most of Go’s testing tools.
We see two common mistakes when programmers are learning to test Go code. The first is to try to put the test files in their own directory. Popular testing tools in other languages do this, but Go doesn’t. Test files belong in the same directory as the code they test.
The second mistake is to try to put the tests in a different package (package hello_test or something similar). Tests should go in the same package as the code they test. This makes it possible to test unexported code as well as just the public API.
5.4.1. Unit testing
Writing tests alongside your code has become a standard software development practice. Some software development strategies (such as test-driven development) even hinge on the authoring of test cases.
Most introductions to the Go language explain how to write tests by using the built-in tools. Go was designed with testing in mind, and includes tooling for running tests inside projects. Any Go source file that ends with _test.go is treated as a test file. The tool go test is used to run these tests.
Within _test.go files, you can write functions that begin with Test and that take a single parameter of type *testing.T. Each function will be executed as a unit test. Say you have a source file called hello.go. This file contains a single function, Hello, that returns the string hello, as shown in the following listing.
Listing 5.9. A Simple hello
package hello

func Hello() string {
     return "hello"
}
To write a test for this simple function, create a file called hello_test.go and add tests there, as shown in the next listing.
Listing 5.10. A hello test

This example points out the earmarks of a typical Go test. Go doesn’t include a lot of assertion tools like other testing frameworks (though libraries are available for this). But the testing.T object supplies functions for reporting unexpected conditions. The most frequently used functions on testing.T are as follows:
- T.Error(args ...interface{}) or T.Errorf(msg string, args interface{})—These log a message and then mark the test as failed. The second version allows formatting strings, as shown in listing 5.10.
- T.Fatal(args ...interface{}) or T.Fatalf(msg string, args interface{})—These log a message, mark the test as failed, and then stop the testing. You should do this whenever one failed test indicates that no others will pass.
Various other functions are available as well, designed to make it possible to skip tests, to fail immediately, and so on. With this in mind, let’s look at a few techniques for testing.
Technique 27 Using interfaces for mocking or stubbing
Go’s type system focuses on composition rather than inheritance. Instead of building large trees of object types, the Go developer creates interfaces that describe desired behavior. Anything that fulfills the interface type can be considered to be of that type. For example, one of the most commonly used interfaces is called io.Writer. It looks like the following listing.
Listing 5.11. The stringer interface
type Writer interface {
        Write(p []byte) (n int, err error)
}
The io.Writer interface applies to anything that can write a sequence of bytes according to the preceding signature. The os.File type and the net.Conn type both implement io.Writer, as do many other types. One of the best parts of Go’s type system is that the implementing type doesn’t need to explicitly declare which interfaces it satisfies (though documenting these isn’t a bad idea). You may even choose to declare an interface that matches some properties of an existing type, and thereby create a useful abstraction. Nowhere is this more useful than when testing.
Problem
You’re writing code that depends on types defined in external libraries, and you want to write test code that can verify that those libraries are correctly used.
Solution
Create interfaces to describe the types you need to test. Use those interfaces in your code, and then write stub or mock implementations for your tests.
Discussion
Say you’re writing software that uses a third-party library that looks like the following listing.
Listing 5.12. The message struct
type Message struct {
     // ...
}

func (m *Message) Send(email, subject string, body []byte) error {
     // ...
     return nil
}
This describes some kind of message-sending system. In your code, you use that library to send a message from your application. In the course of writing your tests, you want to ensure that the code that sends the message is being called, but you don’t want to send the message. One way to gracefully deal with this is to write your own interface that describes the methods shown in listing 5.12, and have your code use that interface in its declarations instead of directly using the Message type, as the following listing shows.
Listing 5.13. Use an interface

Because you’ve created an abstraction from Message to Messager, you can easily write a mock and use that for your testing, as shown in the next listing.
Listing 5.14. Testing with a mock
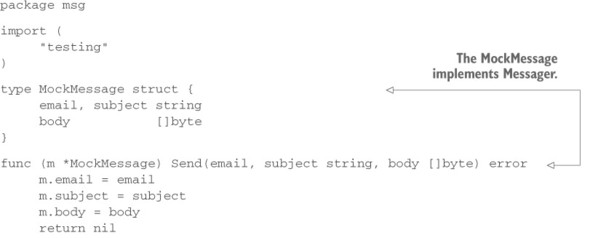

You implement the Messager interface with the MockMessage type. That type provides the same functions that your production code uses, but instead of sending the message, it stores the data. You can then conveniently test that the information sent to the Messager is indeed what you expect.
This is a simple and powerful technique for writing good tests. As an additional bonus, abstracting with interfaces in this way makes it easier to later change implementations. The pattern lends itself to modular programming.
Technique 28 Verifying interfaces with canary tests
The preceding example illustrated a technique that relies on using interfaces to describe an existing set of functions. Sometimes, though, subtle errors in interface definitions may cause runtime headaches. This is especially true when you’re either relying on type assertions or using external libraries whose function signatures change often. One trivially simple testing technique can save you some needless headaches.
Ideally, after an interface is exported and made public, it shouldn’t be changed. But in the world of software development, this expectation isn’t always met. Library authors do occasionally change interfaces to fix poor design or to add new features. These days, it’s considered okay to change interfaces as long as you indicate this by increasing the major version number of your program (for example, 1.2.3 becomes 2.0.0). Be aware, though, that many projects—including some major ones—don’t follow this recommendation.
Problem
You want to make sure that the interfaces you’re defining describe the things that you’re intending to describe. This is useful in four cases:
- When you’re exporting types that implement external interfaces.
- When you create interface types that describe external types.
- When you rely on external interfaces, and those interfaces change (even though by convention, they shouldn’t).
- When use of that interface is restricted to type assertions. (We give an example of this next.)
Solution
Write type-assertion “canary” tests that will fail quickly if you made a mistake on your interface definition.
Discussion
When you’re writing interfaces or implementations of interfaces—especially in cases where type information is resolved at runtime—it’s helpful to write simple type-assertion canary tests that will explode at compile time.
Say you’re writing a customer writer that implements io.Writer. You’re exporting this in your library so that other code may use it. Your implementation looks like the following listing.
Listing 5.15. MyWriter
type MyWriter struct{
     // ...
}

func (m *MyWriter) Write([]byte) error {
     // Write data somewhere...
     return nil
}
This code looks pretty straightforward, and at a quick glance, it looks like it implements io.Writer. Now imagine using this code with a type assertion, as shown in the next listing.
Listing 5.16. Asserting a writer

This code compiles just fine. And if your test coverage is thorough, it might even pass that, too. But something is wrong.
You can write a quick canary test to see this. A canary test (deriving its name from the “canary in the coal mine” story) is a test designed to alert you of basic failures in your assumptions. The next listing shows a canary test for whether MyWriter is an io.Writer.
Listing 5.17. Canary test of MyWriter

This is a simple test. You don’t even have to run the test to cause it to fail. The compiler will fail before the binary can ever be built:
$ go test
# _/Users/mbutcher/Code/go-in-practice/chapter5/tests/canary
./canary_test.go:15: cannot use MyWriter literal (type *MyWriter)
     as type io.Writer in assignment:
     *MyWriter does not implement io.Writer (wrong type for Write method)
            have Write([]byte) error
            want Write([]byte) (int, error)
FAIL _/Users/mbutcher/Code/go-in-practice/chapter5/tests/canary
[build failed]
The test fails because your Write method doesn’t match the signature of io.Writer’s Write([]byte) (int, error). The compilation error tells you exactly how to fix your writer to match the interface you intended to match. Some interfaces are more complex than io.Writer, and it’s with these that you tend to benefit most when writing canary tests.
The last technique showed how to create interfaces to describe existing types. That strategy is great for generalizing testing. But creating an interface to match an existing type is another example of a case where a canary test might be useful. By canary testing your interfaces, you’ll catch cases where the external library author changes a function signature.
5.4.2. Generative testing
Generative testing is a large and complex topic. But in its most basic form, generative testing refers to the strategy of automatically generating test data in order to both broaden the information tested and overcome our biases when we choose our test data.
Problem
You want to bulletproof your code against surprising edge cases.
Solution
Use Go’s testing/quick package to generate testing data.
Discussion
Go has a testing package that’s frequently overlooked. The testing/quick package provides several helpers for rapidly building tests that are more exhaustive than usual. These tools aren’t useful in all cases, but sometimes they can help you make your testing process more reliable.
Say you have a simple function that pads a given string to a given length (or truncates the string if it’s greater than that length). The function looks like the next listing.
Listing 5.18. A padding function

Normally, you’d be inclined to write some simple tests for this function, perhaps like the following listing.
Listing 5.19. Simple pad unit test
func TestPad(t *testing.T) {
     if r := Pad("test", 6); len(r) != 6 {
            t.Errorf("Expected 6, got %d", len(r))
     }
}
Unsurprisingly, this test passes. But this is a great function to test with a generator. You know that regardless of the string that’s passed in, you always want a string of exactly the given length. Using the testing/quick function called Check(), you can test a much broader range of strings (including those that use characters you might not have thought to test), as shown in the next listing.
Listing 5.20. Generative test for pad

The "testing/quick".Check function is the heart of your test. It takes a function that you’ve defined and an optional configuration, and then constructs numerous tests. It does this by introspecting the function’s parameters and then generating random test data of the right parameter type. If you wanted to test longer strings, for example, you could change your fn function to take a uint16 instead of a uint8.
If you run this test, you’ll discover a bug in the original code:
$ go test
2015/07/21 09:20:15 Testing Len: 6, Str: test
2015/07/21 09:06:09 Testing Len: 32, Str: XXXXXXXXXXXXXXXXXXXXXXXXXXXXXXXXXX
--- FAIL: TestPadGenerative (0.00s)
     generative_test.go:39: #1: failed on input "U000305eaU000664e9U000cbd92U00091bbfU0010b40dU000fd581...", 0x20
FAIL
exit status 1
FAIL _/Users/mbutcher/Code/go-in-practice/chapter5/tests/generative
0.005s
What happened? One of the strings that was generated was longer than its maximum length, which kicked off the truncation code (listing 5.17) that your previous test didn’t account for. You accidentally sliced incorrectly—s[:max-1] should be s[:max] because you’re giving it a length, not an index. After you’ve fixed that, rerunning the test should show many tests using randomly generated values.
If the values are randomly generated, why do you get the same strings when you run the test repeatedly? Go doesn’t automatically seed the "math/rand".Rand generator each time it runs. If you want different data each run, you can pass a seeded random generator by using "testing/quick".Config. This is a good way to increase test data coverage, but it comes at the cost of repeatability. If you do hit a failure, you’ll need to make note of the data that caused the error because it may not come up again for a long time.
Go’s quick testing package comes with other utilities. Most of these are designed to help you quickly generate test data, as in the preceding example. Go’s generator is good enough that it can extend beyond simple types like integers and strings, and even generate random struct instances.
5.5. Using performance tests and benchmarks
Which is faster: the path-matching package or a custom-written regular expression to patch paths? How is that fan-out pattern working in practice? Why is my HTTP server so slow? One of the frequent tasks of the seasoned programmer is to identify and fix performance issues with code. Once again, Go provides some useful tools.
Nestled inside Go’s testing package are some performance-testing features designed to repeatedly run pieces of code and then report on their efficiency.
Technique 29 Benchmarking Go code
In this technique, you’ll learn how to use the testing.B benchmarking tool to test the efficiency of a piece of code.
Problem
You have code paths for accomplishing something, and you want to know which way is faster. Is it faster to use text/template for formatting text, or just stick with fmt?
Solution
Use the benchmarking feature, testing.B, to compare the two.
Discussion
Benchmarks are treated similarly to tests. They go in the same _test files that unit tests and examples go in, and they’re executed with the go test command. But their construction differs.
In the next listing, let’s write a benchmark designed to zero in on the average time it takes to compile and run a simple text template.
Listing 5.21. Benchmark template compile and run

Just as tests are prefixed with Test, benchmarks should be prefixed with Benchmark. And instead of receiving a *testing.T, a benchmark receives a *testing.B. Although the *testing.B instance has many of the same methods as a *testing.T, it also has several properties specific to benchmarking. The most important is the N struct member. This is used in the preceding code as the upper limit on a loop. This is the key to benchmarking. Every benchmark should iterate to the *b.N point. The benchmarking tool repeatedly runs the same test and attempts to gain meaningful insight into the performance of the code by varying the number of times the test is run.
If you run this code, you’ll see this:
$ go test -bench .
testing: warning: no tests to run
PASS
BenchmarkTemplates       100000          10102 ns/op
--- BENCH: BenchmarkTemplates
     bench_test.go:10: b.N is 1
     bench_test.go:10: b.N is 100
     bench_test.go:10: b.N is 10000
     bench_test.go:10: b.N is 100000
ok      /Users/mbutcher/Code/go-in-practice/chapter5/tests/bench     1.145s
To run benchmarks, use the go test tool, but pass it –bench PATTERN, where PATTERN is a regular expression that matches the benchmarking functions you want to run. The dot (.) tells the benchmarker to run all of the benchmarks.
The preceding output tells you that the test was run with a maximum number of 100,000 iterations and that each run through the loop averaged 10,102 nanoseconds. Because you included Printf, you get a little extra visibility into how the benchmarking works. It begins with a low value for b.N: 1. Then it raises the value of b.N (not always exponentially) until the algorithms in the benchmarking suite settle in on an average.
Listing 5.20 runs only one benchmark, and on some code that you might be able to easily optimize. Let’s expand and add an extra test in the following listing.
Listing 5.22. Two template benchmarks


The second benchmark, BenchmarkCompiledTemplates, compiles the template once and then executes it multiple times. You can guess that this optimization reduces runtime, but how much?
$ go test -bench .
testing: warning: no tests to run
PASS
BenchmarkTemplates       200000          10167 ns/op
--- BENCH: BenchmarkTemplates
     bench_test.go:10: b.N is 1
     bench_test.go:10: b.N is 100
     bench_test.go:10: b.N is 10000
     bench_test.go:10: b.N is 200000
BenchmarkCompiledTemplates      1000000           1318 ns/op
--- BENCH: BenchmarkCompiledTemplates
     bench_test.go:23: b.N is 1
     bench_test.go:23: b.N is 100
     bench_test.go:23: b.N is 10000
     bench_test.go:23: b.N is 1000000
ok       _/Users/mbutcher/Code/go-in-practice/chapter5/tests/bench     3.483s
These results show that reusing the compiled template shaves almost 9,000 nanoseconds off the average loop iteration. It runs in one-tenth the original time! The benchmarking package provides other features that can assist in creating good benchmarks. Here you’ll look at another benchmarking technique for testing concurrency.
Technique 30 Parallel benchmarks
One of Go’s strongest points is its goroutine model of concurrent programming. But for any given piece of code, how can you tell how well it will perform when spread out over multiple goroutines? Again, the benchmarking tool can help you here.
Problem
You want to test how a given piece of code performs when spread over goroutines. Ideally, you want to test this with a variable number of CPUs.
Solution
A *testing.B instance provides a RunParallel method for exactly this purpose. Combined with command-line flags, you can test how well goroutines parallelize.
Discussion
Beginning with listing 5.21, you can fashion the template test into a parallel test. Instead of executing the body of a loop, the testing framework executes a function repeatedly, but as separate goroutines, as shown in the following listing.
Listing 5.23. Parallel benchmarking

Most of our testing code remains unchanged. But instead of looping over a call to t.Execute(), you segment the code a little further. Running RunParallel runs the closure on multiple goroutines. Each one receives an indication, through pb.Next(), as to whether it should continue iterating. (Again, the looping feature is required.) This code example is almost the same as the one included with the Go documentation.
Now you need to run it. First, you’ll run it alongside our other two examples (though with the Logf() functions removed). And you’ll run it on only one CPU, which is the default:
$ go test -bench .
testing: warning: no tests to run
PASS
BenchmarkTemplates               200000          10695 ns/op
BenchmarkCompiledTemplates      1000000           1406 ns/op
BenchmarkParallelTemplates      1000000           1404 ns/op
ok      _/Users/mbutcher/Code/go-in-practice/chapter5/tests/bench    5.097s
Your parallel version didn’t outperform the regular version. Why? Because the goroutines were all run on the same processor. Let’s specify that you want to see the testing tool run several versions of the same code, using a different number of CPUs each time:
$ go test -bench . -cpu=1,2,4
testing: warning: no tests to run
PASS
BenchmarkTemplates               200000             10019 ns/op
BenchmarkTemplates-2             100000             14033 ns/op
BenchmarkTemplates-4             100000             14971 ns/op
BenchmarkCompiledTemplates      1000000              1217 ns/op
BenchmarkCompiledTemplates-2    1000000              1137 ns/op
BenchmarkCompiledTemplates-4    1000000              1307 ns/op
BenchmarkParallelTemplates      1000000              1249 ns/op
BenchmarkParallelTemplates-2    2000000               784 ns/op
BenchmarkParallelTemplates-4    2000000               829 ns/op
ok   _/Users/mbutcher/Code/go-in-practice/chapter5/tests/bench  14.993s
In this run, you specify –cpu=1,2,4, which tells go test to run the tests with one, two, and then four CPUs, respectively. It runs each test this way and prints the results, appending –N to indicate when more than one processor was used.
Unsurprisingly, your earlier nonparallel tests don’t perform any better when using more CPUs. With only one main goroutine running, there’s no optimization to be had. A noticeable hit occurs, due to the higher accounting overhead of multiple CPUs, but that disappears when you look at the results of BenchmarkParallelTemplates. There, you drop about a third of the time off when you spread processing over multiple CPU cores. The slightly higher time for the four cores, compared to two, may indicate that locking slows you down ever so slightly.
What if you make a naïve mistake, though, and try a quick optimization?
Technique 31 Detecting race conditions
When attempting to parallelize processing with multiple goroutines and multiple CPUs, you run the possibility of accidentally accessing things in the wrong order. A race condition occurs when two or more goroutines attempt to modify the same piece of information at about the same time. If the execution order differs from what you intend, the result may be surprising. And these conditions are often hard to diagnose. But Go includes a race detection tool, and the preceding parallel benchmark technique provides an opportunity to try it.
Problem
In programs with many goroutines, race conditions could occur. Being able to test for this possibility is desirable.
Solution
Use the –race flag (sometimes called go race or grace).
Discussion
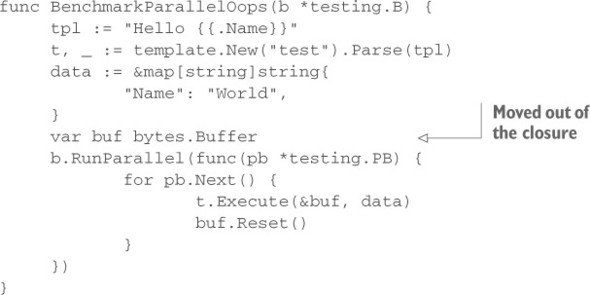
Let’s begin with listing 5.22 and make an ill-conceived performance optimization. Instead of declaring a new buffer for each goroutine, let’s share one in the following listing. This will reduce the allocations your tested code has to perform.
Listing 5.24. Benchmarks and race conditions
Now let’s run that code sample. It’s likely that the parallel benchmark will fail:
$ go test -bench Oops -cpu=1,2,4
testing: warning: no tests to run
PASS
BenchmarkParallelOops      1000000           1371 ns/op
BenchmarkParallelOops-2     panic: runtime error: slice bounds out of
     range [recovered]
     panic: runtime error: slice bounds out of range

goroutine 26 [running]:
text/template.errRecover(0x208355f40)
     /usr/local/Cellar/go/1.4.2/libexec/src/text/template/exec.go:100 +0xbc
bytes.(*Buffer).Write(0x2082e2070..., 0x0)
...
A look through the stack trace gives a few clues about what happened, but the real underlying cause isn’t clear. If you add the –race flag onto the testing call, Go instruments for race conditions, and the information you receive is much more helpful:
$ go test -bench Oops -race -cpu=1,2,4
testing: warning: no tests to run
PASS
BenchmarkParallelOops       200000           5675 ns/op
BenchmarkParallelOops-2     ==================
WARNING: DATA RACE
Write by goroutine 20:
  bytes.(*Buffer).Write()
      /usr/local/Cellar/go/1.4.2/libexec/src/bytes/buffer.go:126 +0x53
      text/template.(*state).walk()
      /usr/local/Cellar/go/1.4.2/libexec/src/text/template/exec.go:182 +0x401
      text/template.(*state).walk()
...
Now the cause is much clearer: more than one thing tried to use the bytes.Buffer at once. Reading through more of the special race condition stack trace will even show where the race occurs. Multiple goroutines are writing at the same time. From here, you have the options of stepping back to the older method or using a sync.Mutex to lock and unlock access around the buffer.
This illustration is a good example of a race failure. It’s easy to reproduce. But many other race conditions are less predictable. The race may manifest negatively only on occasion, which makes detecting and debugging difficult. That’s where using the –race flag becomes handy. You can use it not only on benchmarks (which is a great place), but also with go run and all calls to go test.
5.6. Summary
This chapter has covered techniques for debugging and testing your Go programs. You’ve looked at logging tools, stack tracing, unit testing, and benchmarking. All of these are fundamental tools for writing production-grade Go code.
The chapter covered the following topics:
- Logging over the network
- Working with the Go log package
- Capturing stack traces
- Using Go’s pattern for writing unit tests
- Benchmarking with Go’s testing tools
- Performing basic generative testing
- Detecting race conditions
In the coming chapters, the techniques you learned here will shape the way you write your code.