
Creating a Google Analytics account
Configuring your Web site for analysis
Setting goals to achieve
Focusing your Analytics data using filters
Seeing the Analytics results
The best way to know what’s happening on your Web site is to analyze the information Google makes available to you through the Google Analytics product. You can learn important information about how people are using your Web site and see what pages they visit and for how long and what they are doing on those pages. You no longer have to rely on endless Web server log files and meaningless hit counters.
Google purchased an expensive product in 2005 and, like so many other of its products, made it freely available. With Google Analytics, you can find out how well your AdWords are working to bring people to your site.
Cross-Ref
See Chapter 34 for more about AdWords.
By adding a small amount of Javascript code to each of the Web pages you want analyzed, Google can track statistics about visits to those Web pages. The statistics are stored on the Google Analytics site indefinitely for your analysis using the Google Analytics tools. The following information is sent to Google about the page visit:
The IP address of the computer visiting your page, which is important for information about the geographic location of the user
The Web browser the visitor is using: Internet Explorer, Firefox, Opera, AOL, and so on
The page request history, made possible by a cookie on the visitor’s site and telling you how long the visitor was on each page and the path he took through your site
Imagine being able to know how many of the visitors to your site used the Firefox browser. This can help Web developers decide which technologies are best used to display content. Each browser has advantages and deficiencies. Now you can take advantage of that knowledge in planning future technology decisions.
Knowing the geographic location patterns of your site’s visitors tells you whether your AdWords targets are working. When you purchase AdWords ads in Google Search, you can specify geographic locations. If you specify St. Louis but most of your visitors are from Nashville, you may have some issues to deal with. Perhaps you could take advantage of the Tennessee interest in your site and switch your advertising. Remember, it’s always easier to take something that is already working and make it work better than it is to take something not working and make it work.
It’s important to know the path the user takes through your site. You need to find out if people who purchase your products leave after visiting the Thank You page and whether they ever return, and you want to find out the time duration between visits to your site. Are people visiting every day? Do they wait six months between visits? Find out how well your attempt to get people to continue using your site after shopping is working. Learn which paths people take from your home page. You may be surprised to learn that people are landing on pages other than your home page as their first page. Often articles and important information indexed in Google causes people to visit your site. You want to know if this informational page leads them to visit the rest of your site. Answer these questions and many others by using the powerful Analytics reporting tools. But first, you need to sign up.
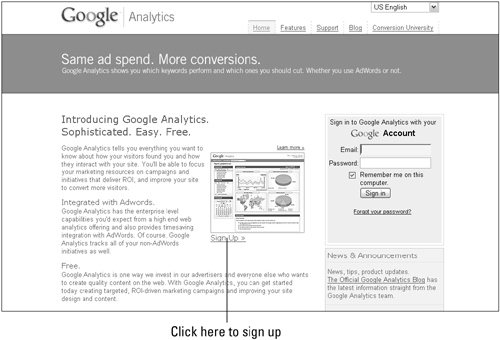
Point your Web browser to www.google.com/analytics, and click the Sign Up link, as shown in Figure 36.1. If you are not already signed in to your Google Account, you are prompted to do so. This launches a short page of information where Google tells you that to improve the return on your investment, it wants to help you bring more of the visitors you really want to your Web site.
The next step is to again click Sign Up, which launches the New Account Setup Wizard. Begin by typing the URL of your Web site, the name of the account, your country or territory, and the time zone of your site.
Note
Google tracks only the first 5 million visitors to your site unless you have an active AdWords account. In that case, Google Analytics tracks an unlimited number of visitors.
Enter the time zone of the location of your Web server. This may be different than your location. The reason for entering the Web server’s time zone and not your own (unless they are the same) is that you’ll want to know what times of day people are visiting your site. If your visitors all arrive at approximately the same time, you may want to consider ways to distribute the Web server load during that peak time. You don’t want the visitor experience to be one of a slow-loading site. You also can see what times of day people are visiting from different geographic locations. For sites with worldwide appeal, you can see when visitors from around the globe are checking out your site.
The next step in the setup wizard asks you to type your last and first names, your phone number, and your country or territory selected from a drop-down list. Clicking Continue brings you to the page where you must read and agree to the terms and conditions by selecting the check box. Click Create New Account when you are ready.
You are then presented with the Javascript code that you need to copy and paste into the HTML of each of the Web pages you want to track. Paste this code just before the end of the page, right before the </BODY> tag. It should appear as the last thing in the Web page.
You can check the status of your code installation by logging in to Google Analytics and clicking Check Status found on the Analytics Settings page. This validates the Javascript found in the pages installed on your site. After your pages have been verified, you see a notice at the top of the Analytics Settings page that tells you that Analytics has been successfully installed and it is waiting for data.
Now, be patient. Your Google Analytics reports are updated every 24 hours. So you can’t instantly see reports after adding your Javascript code. Check back in 24 hours.
You can have many Web site profiles. When you first start out adding Analytics to a single site, one profile appears in the Profile Manager. If you add Analytics tracking for more than one domain, click the Add Website Profile link at the top left of the Website Profiles box and follow these steps:
Select Add a profile for a new domain.
Type the URL of the new domain. Do not type individual subdirectory names.
Enter the country in which the Web server is located.
Enter the time zone of your Web server.
Click Finish.
After you finish adding the new domain, you see it listed in the Website Profiles box, as shown in Figure 36.2.
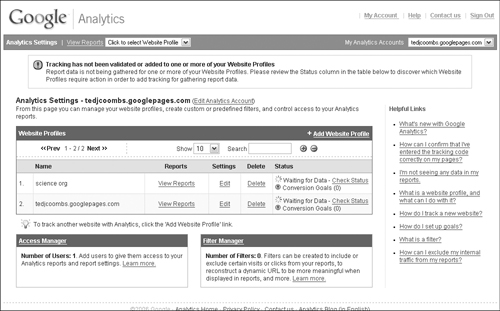
You can add a profile for either a new or an existing domain name. You may want to create additional profiles for existing domain names in order to specify different goals and provide different filtering. There is more on goals and filtering to come.
Each profile has a status listed in the Website Profiles box. After you install your Javascript for a profile, the status should read Waiting for Data. Check the status of the profile. You will find one of the status messages listed below:
Waiting for Data: A new installation is waiting to receive data.
Tracking Not Installed: The tracking code cannot be detected.
Receiving Data: A healthy installation is sending data to Analytics.
Tracking Unknown: There is an unknown reason why Analytics is not receiving data. Perhaps the Javascript was incorrectly installed.
For additional information about troubleshooting sites that don’t send data, visit the Analytics Help center at www.google.com/support/analytics/.
Click the Edit link next to the profile name to edit important profile features. You are redirected to the Profile Settings page, the top portion of which displays information about the URL.
Most importantly, when you edit the profile, you can set conversion goals. You can set up to four goals for each profile. The goals are labeled G1 through G4. You can see in the table a column labeled Active Goal that tells you which goals are off and which are on.
Goals are reached when someone lands on a particular page, for example, the Thank you for shopping my business page or a checkout page. On non-e-commerce Web sites, the goal page might be when someone visits the page that explains your services or displays a list of your products. When you set up a goal, the first step is to type the URL of the goal page. Then you give the goal a meaningful name such as Purchase or Ad View. Select whether the goal is active by selecting the option button. You may want to create goals that you turn on and off depending on seasonal changes in your Web site. You can then optionally define one or more funnels.
Funnels are lists of URLs that a visitor to your site travels along to reach your destination page. This helps you determine when and where people fall out of the funnel on their way to the goal. A good example of a Web site that has this type of funnel is the Kelly Blue Book site at www.kbb.com. To see the current value of a new or used car, you must take several steps in defining the vehicle make, model, condition, features, and so on. If your site uses a number of steps like this to reach its ultimate goal, you may want to create a tracking funnel so you can see where people lose interest or where ads placed on pages pull users away from the goal.
When you edit a goal, you find a section labeled Define Funnel (optional). You can define up to ten steps to reach your goal. More than ten steps is probably excessive, and you should consider combining steps. Type the URL of the page that defines the first step, and then give it a friendly name by which you can refer to it later, for example, LOGIN. You can then tell Google if this is a required step by selecting the Required step check box. For example, if you require someone to log in before he can take the next step, then perhaps the page he reaches after a successful login defines the first step, so you would select Required step.
After someone logs in, he may enter the funnel toward the goal. For example, a funnel may define a wizard that someone uses to define a product or service. The goal might be the purchase of the product or service or a request for more information.
Continue adding URLs that define steps toward the goal, giving each step a friendly name. When you complete the list of URLs, you can establish these additional settings:
Case sensitive: URLs typed by the user must conform to a specific uppercase or lowercase, or they are not considered in the funnel. This keeps users from typing URLs to enter the funnel and having it appear as though they entered the funnel.
Match Type: Use one of these match types:
Exact Match
Head Match
Regular Expression Match
Goal value: Set a fixed value for reaching the goal. You also can set a variable value for use with shopping carts. When tracking e-commerce values, leave the Goal value blank.
Save your funnel, and it appears listed below your goals. You can create several funnels for tracking different paths through your Web site.
Using Google Analytics to track your e-commerce transactions can provide an extremely powerful reporting tool to your Web-based business. Detailed financial history can be tracked against Web site performance and geography. For example, you can find out what area of the country is spending most of the money on your site and which of your pages interests your customers the most.
Enabling e-commerce tracking on your site is a two-step process. To begin, follow these steps:
Log in to your Analytics account.
Find the profile you want to track, and click the Edit link.
On the Profile Settings page, click the edit link along the top of the Main Website Profile information.
Select Yes next to E-Commerce Website. You may notice that in the Available Reports section the E-Commerce Analysis report is selected.
Click the Save Changes button.
You have completed the first step. To continue, you must be able to edit your e-commerce Web pages so that you can include special Javascript tracking code into the receipt page. The simplest way to add this code is to place the following into the HTML of your receipt Web page.
Tip
Your receipt may be generated by scripts and may not appear as a separate Web page. If that is the case, you need to edit the script that generates the receipt to write this code into the body of the receipt page.
<script src="http://www.google-analytics.com/urchin.js"
type="text/javascript">
</script>
<script type="text/javascript">
 _uacct="UA-xxxx-x";
 urchinTracker();
</script>
The _uacct="UA-xxxx-x" in the preceding code needs to be replaced with your actual Analytics account number. You can find this in the tracking script that you added to each of your pages. You aren’t finished editing the HTML code, however. You next need to add an invisible form.
Next, somewhere in the receipt below the tracking code, the following lines need to be written by your engine. Everything in italics should be replaced by actual values, as described in the Parameter Reference that follows.
<form style="display:none;" name="utmform">
<textarea id="utmtrans">UTM:T|order-id|affiliation|
total amt|tax amt|shipping amt|city|state|country UTM:I|order-
id|product id/sku|product name|category|price|
quantity </textarea>
</form>
The form is made invisible by setting the display parameter to none. The invisible form is then named utmform.
The form is written in a single textarea tag and begins with a single transaction line, starting with UTM:T. The order-id is your company’s identification for this order. You also can set an optional partner affiliation field. If you don’t set this, you still need to leave this place blank like this: | |.
Type the total amt of the transaction, making certain not to use commas in the number. Type the tax amt and shipping amt. These may be zero based on whether you are charging tax or shipping. Type the city, state, and country associated with this order. Google does not need an exact address, only a general location for geographical tracking. These parameters should all appear on a single line in your text area. This ends the transaction line portion. You should now enter as many line transactions UTM:I as you have items in the transaction, one per line.
For each item line, type the order-id, which should match the order-id in the transaction line. Next, type the product id/sku. This is your company’s product identification or stock keeping unit. Follow this with the actual text name of the product, Rubbon Hair Gel, for example. Type a category for your product if it has one. Type the unit price and the quantity ordered.
After the form is submitted, you must take one additional step in the next page, calling a special function that records the transaction. This is called the utmSetTrans function. You can set this function in two different ways. The simplest is placing a call to this function in the <body> tag of the Web page loaded after the form submission. It should look like this:
<body onLoad="javascript:__utmSetTrans()">
Another way you can call the utmSetTrans function is by creating a separate Javascript tag making certain it is called after the form:
<script language="text/javascript">
__utmSetTrans();
< /script>
This completes the setup necessary for e-commerce tracking. It’s a little complex, and if you are not comfortable with script programming, you may need to enlist assistance in this step. It’s worth it for the value you receive from Analytics.
You can apply filters to profiles to help narrow the area of analysis to specific areas of your Web site, include otherwise excluded matching clicks, or make dynamic URLs more meaningful in Analytics reports. In the Analytics Setting section, find the subsection labeled Filters Applied to Profile. Click the + Add Filter link along the top bar of this section to get started.
In the Add Filter to Profile page, begin by selecting whether to apply a new filter or an existing filter to your profile by selecting one of the option buttons.
Follow these steps to begin creating a new filter:
Select Add New Filter for Profile.
Type a meaningful name for your filter in the Filter Name box. Create a name that explains your filter and remember that you can use it later to filter other profiles.
Select the type of filter you want to create. These are the Filter type choices:
Exclude all traffic from a domain
Exclude all traffic from an IP address
Include only traffic to a subdirectory
Custom filter
Specify a domain name as a regular expression. Regular expressions are phrases containing special characters that build matches. Matches are simply when two separate phrases somehow match each other. The special characters included in a regular expression are called wild cards.
Wild cards are named for the special cards like the Joker in playing-card games. When you say, “Deuces are wild.” you are saying that all the 2 cards can represent any card you want them to represent. For example, *.JPG represents all filenames ending in .jpg. The * is a wild card used to represent all possibilities. So,
myfile*.JPGis a regular expression that matches when filenames begin withmyfile, followed by all possibilities, and ends with.JPG. There are several other characters used by Analytics to build regular expressions. They are explained in Table 36.1.Table 36.1. Wild Cards for Regular Filter Expressions
Character
Description
.
Match to any other single character
*
Match to zero or more of the previous items
+
Match to one or more of the previous items
?
Match to zero or one of the previous items
()
Designate contents of parentheses as an item
[]
Match to an item in this list
-
Creates a range in a list
|
Logical OR match if this matches OR that matches
&
Logical AND match only if this matches AND that matches
^
Anchor character—match all to the beginning
$
Anchor character—match all to the end
/
Escape character used to include literal character such as the . (dot) in a domain name
Note
It has been said that, “Regular expressions are a means by which IT people confuse non-IT people.”
An important character you must know about when building filters is the escape character—the forward slash. You must use the escape character / to specify periods (“dots”) in a domain name, or IP address. For example, www/.mydomain/.com or 192/.168/.120/.151. You must use the escape character to identify the literal period because the dot has a special meaning in regular expressions. It means “match any other single character.”
The domain name or IP address you type in this form represents the domain from which you want data included or excluded. Remember to use the escape character to escape periods. This is required.
Entire books have been written about building regular expressions. It takes some work to become comfortable creating these expressions. Be patient and experiment creating your filter expressions. One of the common filter expressions you may want to create is one that filters out all the hits from your own domain. Hits from your own domain may not accurately represent true traffic patterns to your site or may include testing data.
For more information about regular expressions, you can read the Wikipedia page at http://en.wikipedia.org/wiki/Regular_expressions.
Include and exclude filters are used to focus your report by excluding unwanted user visits to your site, or hits, from your report. The names of the filters, include and exclude, are a little confusing because both are used to narrow the number of hits in a report by excluding data from the report, but how they work to accomplish this is different.
When patterns match in an exclude filter, the hit is ignored (not included in the report). An include filter tells Google which hits to keep. Patterns that match are included in the report and those not matching are ignored. You can’t mix and match expression types. You either use exclude filters or include filters.
You can create exclude filters using a single expression with multiple pattern matches, or you can create several exclude expressions. When several patterns are used in a single expression, they are grouped together using the logical OR, found in Table 36.1. Only one of the patterns in the expression needs to match in an exclude filter expression for the hit to be excluded.
Building include filters works the same way, creating a single expression with multiple pattern matches or creating several include expressions. This is where the similarity stops. Unlike exclude expressions, all the patterns in an include expression must match to be included. Otherwise, the hit is ignored.
Search and replace filters are used to replace information gathered by Analytics, such as part numbers or meaningless directory names, with text that will be meaningful in a report. For example, if you run an e-commerce site and you track part numbers, replace part number x123 with Barber Chair, black.
Analytics allows you to combine fields of information into a single field so that they are more informative. You can do this using advanced filters. Advanced filters put two or more fields, or parts of fields, together using constructor expressions. Constructor expressions are regular expressions that take information from two extracted fields and create a single field.
So far, this chapter has been about preparing Analytics to create reports. After the tracking code is in your page, Google is tracking statistics, and you have set up any desired goals, funnels, and filters, then you are ready to view your reports.
After you’ve logged in to your Analytics account, select a domain from the drop-down list and click the View Reports link located in the top orange bar. There are three “dashboards” depending on your role within your company. You can view data of interest to executives by selecting the Executive dashboard. View reports of interest to the marketing department by selecting Marketer from the drop-down list. For reports of interest to the Webmaster, select the Webmaster dashboard from the list.
Most of the reports described in this section require a date range. Select a date range for any of your reports by using the calendar found in the left column of the View Reports page.
The Executive reports include many of the summary reports from the other areas and give a good idea of the general performance of the Web site. This section lists each of the reports with a brief explanation.
The Executive Overview, of immediate interest to executives and the Web designer, displays four panels. The Visits and Pageviews panel plots visits and page views by day. The Visits by New and Returning panel shows a 3D pie chart of new visits to your site compared to returning visits. The Geo Map Overlay displays a graphic representation of where most of your visitors are located throughout the world. The lower-right panel, Visits by Source, displays a 3D pie chart of how visitors end up on your site, directly or by some referring Web site.
The Conversion Summary report, measuring the effectiveness of your Web site, is most useful once you set goals. See the section “Reaching the Goal” later in this chapter. This report shows you visit results over a specified time period. See whether visits to your site have increased or decreased over the period. Also, find out how many visits resulted in conversions (reached specified goals). You can graphically see the increase or decrease represented by green and red arrows, respectively, and an actual percentage. It looks a little like a typical stock market report.
This report tracks both changes in visits to your site by goal as well as the actual conversion rate of each goal.
The Marketing Summary report tracks the effectiveness of your company’s online marketing efforts. This report is similar to the Conversion Summary, but it adds an additional layer of information: the way in which people land on your site. This is broken into three categories. The first category displays visits and goal visits for the top five sources of visitors to your site. The second category tracks the top five keywords used to search, find, and ultimately visit your site. The third category tracks the effectiveness of your top five campaigns.
Visitors can end up on your site in a number of ways. Direct visitors type the URL of your site into their Web browsers, or if you’re lucky, select it from the browser’s favorites list. They do not first visit search engines or other sites with links to your page. Referral visitors end up on your site because they clicked a link from a non-ad-related link. Consider these as “freebies.” You paid no cost to get these people on your site. Then there are people who visit your site because of your campaigns. There are two types of campaign visitors: those tagged with campaign variables and those not tagged. This report can help you determine the financial effectiveness of your AdWords campaigns.
The Content Summary shows the effectiveness of your Web site in attracting and maintaining user visits. You can track the effectiveness of several variables based on percentage increase or decrease over a specified time period.
See the number of visits to your top five entrances (pages people first visit when coming to your site) as well as the number of people who bounce (“Hmmm, not interesting, I’m outta here.”) and immediately leave your site from the entrance page.
The statistics for your top five exit pages also are shown in this report. An exit page is the one where people generally leave your site. See the increase or decrease in exits from these pages and the number of overall pageviews compared to the number of pageviews where people exited. It is very helpful to see where people are leaving your site.
The number of visits to your top five content pages also displays the approximate length of time people spend on those pages. This is calculated from the time the page is loaded until the next page is loaded. It’s approximate because some people might go to lunch while visiting a site, come back, and then continue to the next page. The only way this may change is if your site has session tracking and automatically logs a user out after a certain amount of idle time.
Find out if people are actually reading your content or simply hopping through your pages toward some goal. Find out what content visitors find interesting and whether more or fewer people are visiting those content pages over time. If you are running an online magazine, this is a great way to find out which authors or articles are most popular.
The Site Overlay report, shown in Figure 36.3, displays your Web site and allows you to navigate through it page by page. As you move through the pages, you can view updated statistics on traffic to the page and conversion rates.
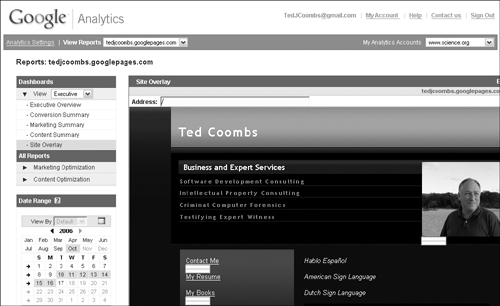
View the number of clicks on the page, the number of clicks compared to the number of clicks over a period of time, the number of clicks you’ve defined as a goal, and an average score given to links most commonly visited just prior to clicking a goal link that leads to a high-value conversion.
The reports of interest to people involved in marketing a site are included in this section. These reports show trends in Web site success as compared to your marketing efforts. Find out things like trends in cost per click, your keyword successes, or how well people manage to stay in funnels as defined by marketing goals. The Marketer Overview and Site Overlay reports are the same as those found in the Executive dashboard.
This report shows you which of your marketing programs are most effective in driving traffic to your site. You can view this report as either a pie chart or a bar chart, providing statistics all the way down to the keyword level.
The CPC Analysis report shows you the number of times your ad was displayed, the number of times the ad was clicked, the number of goals reached after an ad was clicked, the cost of the ad, and the revenue earned as a result of the ad. You also can review statistics such as the click-through rate, the conversion rate, average cost per click, the revenue broken into the revenue for each click (this can be different for e-commerce-enabled tracking), and your overall return on investment—in other words, the bottom line.
For AdWords customers, this is the most comprehensive and useful report for determining ad effectiveness.
The CPC vs Organic Conversion report tells you the value of your cost per click (paid ads) compared to the value of other ways in which people reach your site, such as links, non-paid advertising such as articles written about your product or company, and search engine results that did not originate from paid ads.
This report also allows you to see which keywords were used in each of the search engines allowing you to optimize the keywords in your AdWords account for maximum effectiveness.
The Overall Keyword Conversion report shows the cost effectiveness of your keywords by showing you which keywords result in page visits, how many pages were viewed for each site visit, how many visits were converted into goals reached, and the average value of each keyword per visit based on whether they were keywords from paid ads or keywords from unpaid marketing efforts. Free is good, particularly when you make money.
Learn how your organic keywords are doing in terms of their conversion rate using the Keyword Considerations report. See the total number of visits to your site due to someone ending up on your site using non-paid keywords. See the average number of pageviews as a result of these visits. Most importantly, find out what percentage of the visits due to organic keywords result in goals and, if applicable, the average revenue.
One of the decisions you need to make in the future is whether to complement the use of organic keyword success by also using these keywords in paid advertising. It’s not completely clear whether the cost benefit of leaving alone what is working for free or whether to pour a little money into ads that use these keywords to see if your profits can be maximized. It takes some experimentation. This report helps you get started giving you the knowledge to get started in that research.
This report complements the one you can view using your AdWords account. It tells you which of your ad campaigns are resulting in the highest number of visits, pageviews, goals achieved, and revenue. These are broken out into separate statistics so you can see which campaigns result in a high number of visits (curiosity factor) and which ones actually result in completed goals or revenue. They are not necessarily the same. For example, one keyword may be interesting and exciting causing someone to want to see your page (example: snow report), while another brings the buyer actually interested in purchasing your products (example: discount snowboards).
The Conversion Summary report is a simple report that shows you quickly whether your visits and conversion rates for each defined goal increased, decreased, or remained static over the time period you specify in the date range. The statistics are displayed in green up and red down arrows, as well as actual values and percentages.
For each funnel you defined earlier, the Defined Funnel Navigation report shows the entrance points along these funnels. For more information about defining funnels, see the section “Creating the funnel” earlier in this chapter. This report displays the number of visitors still remaining along each of the steps. It then displays the number of people who left the page and went somewhere else (outside the funnel). Most important, it tells you where they went and when they left. It’s possible that you may need to remove ads along your funnel that lead to distractions that cause visitors to exit the funnel. Consider removing some site navigation features, making it more difficult to leave. Consider using technologies such as Ajax that allow you to update the Web page information without launching a new page or reloading the current page. Consider reducing the number of steps to reach the goal, eliminating steps that lose people.
There are many strategies for keeping a visitor moving through the funnel toward a defined goal. This report helps you determine how effective the funnel is and where its weak points are so that it can be improved.
Learn how effective your site is at keeping visitors, depending on their first reactions. People can enter your site on different pages depending on how they were driven to your site. For example, search engines may direct them to a content page where someone typing the URL may first visit your home page. The Entrance Bounce Rates report shows you how well these different pages are at retaining visitors and how many of the visitors leave immediately.
This report helps you with things such as keyword optimization. Are your keywords relevant to your site? Nonrelevant keywords can lead to high bounce rates. Are some of your Web pages ugly or unreadable? Try to keep your entire Web site appearance professional, and provide easy navigation from every content page making it possible to continue navigating through your site from any page. Orphaned pages, those with no navigation, may lose visitors while also having high entrance statistics.
Many of the reports within the Webmaster dashboard also are included in the Executive and Marketer dashboards. The Webmaster Overview is the same overview as the Executive and Marketer overview, providing a quick look at important site statistics. The Defined Funnel Navigation and Entrance Bounce Rate reports are the same as those discussed in the Marketer dashboard section. The Content Summary also can be found in the Executive dashboard.
The Goal Tracking report is a simple plot of goal conversions over time. This report quickly tells the Webmaster how effective the site content is over time. Perhaps the site content has become stale and no longer draws site visitors. Consider ways to update content on a more frequent basis or how to make it more dynamic. This report also helps Webmasters determine whether navigational changes to the site have increased or decreased goal conversion. This report and the Defined Funnel Navigation report are excellent tools to assist the Webmaster in defining site navigation.
Some Web sites have different pages with the same title. This often occurs when pages are delivered from content stored in databases, where the page is a template and the content is included from data queried from the database. The Content by Titles report shows the relative popularity of pages based on their titles, aggregating pages with the same title, as defined in the HTML <title> tag.
The Web Design Parameters section of reports includes information valuable to the developer. It’s important to know what software and versions, equipment, and network speeds people use to visit your site. The Web Design Parameter reports include this information:
Browser versions
Platform versions
Browser and platform combos
Screen resolutions
Screen colors
Languages
Java enabled
Flash version
Connection speed
Hostnames
Armed with the information in this section, Webmasters can refine the graphic design and technologies they use to increase user satisfaction and efficiency.
Google Analytics has been called Web reporting on steroids. It’s actually much more than simple Web reporting. Analytics allows you to define goals you hope your visitors will reach, whether that is to purchase a product, see a demo, read an article, or see an ad. You also can define the paths along which visitors reach those goals and track visitor progress through those funnels. Analytics helps you learn about the effectiveness of your ad and marketing campaigns. Find out whether your ads are working and which people are buying products through organic keywords rather than ads. Discover your customers’ locations, when they buy, and how much they buy.
Analytics allows you to tailor the data viewed in reports by creating filters based on regular expressions. You can set up an e-commerce site so that Analytics provides detailed feedback on your sales and marketing successes.