
10 Deploying confidently
- explaining the two DORA metrics that measure stability: change failure rate and time to restore service
- deploying safely by implementing a rollback strategy
- using blue-green deployments and canary deployments to decrease the impact of bad deployments
- using continuous deployment to achieve elite DORA metric performance
Deployment time is when the rubber hits the road for a lot of projects. When undertaken without automation or precautions, it can be a source of a lot of stress.
In this chapter, I’ll describe how to use automation to remove a lot of human burden from the deployment process and how to measure its effectiveness. I’ll also dive into “the other CD,” continuous deployment, and look at what’s required to pull it off, and what tradeoffs to weigh when deciding whether it’s a good approach for you.
Plenty of deployment woes
Plenty of Woofs, another social site popular with dog lovers, is a website that helps dog owners find compatible playdates for their dogs. They can look for other dog owners near them, filter pets by size, compatibility, and favorite games, and use the website to chat and share pictures.

Unfortunately, in recent months Plenty of Woofs has been struggling with what has become regular production outages, with major features of the website being down for up to days at a time! These issues have surfaced immediately after deployment, initiating a mad scramble for the development team to diagnose and fix the problems as fast as possible.
The company is small, fewer than 20 people in total, and has so far kept its architecture fairly simple, with one monolithic service that does everything, backed by a database:

What this architecture has meant is that each outage has impacted the entire company, and employees are starting to feel the strain. Being expected to work through the weekend to fix these production issues is starting to feel like the norm, and there are rumbles of burnout.
DORA metrics for stability
Although they’ve been struggling with their recent outages, the Plenty of Woofs engineers have put some good practices into place already, including tracking their DORA metrics. Chapter 8 introduced the DORA metrics; see https://www.devops-research.com/research.html for more details.
|
The DORA metrics for velocity Velocity is measured by two metrics:
|
The DORA metrics for stability Stability is measured by two metrics:
|
When you last saw the DORA metrics, I focused on velocity, measured by deployment frequency and lead time for changes. The other two metrics deal with stability, and these are the metrics that Plenty of Woofs turns its attention to, in order to evaluate the outage problem:
-
Time to restore service measures how long it takes an organization to recover from a failure in production.
-
Change failure rate measures the percentage of deployments that cause a failure in production.
As you may remember, while identifying these metrics, the DORA team members also ranked the teams they were measuring in terms of overall performance and put them into four buckets: low-, medium-, high- and elite-performing teams. This is what the values look like for the stability metrics:
|
Metric |
Elite |
High |
Medium |
Low |
|
Time to restore service |
Less than one hour |
Less than one day |
One day to one week (a) |
More than six months (b) |
|
Change failure rate (b) |
0–15% |
16–30% |
16–30% |
16–30% |
(a) What happened to one week to six months? The gap here shows that progressing from low to medium performance doesn’t happen by making a change such as reducing restoration time from six months to five; it happens by finding ways to restore service within one week.
(b) The DORA team found a clear difference between elite performers and the rest, but high, medium, and low performers all showed about the same failure rate.
![]() What if I don’t run a service?
What if I don’t run a service?
If you work on a project that you don’t host and run as a service, knowing whether these metrics apply to you might not be obvious. (See chapter 1 for more details on the various kinds of software we can deliver, including libraries, binaries, configuration, images, and services.)
And, in fact, you might be wondering about the relevance of this chapter as a whole. The strategies described in this chapter are deployment specific, so unfortunately they probably won’t help you very much, but the DORA metrics themselves can still be applied to your situation. Also, remember from chapter 1 that when we talk about continuous deployment, what we are really talking about is continuous releasing, i.e., making every change available to users as it is made.
When looking at the stability-related metrics, you can apply them to other software (e.g.,libraries and binaries) like this:
-
Change failure rate stays the same, but instead of thinking of it as the percentage of deployments that cause a failure in production, think of it as the percentage of releases that contain a bug serious enough to require a patch release (i.e., a bug so serious you need to rush a fix out to your users ASAP as opposed to a bug that can be fixed in your own time and included in a later release).
-
Time to restore service becomes time to release fixes, i.e., the amount of time it takes to go from a serious bug being reported to having the patch release available.
Do the values for elite, high, medium, and low performers across these metrics apply in all cases? Again, the principle remains the same: the more quickly you detect problems and get fixes out to your users, the more stable your software is.
However, the kinds of automation solutions that make it possible to dramatically improve these metrics for services (which you’ll see in this chapter) are often not available in many cases for other kinds of software. You may be able to automate rolling back (reverting) commits in some cases, but it’s not simply a matter of rolling back to a previous version as it is with deployed software. You often can’t escape actually addressing the bug directly and fixing it, so achieving the elite-level time to restore service or time to release fixes of less than one hour may be unreasonable.
DORA metrics at Plenty of Woofs
Both of the DORA stability metrics can be impacted by the velocity metrics, so (as you’re about to see) you can’t really look at the stability metrics without looking at the velocity metrics too. This is the complete list of metrics and their values for elite, high, medium, and low performers:
|
Metric |
Elite |
High |
Medium |
Low |
|
Deployment frequency |
Multiple times a day |
Once per week to once per month |
Once per month to once every six months |
Fewer than once every six months |
|
Lead time for changes |
Less than an hour |
One day to one week |
One month to six months |
More than six months |
|
Time to restore service |
Less than one hour |
Less than one day |
One day to one week |
More than six months |
|
Change failure rate |
0–15% |
16–30% |
16–30% |
16–30% |
And these are the values that Plenty of Woofs has measured for its own performance:
-
Deployment frequency—Once a week (high).
-
Lead time for changes—Less than one week (high).
-
Time to restore service—At least one day but often multiple days (medium).
-
Change failure rate—The yearly average is 10% (1 out of every 10 deployments). Lately this has been more like 1 out of every 3 deployments, or around 33% (lower than the max value observed for high, medium, and low performers, therefore safe to consider this aligned with low performers).
Plenty of Woofs is a high performer when looking at its velocity metrics, but slides into medium and low performance when looking at stability.
Deploying less frequently?
Archie and Sarita work on Plenty of Woofs and have volunteered to tackle the outage problem they’ve been facing. Archie approaches Sarita with an initial idea of what they can do better.

Archie suggests that they deploy once a month instead of once a week, and hypothesize what the DORA metrics would look like.
Sarita first tries to understand what the change failure rate would look like, by taking a look at several of the previous deployments, which resulted in outages, and comparing that to what would happen if they deployed once a month:

Each of the monthly deployments would have included at least one outage-causing set of changes. Deploying monthly would make their DORA metrics look like this:
-
Deployment frequency—Once a month (medium).
-
Lead time for changes—Around a month (medium).
-
Time to restore service—May stay the same at one or more days, or may get worse when dealing with more changes at once (medium at best).
-
Change failure rate—Looking at the previous outages and lining them up with when monthly releases would happen, every deployment would likely have an outage when switching to monthly releases, i.e., 100% (extremely low).
Deploying more frequently?
Archie had suggested that deploying less frequently might help with the outage problem at Plenty of Woofs, but looking at the DORA metrics it seems clear that the team’s performance would go down across the board:
-
Deployment frequency—Once a week (high) to once a month (medium).
-
Lead time for changes—Less than a week (high) to around a month (medium).
-
Time to restore service—Multiple days or worse (medium at best).
-
Change failure rate—Since the monthly deployments will gather together the changes of at least four weekly deployments (one-third of which are causing an outage), all monthly deployments will likely cause an outage: 100% (extremely low).

To see what would happen, they dig a bit more deeply into one of the recent deployments that caused an outage. They look at when the changes that went into the deployment were introduced:

Daily deployments vs. outages
Looking at the October 14 outage, Sarita and Archie notice that the specific change that caused the outage went in on Tuesday, so if they had been doing daily deployments, only Tuesday’s deployment would have caused an outage. They expand this out and look at the last eight deployments, each of which contains five business days’ worth of changes, and based on when the outage causing changes were introduced, hypothesize which daily deployments would have caused outages:
-
Sept. 2 (outage)—One daily deployment out of five would have had an outage.
-
Sept. 9 (success)—Five successful daily deployments.
-
Sept. 16 (outage)—Two daily deployments out of five would have had outages.
-
Sept. 23 (success)—Five successful daily deployments.
-
Sept. 30 (success)—Five successful daily deployments.
-
Oct. 7 (success)—Five successful daily deployments.
-
Oct. 14 (outage)—One daily deployment out of five would have had an outage.
-
Oct. 21 (success)—Five successful daily deployments
Looking across these eight weeks, out of the total 40 daily deployments they would have had, 4 would have caused an outage: 4 / 40 = 10% of the deployments would have caused an outage. Overall, their DORA metrics with daily deployments would look like this:
-
Deployment frequency—Daily (almost elite, more clearly still high)
-
Lead time for changes—Less than a day (also nearly elite, more clearly still high)
-
Time to restore service—Not sure—problems will likely take just as long to diagnose and fix as before so maybe still one or more days (medium)
-
Change failure rate—Based on the last eight weekly deployments, it looks like only 10% of deployments would cause an outage (elite)
Increasing the number of deployments wouldn’t change the number of failures, but it would decrease the probability of any particular deployment containing a failure.
![]() Takeaway
Takeaway
Deploying more frequently decreases the amount of risk in each deployment. Each deployment will have fewer changes, and so the probability of a deployment containing a change that causes a failure in production is lower.
Steps toward increasing frequency
Though they’re not sure yet how increasing the frequency will help them with their outages overall, Sarita and Archie can clearly see that deploying more frequently will make them better performers from the perspective of the DORA metrics. They start to plan out what it would take to be able to deploy daily, and hope that they’ll gain additional insights along the way. They want to take a critical look at their deployment process, which revolves around updating the several deployments of the Plenty of Woofs web server:
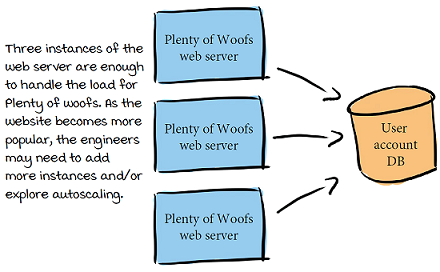
Plenty of Woofs is scaling its web server manually. Many cloud-based deployment options will scale your deployments for you (this is called autoscaling). I won’t be going into any more detail about scaling here.
Their current deployment process looks like this:
-
Once a week, every Thursday afternoon, a deployment is started.
-
All team members need to be available Thursday and Friday (and maybe beyond) to deal with any issues that come up.
-
During the deployment, metrics from the web server instances are monitored using a third-party service called CellphoneDuty, which notifies the team whenever the metrics look unhealthy.
-
When a problem arises, the entire team investigates it and creates a fix. Once the fix is merged into main, the web server is built and redeployed.
Fixing problems with the process
Looking at the process at Plenty of Woofs, Sarita summarizes that two main issues really slow it down and impact the metrics:
-
Fixing the issues that are found takes a long time, on the order of days.
-
Too many bugs are slipping through their CI processes—and not just any bugs, but severe, production outage-causing bugs.

In addition to these issues slowing them down and preventing them from deploying more frequently, deployments really stress the team members out. Everyone has come to dread Thursdays! Sarita and Archie set a goal to work toward:
Find a way to mitigate production issues without having to wait hours (or days!) for them to be fixed.
Once production is stable again, Archie and Sarita can focus on how to stop these bugs from getting out in the first place, using some of the techniques covered in chapters 3 to 7!
Rolling updates
The first issue Sarita and Archie are tackling is that when bugs are found in production, it takes hours to days to fix them. To figure out a solution, they investigate the details of how exactly updates are deployed to the three instances of the Plenty of Woofs web server.
Plenty of Woofs engineers do their rolling updates manually, but many deployment environments (for example, Kubernetes) will give you rolling update functionality out of the box.
Looking more closely, it’s clear that Plenty of Woofs is using a rolling update approach to updating these instances. For each host, one at a time, the currently running web server container is stopped, and a new instance of the web server (at the new version) is started. After one host is updated, the next is updated, and so on, until they are all updated.

![]() Vocab time
Vocab time
Using a rolling update means that instances are updated one at a time to the new version. At any point, at least one instance of the service is up and running, which avoids any downtime for the service as a whole. A simpler approach is to take all of the instances down and update them simultaneously, but this means the service will be down for some period of time while the update happens. While a rolling update is occurring, some users may be connected to the newer instances of the service, and some may be connected to the older instances (depending on how requests are routed to those instances).
Fixing a bug with a rolling update
When a bug is found, the process at Plenty of Woofs is to wait for a fix to be found, and then release the new version, containing this fix, using the same rolling update approach:

And, of course, this rolling bug fix update is initiated only after the bug has been diagnosed, fixed, and a new version of the web server has been built. So the total time to correct a production outage for Plenty of Woofs is as follows:
(Time to fix the bug) + (Time to create a new release) + 3 × (Time to update an instance)
Rollbacks
Looking at the how the deployment works and where the time is going, it’s obvious that the majority of the time they are losing is in waiting for the new release:

Sarita and Archie have realized that when a deployment breaks production, they don’t need to leave it in a broken state and wait for a fix. Instead, they can immediately roll back to the previous version, which is already known to work.
So if they deploy version 1.4.0, and it causes an outage, instead of waiting for 1.4.1 to be ready (aka fixing forward), they can roll back to the previous version (1.3.2). Once the issue is fixed and 1.4.1 is available, they can update from 1.3.2 to 1.4.1.

Rollback strategy = immediate improvement
If Plenty of Woofs adopts a strategy of rolling back whenever an outage occurs, the time to restore the service will drop dramatically, and will simply be the time it takes to do a rolling update back to the previous version:

Their time to restore would drop from days to just minutes. This would immediately improve their DORA metrics. Time to restore service would go from what had previously been multiple days, or worse, to minutes.
|
Metric |
Elite |
High |
Medium |
Low |
|
Time to restore service |
Less than one hour (a) |
Less than one day |
One day to one week |
More than six months (a) |
(a) Plenty of Woofs would jump straight from being medium performers to being elite!
Sarita and Archie immediately report their discovery back to the rest of the company, and Plenty of Woofs institutes a policy to immediately roll back whenever an outage occurs. This means the underlying bug is still in the codebase and needs to be fixed, but now this can be done calmly during working hours, instead of requiring a stressful scramble to fix production as fast as possible.
![]() Vocab time
Vocab time
To use rollbacks effectively, you need a rollback strategy. A rollback strategy is an automated, documented, and tested process indicating how to perform a rollback when needed. This process should be treated as seriously as any other development or deployment process, if not more so, because rollbacks will be happening at a vulnerable time for your service (when it is in a bad state and causing problems that are visible to users). Automation for the process and tests for that automation (and even “fire drills” to practice rolling back) will give you confidence that the process will go smoothly when you critically need it.
![]() What about rolling back data?
What about rolling back data?
When deployments involve changes to data, the rollback story gets a bit more complicated. And, realistically, most services are backed by data in one form or another, with a schema that needs to be updated as new features are added and bugs are fixed.
Fortunately, this is a surmountable problem and won’t prevent you from using rollbacks. You need to introduce a few policies and guidelines into your process to ensure you’ll be able to safely roll forward (i.e., deploy) and backward as needed:
-
Version your data schemas—In the same way as the previous chapter recommended versioning your software (and semantic versioning can be a good choice here too), each change to your database schemas should come with a corresponding version bump.
-
Include upgrade and downgrade scripts for each version bump—Every change to the database schema should come with two scripts (or other automation): one that can be applied to change from the previous version to the new one, and one that can be applied to roll back from the new version to the previous version. If you create these for every version bump, you can easily roll back as far as you need by applying the scripts one at a time as you roll back through the versions, and do the same to go forward.
-
Update your data and your services separately—If you couple together your data and your service updates and do them at the same time, rolling back becomes more error prone and stressful. Instead, perform them separately. When you make changes, your services need to be able to handle both the old versions of the data and the new versions without errors. This can be challenging, but well worth the reduced stress and risk.
The underlying goal of these polices is to let you deploy and roll back your data changes in the same way as you do your software: roll them out when you need an update, and if something goes wrong, roll them back.
Similarly, when changes in functionality need corresponding changes in data structure, you can roll your database forward to add the changes you need. Again, try as much as possible to avoid coupling these changes together, so that you can do the rollouts independently.
This book doesn’t go into any more detail about effective data handling; look for other resources specifically discussing effective data management for more.
Rollback policy in action
The new policy to immediately roll back when a production outage occurs (instead of waiting for the team to create a patch fix) is already saving Plenty of Woofs a lot of time—and stress! As the policy is embraced, Sarita and Archie gather data and reexamine their time-to-restore-service DORA metric to verify their theory that the time will be down to minutes, and they will be in the elite performance category. Looking at what actually happens during an outage, they can see that the total time from when the outage begins to when the service is restored looks like this:
-
Rolling updates across the three instances take 5–15 minutes to complete, both for a roll forward (a deployment/update) and for a roll backward.
-
Outages will start at the beginning of the rolling update period (when the first instance is updated, any traffic hitting that instance will start getting failures).
-
When an outage is occurring, it takes at least 3 minutes, sometimes as long as 10, for the engineer monitoring the metrics to notice.
-
Once it is clear an outage is occurring, a rollback will be initiated. The rollback is itself a rolling update across the three instances, and will take another 5–15 minutes to complete.
So the total time from the beginning of the outage until the resolution is as follows:

This makes the total time from the start of the outage to the resolution somewhere from 13 (5 + 3 + 5) to 40 (15 + 10 + 15) minutes. That means their DORA metric for time to restore service is 13 to 40 minutes. A time to restore of 40 minutes still puts Plenty of Woofs into the elite performance bucket:
|
Metric |
Elite |
High |
Medium |
Low |
|
Time to restore service |
Less than one hour |
Less than one day |
One day to one week |
More than six months |
Blue-green deployments
Though the time-to-restore-service metric is greatly improved, 40 minutes means potentially 40 minutes of user-facing errors, and there isn’t a lot of wiggle room between their max 40 minutes and the 1-hour upper bound. If anything slows down (for example, if they add a few more instances), they’ll be back to being just high performers. Sarita suggests that they focus on the time to do the rolling updates themselves, and see if there is something they can improve there:

The rolling update process itself adds 6 to 20 minutes of outage time. One way to address this is to do a blue-green deployment instead of a rolling update. In a blue-green deployment (also called a red-black deployment), instead of updating one set of instances in place, you create a brand-new set of instances and update those. Only after those instances are ready do you switch traffic from the original (the “blue” instances, though it doesn’t really matter which instances are which color) to the new (the “green” instances).

If the new instances have a problem or result in an outage, a perfectly good set of instances is still running the previous version. Rolling back is as easy as switching traffic back to the original set of instances!
Faster time to restore with blue-green
Using blue-green deployments requires having enough hardware available to be able to run two complete sets of instances simultaneously. This might not be reasonable if you own and manage your own hardware (unless you keep a lot of extra hardware on hand). But if you use a cloud provider, this can be pretty cheap and easy to do; you need to pay for the extra hardware only during the deployment period. Sarita and Archie take a look at how long their time to restore would be if Plenty of Woofs starts using blue-green deployments instead of rolling updates:

They’ve traded the rolling update time for the time it takes to reroute traffic between their instances. This makes the total time from the start of the outage to the resolution somewhere from 5 (1 + 3 + 1) to 12 (1 + 10 + 1) minutes.
How long does it take to reroute traffic?
Rerouting traffic gracefully takes a nonzero amount of time. The ungraceful approach would be to terminate all connections to the old instances when you want to switch over—which means in the best case that all the users connected to those instances will see errors, and in the worst case that you might interrupt something in progress, leaving it in a bad state (designing your applications to avoid this is a whole separate topic!). One approach to rerouting gracefully is to let the instances drain over a certain allowed time-out period; the amount of time will depend on how long your requests usually take to serve. (At Plenty of Woofs, requests are expected to complete in seconds at most, so it uses a time-out of 1 minute.) Drain instances by allowing any requests that have already started to complete (instead of interrupting them—unless they don’t complete within the time-out!) and route new traffic to the new instances.
![]() Takeaway
Takeaway
Sticking to a policy of rolling back (instead of waiting for fixes and rolling forward) when you encounter production issues lets you recover quickly and painlessly. Using blue-green deployments, when you have the hardware available, makes the process even quicker and easier.
Faster and more stable with canaries
Using blue-green deployments would put Plenty of Woof’s time to restore into a pretty good place, but Sarita wonders if they can still do better:

Sarita and Archie have stumbled on another deployment strategy they could use: canary deployments (also called canary-based rollouts or canary releases). In a canary deployment, one instance (called the canary) is updated with the new software, and a small percentage of traffic is directed to it.
The phrase “canary in a coal mine” refers to canaries that were brought into coal mines to provide an early warning for the presence of toxic gases. Poor canaries!

If the canary is healthy, the rollout can continue, either by switching all traffic to instances running the new version, or by gradually creating more canary instances and directing more traffic to them, until no traffic goes to the old instances. If the canary is unhealthy, the entire process can be stopped, and all traffic can be switched back to the original instances.
Requirements for canary deployments
A few pieces must be in place in order to do canary deployments. To use canary deployments you must do the following:
-
Be able to distribute traffic across different deployments (for example, by configuring a load balancer).
-
Be able to measure and determine whether a deployment succeeded (ideally, automatically, in order to be able to automate the rollout process).
-
Decouple changes to data from changes to functionality (see the previous sidebar “What about rolling back data?”).
-
Determine an effective percentage of traffic to direct toward your canary. You want enough traffic directed to your canary instance to get a good signal regarding the success of the update, but also the minimal amount of traffic you can get away with to minimize user impact if something goes wrong.
-
Determine the amount of time to collect data from the canary. Again, you need to collect data for long enough that you can get a good signal regarding the success of the update. If you don’t collect data for long enough, you might jump to the wrong conclusion about the success of the update, but collecting data for too long might not give you a signal fast enough when a problem occurs.
Regardless of the amount of traffic you get, it’s worth assuming that collecting data for just a few seconds won’t be long enough. Many metrics aren’t even available at this granularity (for example, requests per minute), and way these metrics are aggregated means you’ll need to look at multiple to get a good sense of what’s going on (for example, averaging a value over a minute can smooth over spikes in the data).
How do I measure and determine if a deployment succeeded?
You’ll need to measure the health of the service. To understand what to measure and how, see a book about DevOps or site reliability engineering. Site Reliability Engineering: How Google Runs Production Systems, edited by Betsy Beyer et al. (O’Reilly, 2016), describes the four golden signals to observe when monitoring distributed systems (latency, traffic, errors, and saturation), for example. As for how to automate collection of these metrics and the deployment strategies, your options are to use existing tools (for example, Spinnaker, an open source tool for automating deployments with support for multiple cloud providers and environments) or build your own. Building your own is the most expensive option, and the logic required to back this is complex enough that you’ll likely need to have a team dedicated to building and maintaining it. Choose this route only if you can’t find existing tooling that meets your needs (for example, if you have built your own proprietary cloud).
![]() Canaries and config as code
Canaries and config as code
In chapter 3, you saw the importance of practicing config as code as much as possible: treating configuration (and really all plain-text data required to run our software) “as code” by storing it in version control and applying CI to it. But using a strategy like canary deployments requires making incremental updates to the configuration used to run your services as the deployment progresses:
-
Updating the configuration describing your instances to include a new instance to run your canary with the new software
-
Updating the configuration for traffic routing to direct a subset of the traffic to the canary instance
-
If the canary is not successful, updating the configuration describing your instances to remove the canary instance and updating traffic routing to route 100% of traffic back to the original instances
-
If the canary is successful, updating the configuration to add all the new instances required and switching traffic over to them
Does it still make sense to use config as code while making all of these updates? Yes! Prefer continuing to practice config as code as much as possible. To make it work with these deployment strategies, you have a couple of options:
-
As you make changes to the configuration, commit those changes back to the repository that stores your configuration (use an automated pipeline with tasks that will create and merge PRs to your repo with the changes as the deployment progresses).
-
Commit the changes to the repo before they are rolled out to production, and trigger changes to production configuration based on changes to the codebase. (This approach, especially in the context of Kubernetes, is often called GitOps.)
A GitOps-style approach can benefit you in other ways as well. It allows you to use your configuration repo as the gate for making production changes in general, ensuring that production always stays in sync with the configuration in version control, and that any and all changes to production go through code review and CI. See resources on GitOps and tools like ArgoCD for more.
Canary deployments with baselines
To get the best sense possible of the successfulness of a software update, it’s important to compare apples to apples. When comparing the performance of the new software to that of the old software, you want as many variables to be the same as possible, except for the software update itself.
In most canary deployments, the comparison isn’t entirely fair: for example, it might not be reasonable to expect the same performance from a brand-new instance of your software that was just started as you would from instances that have already been running for hours or days. The following are common factors that can cause differences in performance between your canary and your original instances:
-
An instance that has just started up (for example, before in-memory caches have been fully initialized) versus one that has been running for a while
-
Handling a small amount of traffic versus a larger amount
-
Operating as a standalone instance versus as part of a larger cluster
All of these factors will naturally be different for your canary instance, which by design was started recently, handles only a tiny subset of the total traffic, and is not part of a cluster large enough to handle the production load.
So what can you do? One solution is to also boot up a baseline instance in addition to your canary instance that runs the previous version of the software. Then, to determine whether an update has been a success, compare the metrics from the canary directly to the metrics from the baseline. This can give you a much more accurate idea of the success of the canary.

Time to restore with canary deployments
Sarita and Archie recommend that Plenty of Woofs go ahead and move forward with canary deployments. Fortunately, they find a tool that works for them (Deployaker, the same tool used by Watch Me Watch in chapter 3) and they don’t need to build their own solution. They take a look at their time to restore service after they’ve been using canaries for a few deployments:
Deployaker is just a made-up Spinnaker copycat ;)

DORA metrics and canaries
If only a small percentage of users experience an outage, and if the service can be restored for them quickly by taking down the unhealthy canary, does that count as a production failure? The DORA metrics and surrounding literature don’t go into a lot of detail about this. They do refer to failures as “degraded service” or “service impairment.” This suggests that even impacting a small percentage of users still counts as a failure in production and is counted in the change failure rate. That being said, feel free to define failure in whatever way makes sense to you. The goal isn’t to be able to say you’re in the elite bucket just for the sake of it, but to deliver your software’s business value effectively. When it comes to CD, one size does not fit all, particularly when it comes to tolerating failures in production. For example, as you’re about to see, continuous deployment isn’t necessarily a good fit for everyone.
![]() Takeaway
Takeaway
Using canary deployments makes bad deployments less harmful by reducing the number of users impacted and by making rollbacks fast and easy.
![]() It’s your turn: Identify the strategy
It’s your turn: Identify the strategy
Each of the following diagrams depicts updating a four-instance cluster by using one of the four deployment strategies you’ve just seen (rolling update, blue-green deployment, canary rollout, or canary rollout with a baseline). Match the diagram to the deployment strategy.


![]() Answers
Answers
Strategy 1: Blue-green deployment
Strategy 2: Canary deployment with baseline
Strategy 3: Canary deployment
Strategy 4: Rolling update
Increasing deployment frequency
With this huge improvement to the time-to-restore-service metric, Sarita and Archie take another look at the DORA metrics for Plenty of Woofs overall:
-
Deployment frequency—Once a week (high)
-
Lead time for changes—Less than one week (high)
-
Time to restore service—Approximately 7 minutes (elite)
-
Change failure rate—One out of three deployments, or around 33% (low)

Sarita and Archie suggest to the rest of the company that they move from weekly releases to daily releases. Because of the success of the canary rollout strategy (and corresponding relief in stress and overtime for everyone involved), they are met with unanimous approval.
Sarita and Archie had previously looked across eight weeks of weekly deployments and estimated that 4 out of 40 daily deployments during that same period of time would have had an outage:
-
Week 1—Outage in 1 / 5 daily deployments
-
Week 2—Outage in 0 / 5 daily deployments (a)
-
Week 3—Outage in 2 / 5 daily deployments (a)
-
Week 4—Outage in 0 / 5 daily deployments (a)
-
Week 5—Outage in 0 / 5 daily deployments (a)
-
Week 6—Outage in 0 / 5 daily deployments (a)
-
Week 7—Outage in 1 / 5 daily deployments
-
Week 8—Outage in 0 / 5 daily deployments
(a) At the beginning of their project to tackle Plenty of Woof’s deployment problems, they’d seen that over eight weeks, three of the weekly deployments had outages. Based on the days of the week when the outage-causing bugs were introduced, they estimated how many outages daily deployments would have caused.
And as Plenty of Woofs moves to daily deployments, they see their theory play out pretty accurately, with 5 out of 40, or 12.5% of deployments, over the next eight weeks having outages—all of which they were able to recover from in approximately 7 minutes! And during that time, there was not a single weekend requiring anyone to be working to fix a production outage.
DORA metrics with daily canary deployments
Now that Plenty of Woofs is doing daily deployments using canary deployments, their DORA metrics look like this:
-
Deployment frequency—Daily (high)
-
Lead time for changes—Less than a day (high)
-
Time to restore service—7 minutes (elite)
-
Change failure rate—12.5% (elite)
Looking at the elite, high, medium, and low buckets for DORA metrics, it’s clear that Plenty of Woofs has seriously upgraded its status:
|
Metric |
Elite |
High |
Medium |
Low |
|
Deployment frequency |
Multiple times a day |
Once per week to once per month |
Once per month to once every six months |
Fewer than once every six months |
|
Lead time for changes |
Less than an hour |
One day to one week |
One month to six months |
More than six months |
|
Time to restore service |
Less than one hour |
Less than one day |
One day to one week |
More than six months |
|
Change failure rate |
0–15% |
16–30% |
16–30% |
16–30% |
The engineers have gone from having a mix of high, medium, and low performance to being clearly high performers—and even elite in two out of four metrics!
![]() Takeaway
Takeaway
With a solid strategy for restoring service when a bad deployment occurs (such as canary deployments), deployment frequency can safely be increased—and increasing deployment frequency has a positive impact across the board!
Continuous deployment

Sarita is suggesting that to get to elite performance in all the DORA metrics, they need to start doing continuous deployment. Is that true?
It’s been a while since I’ve talked about continuous deployment in detail (all the way back in chapter 1!). The concept is often confused with continuous delivery and often also referred to as CD (this book uses CD to refer exclusively to continuous delivery). Continuous deployment is a software development practice defined as follows:
Working software is released to users automatically on every commit.
With continuous deployment, every commit pushed to version control triggers a deployment. Plenty of Woofs is deploying once a day, but each deployment can contain multiple commits: all the commits that were merged and pushed into the web server’s main branch that day.
The two DORA metrics that Plenty of Woofs is currently missing to be fully in the elite bucket are deployment frequency and lead time for changes, which are closely related and directly impact each other:
|
Metric |
Elite |
High |
Getting a change to production in less than an hour requires a deployment frequency of multiple times a day (assuming multiple changes are merged each day). |
|
Deployment frequency |
Multiple times a day |
Once per week to once per month | |
|
Lead time for changes |
Less than an hour |
One day to one week |
To achieve elite DORA metrics, Plenty of Woofs could make deployments even more frequent—for example, deploying every hour would tick the box in both categories. But at that point, deployments are happening so frequently that you might as well do continuous deployment (which has the benefit of making it easier to keep the codebase releasable, as you’ll see in a couple of pages).
When to use continuous deployment
Continuous deployment has advantages, but the truth is that it isn’t right for every project. Don’t feel that you need to use it to be doing CD well.
You may remember from chapter 1 that the goals of CD are to get into a state that your codebase can be released at any time, and to automate releasing it (aka “making it as easy as pressing a button”). If you have those two key ingredients in place, you have what you need to do continuous deployment.
But you don’t always have to go that far. The key is to look at your project and decide whether continuous deployment is right for you. In order to be able to do continuous deployment, the following need to be true for your project:
-
It must be acceptable to have a certain percentage (however small) of requests to your service fail. Doing continuous deployment safely hinges on being able to detect and quickly recover from failures in production—but for some software, the cost of any failures at all is too high. Of course, you want to do everything you can to minimize the impact of a failure, but sometimes the risk involved with allowing a failure is too great (for example, if a failure in the software might directly impact someone’s health).
-
Regulatory requirements don’t prevent it. Depending on the field you are in, you might need to meet regulatory requirements with your software before doing a release that make it impossible to release with every change.
-
Exploratory testing is not required before a release. This kind of testing should block releases only if a high enough risk is associated with failures to warrant making it a blocker (more on this on the next page), but if it is required, it will slow down the release process too much to do continuous deployment.
-
Explicit approval is not required before a release. Your organization may require explicit sign-off from someone in a position of authority before a release. As much as possible, try to find ways to update this model (for example, figure out how to automate whatever it is that this person is expected to validate), but if this requirement persists, you won’t be able to do continuous deployment.
-
Releases do not require corresponding hardware changes. If updates to your software require corresponding updates to hardware (for example, if you are working on embedded software), you likely can’t use continuous deployment.
If one or more of these factors rule out your project from using continuous deployment, don’t feel bad! Again, it is not the be-all and end-all, and you can still do a lot to improve your CD processes (as described in the rest of this book), making them smooth and a joy to work with, without needing to add continuous deployment to the mix.
Mandatory QA phases
A common barrier to adopting continuous deployment arises when a project blocks on exploratory or QA testing before software can be released to production. This often looks like the following process, which involves multiple software environments:
-
PRs are reviewed, and CI verifies the changes.
-
The changes are merged into the codebase.
-
The updated software is deployed to a testing environment.
-
QA analysts interact with the software in the testing environment, looking for problems.
-
Only after QA signs off can the software be deployed to production.
When using multiple environments, try to use the same deployment automation to deploy to each. Using different methods makes it easier for bugs to slip in untested in those differences.
![]() Vocab time
Vocab time
Exploratory testing is the process of having people explore software to find unanticipated problems. Having human testing of your software is invaluable in uncovering unanticipated problems. As useful as automated tests are, they are likely to catch only the kinds of problems you’ve already anticipated in advance (and codified into tests). To catch the truly unexpected things that can go wrong, we need humans to play around with the software.
![]() Vocab time
Vocab time
The environments (aka runtime environments) I am discussing here are the machines on which your software executes. In the production (prod) environment, for example, your end users interact with your software. Each engineer may have their own development (dev) environment, where they can deploy the software as they work on it. Common environment types include staging, test, dev, and prod.
QA and continuous deployment
Having a QA phase (or any other kind of manual approval phase) that blocks deployment of your software will prevent you from doing continuous deployment and will put an upper bound on the deployment frequency you can achieve. If you have this requirement, look at these three things:
-
What is the cost of a failure? Again, if the expense of a failure in production is too high (e.g.,it may even cost a life!), it makes sense to be as cautious as possible and include a phase like this.
-
Is QA doing exploratory testing? If so, one option is to continue this testing in parallel but not block releases on it, allowing you to get the best of both worlds.
-
Can the testing be automated? If the humans involved in this manual process are following a checklist of previously observed failure modes to find problems, there is a good chance that this can be automated. And if it can be automated, it can be executed as part of your CD pipelines.
In general, the more you can automate, the fewer environments you can get away with, the less you can block on people, and the more you can free up humans to do what humans do best instead of following along with checklists.
And always beware of FUD (fear, uncertainty, and doubt)! Often mandatory QA phases are included simply because people are afraid of getting something wrong. But if you can reduce the impact of mistakes with safe rollout strategies, and if you can afford the cost of a few errors in production, then you probably don’t need a QA phase. Don’t let fear slow you down.
![]() Keeping a releasable codebase
Keeping a releasable codebase
There’s one last good reason to leverage continuous deployment if you can, and that’s to use it to keep your codebase in a releasable state. Having a strategy to roll back immediately is great in terms of keeping production stable, but after you roll back production, the code that caused the outage still exists in the codebase. This means that immediately after the rollback, your codebase is no longer in a releasable state (technically, it was in that state before the deployment, but there was no way of knowing). The goal of CI is to maintain a state that allows the following:
You can safely deliver changes to your software at any time.
So how can you get back to a releasable state after a rollback? Continuous deployment really shines here: if you are doing a deployment after every change, and a deployment causes an outage, then you can easily trace the outage back to the change that caused it. And to take it a step further, you can automatically revert the change—or at least automatically create the PR to revert the change and let humans review and take it from there.
Without continuous deployment, your deployments will each likely contain multiple changes, and after a rollback, someone will need to go through those changes, decide which caused the outage, and figure out how to revert or fix the change. During that time, your codebase will remain in an unreleasable state.
![]() Takeaway
Takeaway
Continuous deployment has a lot of advantages, but it isn’t for everyone, and it’s not reasonable to expect all projects to aim for it.
Elite DORA performance
Plenty of Woofs decides to go ahead and try continuous deployment. The engineers set up triggering from their version control system that kicks of a canary deployment with Deployaker every time a PR is merged into the web server codebase.
And they are pleased with the results! Their DORA metrics now look like this:
-
Deployment frequency—Multiple times a day (elite).
-
Lead time for changes—After a change is submitted, the release pipeline kicks off and the deployment has completed less than 1 hour (elite).
-
Time to restore service—7 minutes (elite).
-
Change failure rate—12.5% (elite).
Plenty of Woofs is now in the elite performance bucket across the board:
|
Metric |
Elite |
|
Deployment frequency |
Multiple times a day |
|
Lead time for changes |
Less than an hour |
|
Time to restore service |
Less than one hour |
|
Change failure rate |
0–15% |
Deployments are now so smooth and painless that most of the team quickly comes to take them for granted. That’s a far better place to be than on the edge of burnout as they were when Sarita and Archie started their investigation!

Conclusion
Weekly deployments at Plenty of Woofs were causing stress and burnout. Looking at that, a reasonable first reaction might be to deploy less frequently. But using the DORA metrics as a guide, the team members realized right away that the goal they wanted to aim for was actually more frequent deployments, not less.
Implementing a strategy to roll back changes instead of fixing them forward gave them a lot of breathing room. From there they were able to explore more complex deployment strategies like blue-green and canary deployments.
Eventually, Plenty of Woofs decided to embrace continuous deployment, achieving elite DORA metrics, and getting to a place where deployments went from being an event everyone dreaded to a commonplace occurrence.
Summary
-
Change failure rate is one of two stability-related DORA metrics, measuring how frequently production deployments result in degraded service.
-
Time to restore service is the other stability-related DORA metric, measuring how long it takes to get a service out of that degraded state.
-
Deploying more frequently reduces the amount of risk in each deployment.
-
Rolling back immediately when you encounter production issues lets you recover quickly and painlessly, creating breathing room to address the underlying issue.
-
Blue-green and canary deployments reduce the user impact of outages and enable quick recovery.
-
Once you have a process like blue-green or canary deployments in place, you can safely start to increase the frequency of your deployments.
-
Continuous deployment has a lot of advantages, but it isn’t for everyone, and it’s not reasonable to expect all projects to aim for it.
Up next . . .
In the next chapter, I’ll start diving into topics related to pipeline design. You’ll gain practical guidance about how to go from not practicing CD to getting the basics solidly in place.