We need to open the Chrome Developer Tools. To do this, go to the View | Developer | Developer tools option in the menu or press F12. You should see something like the following:
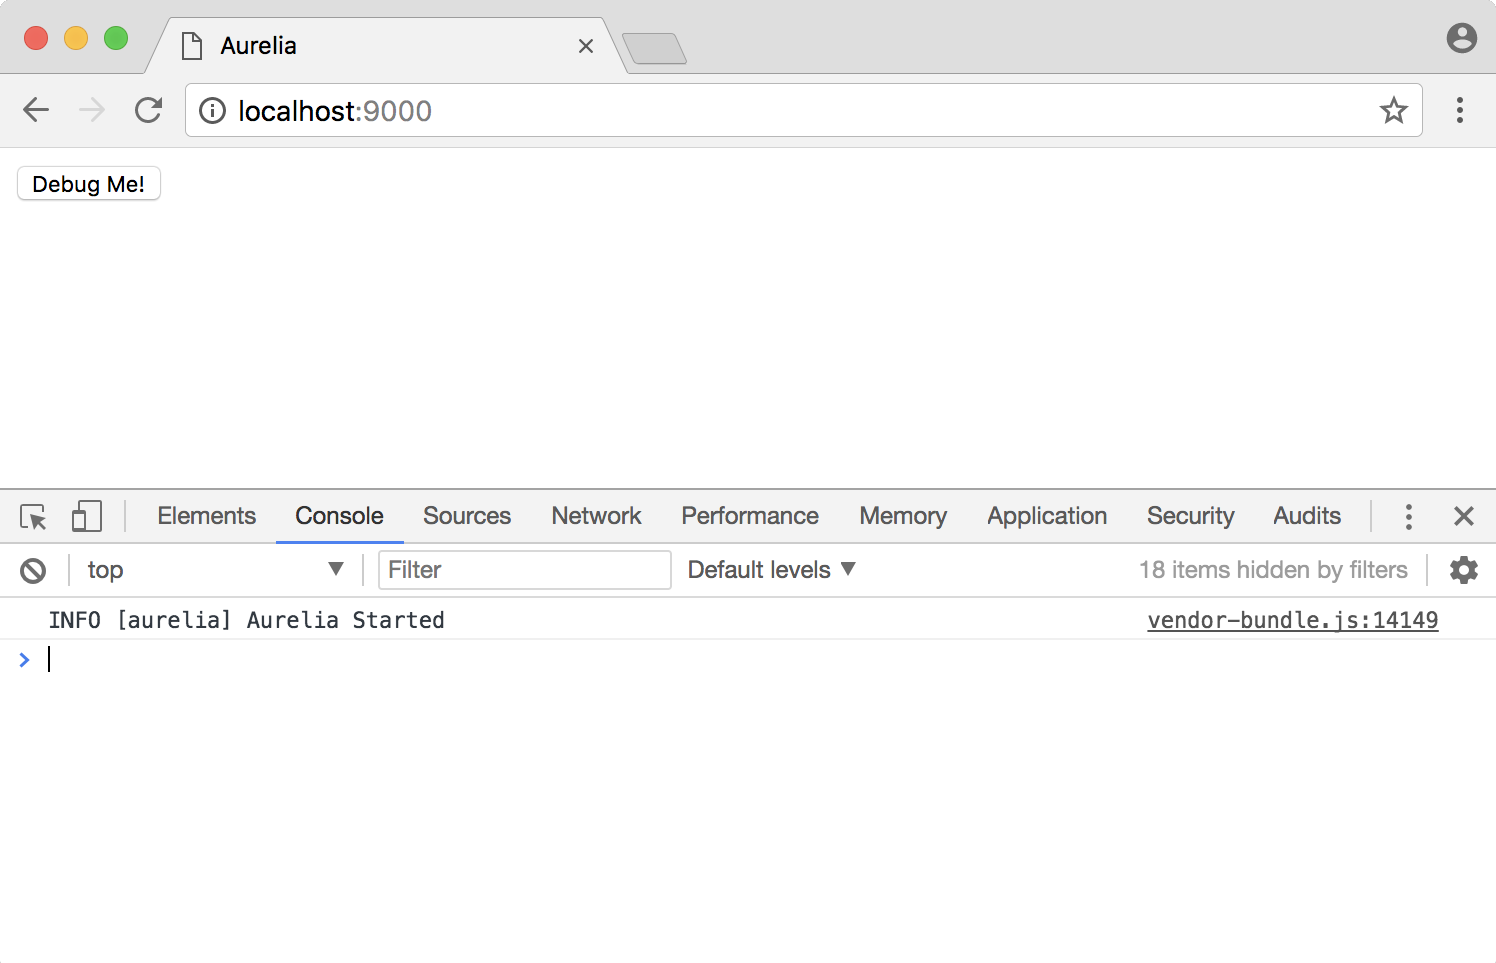
With this window open, let's apply a little change to our info-box file to tell the browser that we want to stop and debug our code:
export class InfoBox {

  debugme() {

    debugger;

    alert("YOU PRESSED THE DEBUGME BUTTON")

  }

}
Go back to your application and click on the Debug Me! button. The debugger; instruction will stop the browser execution and enter into the browser debugging mode:

You can use the Developer Tools options to navigate your code, analyze variables values, add breakpoints, and so on. I personally prefer to debug my code in this way. You can try debugging code using the Node.js command line or another type of debugging. Debugging tools will vary depending on the web browser you are working on.
Now that we are in good shape and we know how to style and test Aurelia applications, it's time to learn how to create awesome Aurelia components. Keep reading!