The ultimate goal in setting up a test bench, adding assertions and monitors, and running simulations is to find bugs. A typical cycle of bug hunting consists of detecting bug symptoms, investigating the root causes, fixing the bugs, updating the design, and preventing the bug from appearing in future revisions. In this chapter we will study methodologies and procedures practiced at various junctions of the bug-hunting cycle.
The first hint of a bug comes when simulation outputs differ from expected results. When this happens, the symptoms should be preserved and made reproducible for debugging. To accomplish this one must capture the environment producing the bug and register the bug with a tracking system for bookkeeping purposes. To make debugging easier, an effort should be made to reduce the circuit and test case size while preserving the error. Then, simulation data are dumped out to trace the root cause of the problem. In a large design, it is common to have a bug appear after days of simulation, so it is not practical to record every node value for the entire simulation interval. The crux is deriving an optimal strategy for recording just enough data. Ideally, data should start to be recorded at a time as close as possible to and before the time the problem is triggered, not observed. In this chapter we will study the check pointing strategy. When a bug is detected, a mechanism is needed to keep track of its status. Next, dumped data are analyzed to determine the root cause of the error. We will look at the key concepts, techniques, and common practices in debugging. After a bug is fixed, a policy and methodology should be imposed to ensure that the updated design is visible to the whole team and to prevent the same bug from recurring in future revisions of the design. We will conclude our study with a discussion of regression, computing grid, release, and tape-out criteria.
All the facilities discussed in previous chapters, such as assertions, monitors, and test cases, are used for the same goal of revealing design errors, by enhancing observability and expanding input space. When an error surfaces, three actions are in order before debugging can begin. First, the error must be made reproducible; second, the scope of problem should be reduced as much as possible. The scope of the problem can be either the portion of the circuit and test case that may cause the error, or the time interval in which the error is first activated. Third, the error should be recorded to track its progress. The first and the third actions are essential; the second action is necessary only for large simulation tasks.
To capture an error, the minimum environment necessary to reproduce the error should be preserved. The environment includes the version of the design, test bench, test case, simulator, and host parameters. Host parameters consist of OS version, physical memory, environment variable setting, and machine (such as workstation, personal computer, or a computing grid) characteristics such as speed and type. As an example, in the UNIX environment, environment variables are a component of the simulation environment and can be captured by the UNIX command printenv. Software programs, such as simulators, also have settings to be saved, which often are in an rc file (such as simulator.rc), which contains various parameter values of the simulator. These rc files should be saved as a part of the environment. When there are doubts regarding whether an environment parameter affects the error, save it. Saving the environment is only half the process; the other half is to provide a facility to restore the environment from the given environment parameters. A good practice is to design a pair of scripts—saver and restorer—one that saves the environment parameters and the other that restores them from a saved record. For example, if a design is under revision control (software that dictates what version of the design be visible), the saver script will inquire about the revision control of the version in use and will store the version number, whereas the restorer, when given the revision number, will pull out the required version of the design.
Scope reduction reaps the most benefit when it comes to debugging large systems. It is often the case that the simulation speed in a debug environment runs much slower than in a normal simulation environment, because of additional data visibility in the debug environment. Therefore, engaging directly in debugging without first reducing the scope of the circuit can prove to be unproductive. Scope reduction falls into two categories: reducing circuit and test case size, and limiting the simulation time. Reducing circuit and test case size removes as much as possible the parts of the circuit and test case while retaining the manifestation of the bug. To be effective, it requires insight into the design of the circuit and the content of the test case. However, sometimes it can be accomplished by trial and error. For example, an error occurring in an instruction fetch unit may mean that the I/O unit and the instruction decode unit can probably be eliminated from the circuit without affecting the error. However, there is no guarantee that these units can be safely discarded, because it could be that the error symptom surfaces in the instruction fetch unit but the root cause lies in the I/O and instruction decode unit (for example, erroneous instruction decoding causes an incorrect speculative instruction fetch). Therefore, every time a part of the design is eliminated, the simulation should be run to confirm that the nature of the error is preserved.
When a part of the design is cut, some severed lines (inputs) require that they be supplied with signal values that existed before the surgery. This is required because the rest of the design still gets input from the severed unit. To emulate the severed unit, all input values from the unit are recorded into memory during a simulation and are replayed from memory after the unit is removed. That is, during a simulation without the severed unit, the values at the interface are read from memory. As an example, before cutting out the I/O unit, the values across the interface between the I/O unit and the rest of the circuit are recorded for the simulation, as shown in Figure 6.1A. Then the I/O is removed, and memory storing the recorded values is instantiated as a part of the test bench and it supplies the values. In this example, during a simulation without the I/O unit, at time 20, value 1010 is read from memory to emulate the I/O unit. Similarly, at times 21, 22, 23, and so on, values 0111, 0001, 1100, and so on, are output from the memory to the rest of the CPU. The following code demonstrates the part of the test bench emulating the I/O unit:
module testbench;

cpu cpu(.ioport1(stub1),.ioport2(stub2),...);
// the io ports, external ports, of I/O unit are stubbed.

// the following emulates the I/O unit
initial begin
   #20 testbench.cpu.in1 = 4'b1010;
   #21 testbench.cpu.in1 = 4'b0111;
   #22 testbench.cpu.in1 = 4'b0001;
   #23 testbench.cpu.in1 = 4'b1100;
   ...
end

// other parts of test bench
...
endmodule // end of test bench
Reducing the design size can be regarded as spatial reduction. Its counterpart, temporal reduction, minimizes the test case while preserving the error. An error observed after the simulation has run ten million cycles will probably still show up by rerunning the simulation only during the last 10,000 cycles. If the same error can be reproduced with a shorter test case, debug time is reduced. Cutting down test cases requires an understanding of the functions of the test cases. If a long test case is made of independent, short diagnostic tests, then only the last diagnostic test is needed to reproduce the error. Furthermore, if the state of the design can be determined to be correct at a time, say T, before the time the error happens, then the error must be triggered after time T. Then the error can be reproduced by running the simulation from time T only.
A brute-force method is to perform a binary search on the test case. If the error happens at time S, then run simulation from time S/2 to S, with the circuit initialized to the state at time S/2. If the error occurs, the length [S/2,S] is further cut in half and one repeats the procedure. If the error does not occur, the starting time is selected halfway through the interval [0, S/2]. This process continues until a reasonably short test case is obtained. This binary reduction is summarized here:
When a test case is cut at time T, the state of the design must be initialized to the state at time T, which can be obtained by simulating the test case using a higher level and faster simulator, such as an architectural simulator from time 0 to T. Then the state at time T is transferred to the design. For example, if a processor runs a C program, as shown here, and assumes that each statement takes the same amount of time to execute, then a search in time can be done equivalently on the statements:
if (x == y) record(a, b);
a[0] = v[0];
b[N] = w[N];
for (i=0; i< N; i++){
   prod [i] = a[i] * b[N-i]; // midpoint statement M
   ind[i] = v[i] + w[N-i];
}
x = prod(N/2);
y = ind(N/3);
function(a,b);
If statement M is the midpoint of the program when i = N/2, assuming N is even, to run from statement M for i≥N/2, the values of variables a, b, v, and w referenced when i≥N/2 must be computed a priori (for example, by executing the program up to statement M for i<N/2). The reduced test case is
//These values were computed a priori:
//a[0], ..., a[N], v[N/2], ..., v[N],
//b[0], ..., b[N], w[N/2], ..., w[0]
//ind[N/3]
for (i=N/2; i< N; i++){
   prod [i] = a[i] * b[N-i]; // midpoint statement M
   ind[i] = v[i]+w[N-i];
}
x = prod(N/2);
y = ind(N/3);
function(a,b);
Hard bugs often surface only after millions or even billions of cycles of simulation. To obtain a short test vector for debugging, states of the simulation are saved at regular intervals so that when an error occurs, the state last saved can be used to initialize a simulator, and debugging can start from that point in time instead of the very beginning of the entire simulation. Saving the state of a simulator or, in general, of a machine, is called check pointing. If the observed error had already occurred at the time of last check pointing, the next-to-the-last check point has to be used. The idea is to select the most recent check point before the error is activated.
Check pointing can be implemented using custom routines or check pointing commands built into the simulator. If a simulator has a check pointing command, it also comes with a command restoring a check point. Check pointing takes on two forms. One form is to save the state of the design, which includes states of all sequential components and memory contents. When saved in this form, simulation of the design can be resumed on any other simulator by simply initializing the state of the design to the saved values. To initialize, the user needs to write a task or function—in other words, the restore routine is user defined. The other form of check pointing saves the simulator's internal image of the design. For this kind of check point, the simulation can only be restored to a similar type of simulator. An advantage is that the restore routine comes with the simulator.
The interval to check point is a function of design complexity and tolerable simulation performance. The more frequent one “check points,” the slower the simulation runs, but the closer a check point is to the error occurring time, which gives a shorter debugging time. A typical interval for a CPU design is around several thousand clock cycles. Saved check points use disk space and can become a problem for long simulation runs. In practice, only the few most recent check points are saved (for instance, the last three check points).
Another typical application of check pointing is seen during simulation on a hardware accelerator. A hardware simulator runs orders of magnitude faster than a software simulator and thus is used for finding bugs that hide deep inside a system’s state space. Once a bug is detected, the state of the hardware simulator or the state of the design is check pointed and the image is restored on a software simulator for debugging. There are several reasons for check pointing from hardware to software. First, a hardware simulator is usually shared by several projects; hence, debugging on a hardware simulator occupies much time and should be strictly prohibited. Second, long simulation runs on a hardware simulator prevent one from dumping the entire simulation run for debugging or rerunning it on a software simulator. Finally, software simulators provide much more visibility to the internal circuit nodes than hardware simulators, making it easier to debug.
IEEE standard 1364 provides a pair of system tasks for check pointing: $save and $restart.$save("filename") system task saves the complete state of the simulator into a file named filename. On the other hand, $restart("filename") restores a previously saved state from file filename.$incsave saves only what has changed since the last invocation of $save, and hence has less of a performance impact. An example of check pointing using the IEEE commands is as follows:
initial
#1000 $save("full_state");

always begin
   // save incrementally every 10,000 ticks
   //but only the last two check points are preserved.
   #10000 $incsave ("inc1_state");
   #10000 $incsave ("inc2_state");
end
'ifdef START_FROM_SAVED
   // restore to the beginning of simulation
   initial $restart("full_state");
'endif

'ifdef START_FROM_LAST_SAVED
   // restore to the last check point of simulation
   // assume the last saved file is inc2_state
   initial $restart("inc2_state");
'endif
This code saves a full state at time 1000. Then it saves an incremental image every 10,000 cycles. Furthermore, only the most recent two check points are kept. Figure 6.2 shows the actions of the previous save and restart commands. When $restart("full_state") is executed, the state image saved at time 1000 is loaded into the simulator and the simulation runs from that time on. When $restart("inc2_state") is executed, the state image saved at time 41000 is loaded into the simulator and the simulation starts from there. To start the simulation at time 31000, $restart("inc1_state") is used. However, a simulation cannot start at time 21000 or 11000, because the saved states were already overwritten.
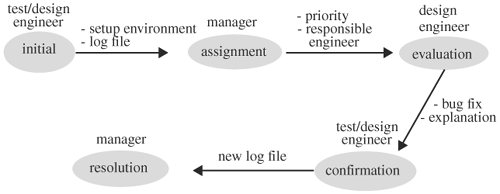
Before an error is sent out for debugging, it should be entered into a tracking system. The purpose of a bug tracking system is to prevent bugs from being lost or not getting fixed in a timely fashion. Bug tracking software, which can be invoked by anyone from the project team, has the following five states: initial, assignment, evaluation, confirmation, and resolution. The states and their transitions are best described using a finite-state machine paradigm. Figure 6.3 shows a state diagram for a bug tracking system, or issue tracking system. When an error is first observed, the test or design engineer enters it into the system and the bug starts in the initial state. The data entered consist of the date the bug was discovered, the environment setup to reproduce the error, and a log file showing the error. Once the error is registered, the manager or project lead is notified. The manager takes the error to the second stage, assignment, where she prioritizes the error and assigns it to the responsible engineer. After this stage, the error has been tagged with a priority and the name of the responsible engineer. Then, the bug tracking system notifies the responsible engineer. When the engineer gets the notification, he moves the bug status to the evaluation state and investigates it. The engineer uses the setup environment and the log file to determine the nature of the error. If it is indeed an error, he uses the setup environment to reproduce the error, corrects it, documents the root cause, and transits the bug tracking system into the next state: confirmation. If it is not a real error (such as a user error), the engineer records an explanation and moves the bug to the confirmation state. At the confirmation state, the initiator reruns the test using the new fix from the design engineer to confirm the bug is indeed fixed. If it is, he affirms the fix, attaches the new log file, and moves the system to the resolution state. If it is not a real error, and the initiator agrees, the initiator advances the system to the resolution state. If, for any reason, the initiator disagrees with the design engineer, the design engineer is notified. In this case, the bug stays in the confirmation state. At the resolution state, the manager assesses the root cause of the bug and the fix. If it is satisfactory, the bug is marked as closed and the test case may be used for regression. Once a bug is entered into a bug tracking system, it cannot be removed by anyone. The only satisfactory outcome of a bug entered is at the resolution state.
Furthermore, bugs are prioritized according to their impact on the project's functionality, schedule, and performance. Bug priority tracks the functionalities in the project. A high-priority bug disables a high-priority functionality. There are bugs that are not design errors per se, but are features that customers prefer in the future. In this case, these “bugs” are also prioritized according to effort to implement and market demand, and they may be swept into a future enhancement category. An issue tracking system can sort entries by priority, assignee, status, date, or combinations thereof. A typical bug entry in an issue tracking system looks like that shown in Table 6.1.
Table 6.1. Sample Bug Entries in an Issue Tracking System
Problem | Priority | Assignee | Date/Filer | Status | Comment |
|---|---|---|---|---|---|
System hangs whenever INT and REQ are both active.test-case: /proj/test/hang_int | 1 | J. Smith | 11.2.03/M. Hunt | Evaluation | Error reproduced; it appears to be bus contention |
Receiver counter is off by 1.test-case: /proj/test/CNT | 2 | A. W. | 2.3.04/ N. Lim | Confirmed | Fixed |
Cannot take 8 clients at the same time | 4 | M. Manager | 9.4.03 | Resolved | Future enhancement |
Debugging can be done in interactive or postprocessing mode. In interactive mode, users debug on a simulator. They run the simulator for a number of cycles, pause it, examine the node or variable values in the circuit, continue simulating for a number of cycles, and repeat these steps until the problem is resolved. The following is a sample interactive debug session. The simulator was paused after running a specific number of cycles. When it paused, it entered into an interactive mode with prompt >. The commands typed by the user are in bold. The user first prints the value of the hierarchical node top.xmit.fifo.out. Then she sets the current scope to be top.xmit.fifo. Next she finds all loads driven by node out, for which the simulator returns three loads: in_pipe_a, x1_wait, and loop_back. Then the value of loop_back is printed. When data examination is completed at cycle 32510, the simulation resumes for 10,000 cycles:
...
simulation paused at cycle 32510.
> print top.xmit.fifo.out
> 32'h1a81c82f
> scope top.xmit.fifo
> find_load out
> in_pipe_a, x1_wait, loop_back
> print loop_back
...
> continue 10000
resume simulation from cycle 32510
...
In interactive mode, because the simulator does not save values from past times, the user can only look at values in the current and future cycles. In postprocessing mode, a simulation is first run to record the values of the nodes and variables into a file. Then debug software is invoked to read in data from the file. It displays the values of nodes and variables at the time specified. Postprocessing debugging relinquishes the simulator and hence more users can share the simulator. On the other hand, large amounts of data are dumped, costing disk space and time. In practice, almost all hardware debugging is done in postprocessing mode. In the following discussion we study data dumping in more detail.
As discussed earlier, an effort should be made to reduce circuit size and shorten the test case to speed up debugging. After a circuit and a test case of manageable size are in hand, simulation values are traced or dumped to determine the root cause of the bug. Instead of dumping out values for all nodes at all times during the simulation, which has a drastic impact on performance, it is wise first to gauge the proximity of the bug in location and time, and dump out node values within the neighborhood and time interval. This initial judgment of the bug is an art that requires knowledge of the design, and intuition. The nature of the bug provides a hint regarding physical proximity, and the method of locating it resembles that of circuit scope reduction, but differs in that the neighborhood in this case can be arbitrarily small, whereas the scope in circuit reduction must satisfy the goal of preserving the bug. As debugging progresses, the dumping neighborhood can widen or shift. When a neighborhood moves, a simulation needs to be run to obtain data. If data dumped in several sessions can be merged, which depends on the format of the dumped data, then only the incremented scope needs to be dumped. The complete scope of data can be obtained by merging the previous incrementally dumped data. An optimal dumping neighborhood becomes clearer as experience grows.
Determining the dumping interval, or window, can be done via trial and error or it can be derived from a statistical mean. For example, based on past bugs’ data, one can compute according to the functional unit to which a bug belongs, the time interval between the moment a bug is triggered to the time it is detected, compute the average time interval for each functional unit, and use the average interval of a functional unit as the initial dumping interval for the bug currently under investigation. The functional unit in which the bug is presumed to reside may change as debugging progresses. If a bug leads to signal values outside the dumping interval, another signal dump simulation run is required. The new interval is further back in time and ends where the last time starts.
Figure 6.4 illustrates a typical dumping sequence dictated by the backtracking movement of a bug and the interaction of spatial neighborhoods and temporal windows. The two regions represent two neighborhoods. N1 is the first dumping neighborhood. There are four signal dumps labeled on the arrows. The bug is first observed at node a at time interval I1. Scope N1 is dumped for interval I1. As the bug is traced backward across multiple FFs, the time goes outside interval I1 but remains within the same neighborhood. Thus, a second dump is executed for interval I2. As backtracking continues to node b in the circuit, the signal goes outside neighborhood N1. Thus neighborhood N2 is dumped for interval I2. Again, backtracking across multiple FFs moves the time past interval I2, causing another dump for interval I3. In interval I3, the root cause of the bug is found.
The mechanism for dumping node values should be methodologically designed into the RTL. A basic feature of a dumping mechanism is the ability to select the dumping scope either at compile time or runtime. The scope can be a module, a task, or a function.
Compile-time dumping selection can be implemented using ifdef directives to select the desired dump commands. Runtime selection, on the other hand, can be implemented by scanning in runtime arguments. Many simulators have built-in system tasks for checking command arguments on the command line (for example, $test$plusargs()). Compile-time selection implementation runs faster, but the user must know what to dump at compile time. In the case when dumping is activated only when an error is detected, runtime selection is more convenient. Based on the nature of the error, an appropriate scope is selected to dump out its node values.
To dump out node values inside a scope, most simulators have built-in system tasks so that the user does not need to write a long $display statement for all nodes to be dumped. An example of a dump command is IEEE standard command $dumpvar (1, module_name), which saves the values of all nodes at level 1 inside scope called scope_variable into a file which can be specified by $dumpfile("filename"). The following is an example showing a compile-time selection implementation and a runtime selection implementation. To invoke the compile-time selection, just define the corresponding variable, such as 'define DUMP_IDU. To invoke the runtime selection, use plusarg at the simulator command line, such as simulator +dump_IDU+dump_L2:
// compile-time selection
'ifdef DUMP_IDU
   $dumpvar(1, instruction_decode_unit);
'endif
'ifdef DUMP_L2
   $dumpvar (1, L2cache);
'endif
// runtime selection
if ($test$plusargs("dump_IDU") )
   $dumpvar(1, instruction_decode_unit);
if($test$plusargs("dump_L2");
   $dumpvar(1, L2cache);
Lightweight dumping records only select strategic variables and hence has a minimal performance impact while sacrificing full visibility. Lightweight dumping is beneficial for error scouting simulation runs when errors are not known to happen a priori. However, when errors appear, the information from the lightweight dump narrows the scope for a full-fledged dumping.
In this section we will look at the basic principles and practices in debugging hardware designs. First we will discuss using expected results as a guide to trace errors, and then we will study how erroneous signals are traced forward and backward to locate their root cause. There are many forking points during tracing, and we will introduce a branching diagram to keep track of the paths. As sequential elements are traced, the time frame changes. We will consider the movement of the time frame for latch, FF, and memory. Next we will look at the four basic views of a design and their interaction in debugging, along with some common features of a typical debugger.
Debugging starts with an observed error, which can be from a $display output, failed assertion, or a message from a monitor, and ends when the root cause of the error is determined. Before the user can debug, he must know what is correct (called the referenced value) and what is not. The definition of correctness is with respect to the specifications, not with respect to the implementation. For example, if a 2-input AND gate is mistakenly replaced by an OR gate and the inputs to the OR gate are 1 and 0, then the person debugging must know that the expected output should be 0 instead of 1. That is, the output value of 1 is incorrect even though the OR gate correctly produces 1 from the inputs. It should be stressed that this distinction between the correctness of the implementation and the correctness of the implementation's response be fresh in the mind of the person who is debugging. When one gets tired after hours of tracing, it is very easy to confuse these two concepts and get lost. The reference behavior is the guide for a designer to trace the problem. Without knowledge of the reference behavior, one will not be able to trace at all. The questions to ask in debugging are the following: What is the reference value for this node at this time? Does the node value deviate from the reference value? If the values are the same, tracing should stop at the node. If they are different, one would follow the drivers or the loads of the node to further the investigation. The value of a node that is the same as the reference value for the node is called expected.
The root cause is the function that maps expected inputs to unexpected outputs. Therefore, a module that accepts expected inputs but produces unexpected outputs must have an error in it. Using the previous example of a misplaced OR gate, the OR gate takes in the expected inputs, 0 and 1, and produces 1, which is unexpected. Therefore, the OR gate is the root cause. On the other hand, a module accepting unexpected inputs and producing unexpected outputs may or may not have an error. Furthermore, an error can have multiple root causes.
As debugging progresses, the reference behavior can take on different but equivalent forms. For example, if a reference value on a bus is 1010, then as we trace backward to the drivers of the bus, the reference behavior becomes the following: Exactly one bus driver is enabled and the input to the driver is 1010. Similarly, if we trace forward and see that this reference value is propagated to a decoder, then the reference value for the output bits of the decoder becomes the following: Only the tenth bit is active. Furthermore, a reference value can bifurcate and become uncertain, creating more possible routes to trace. A case in point is that the reference value of the output of a 2-input AND gate is 0, but the actual value is 1. Moving toward the inputs, the reference behavior bifurcates into three cases: either or both inputs are 0. To investigate further, you must assume one case of reference behavior to proceed. If you end up at gate or module with outputs that are all expected, the assumption is wrong. Then the next case of reference behavior is pursued. This phenomenon of uncertainty and bifurcation is the major cause of debugging complexity. Therefore, a key to effective debugging is to compute correctly the reference values during tracing.
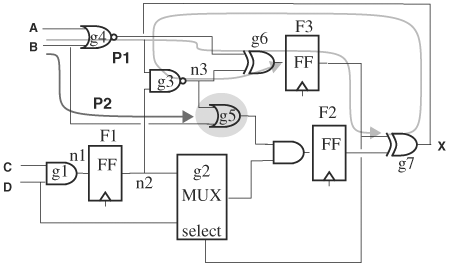
There are two methods of debugging: forward tracing and backward tracing. Forward tracing starts at a time before the error is activated. Note that the effect of an activated error may not be seen immediately, but only after cycles of operation. Therefore, a critical step in forward tracing is finding the latest starting time before the error is activated, and there is no general algorithm to determine such times. Assuming that such a time is given, we must assume all node values are correct, or expected, and move along the flow of signals, forward in time, to get to the point when the error is activated. During this search, the first statement, gate, or block producing unexpected outputs contains a root cause. Besides finding a good starting time, another difficulty in forward tracing is knowing where in the circuit to start that will eventually lead to the error site. Figure 6.5 shows forward tracing paths for node B. The shaded OR gate is the root of the problem. Of the two forward tracing paths, one leads to the error site and the other does not. When we come to a node with multiple fanouts, we must decide which paths to pursue, and there are exponentially many such paths. The ability to locate the starting point and making wise decisions at multiple-fanout forks can only be acquired through understanding the design and the nature of the bug.
Backward tracing proceeds against the flow of signals and backward in time to find the first statement, gate, or block that yields unexpected outputs from expected inputs. Unlike the uncertainties faced in forward tracing, the starting site and time are the location and time the error was observed, and one moves backward toward the fanins. With this method, the error is an unexpected behavior. The person debugging must know the reference behavior and be able to translate the reference behavior as he proceeds backward. The major difficulty in backward tracing, shared with forward tracing, is that when a gate, statement, or a block has multiple fanins, a decision must be made regarding which fanin to follow next, and there are exponentially many possible paths. When a multiple-fanin gate is encountered, the path or paths to pursue are the ones that show unexpected values. However, it is often possible that several paths show unexpected values. Figure 6.6 shows three backward tracing paths from node X.
With either tracing method, the fanin and fanout points are branching points that require making decisions. If a selection does not turn up root causes, we need to backtrack to the decision points to select other paths. To keep track of what has been visited and what has not, a tracing diagram comes in handy. The branching points in a tracing diagram systematically enumerate all possible selections and guide the selection decision in backtracking. Tracing diagrams are usually generated by a software program instead of being created by hand.
A node in a tracing diagram is either a primary input, port of a gate, module, or user-defined node. A user-defined node is a net that terminates tracing, e.g. a known good net. An arrow from node A to node B means that there is a path from A to B. The path is a forward path in forward tracing, and is a backward path in backward tracing. A reduced tracing diagram contains only nodes with more than one outgoing arrow, except for primary inputs and user-defined nodes.
Figure 6.7 shows two reduced tracing diagrams: one for forward tracing from primary input B and the other for backward tracing from net X. The convention used here is that the input pins of a gate are numbered from top to bottom starting from 1. Outputs are similarly numbered. A node labeled as G. i represents the ith input of gate G in forward tracing, and the ith output in backward tracing. The rectangular nodes are user-defined nodes that, in this case, are the fault site. Fault sites are not known in advance in practice; they are shown here for illustration. The shaded nodes are primary inputs.
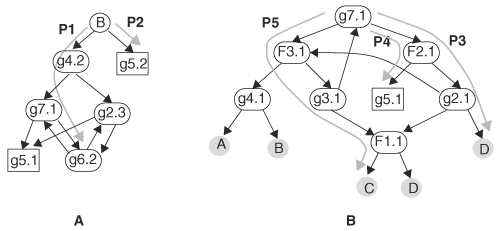
Figure 6.7. Tracing diagrams for forward tracing of primary input B (A) and for backward tracing of wire X (B)
When obtaining a reduced forward tracing diagram, gates with only one fanout are not represented in the tracing diagram because these gates have only one outgoing arrow. Similarly, nodes having only one fanin in a reduced backward tracing diagram are not shown. Forward tracing starts from primary input B. At the outset there are two fanouts: g4.2 and g5.2. Thus, node B in Figure 6.7A has two branches: one leading to node g4.2 and the other leading to node g5.2. The node inside the box, g5.2, is the root cause of the problem, and we assume that the debugging process ends when that node is reached.
If there are loops, the loop may be traversed several times. Each time a sequential element is crossed, the time frame may change. For instance, the loop in Figure 6.7A, consisting of g7.1 and g6.2 can be traversed multiple times, and each traversal advances the time by one cycle because the loop contains FF F3. Similarly, the loop in Figure 6.7B, consisting of g7.1, F2.1, g2.1, F3.1, and g3.1, contains two FFs, and therefore time retracts by two cycles whenever the loop is traversed once.
In tracing, when a combinational gate is traversed, either forward or backward, the current time of the simulation does not change. When a sequential element is traversed, the time of the simulation changes depending on whether it is forward or backward tracing. For example, when forward traversing an FF (such as from data to output), the time of the simulation advances by one clock cycle because the value at the output happens one cycle after the data input. On the contrary, in backward traversing (from output to data), the time of the simulation retracts by one cycle. Consider forward tracing from node n1 of Figure 6.5, and suppose the current time of the simulation is N. When we arrive at node n2, time advances to N+1, because FF1 has been traversed. When we continue to node n3, the simulation time stays at N+1 because the NOR gate is a combinational gate. In general, to compute the amount of time movement when traversing from node A to node B across a sequential circuit, we determine the time for data to propagate from A to B. Time moves forward in forward tracing and backward in backward tracing.
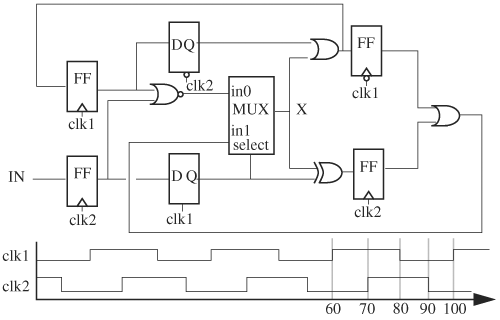
In a circuit with multiple clocks, time advance is with respect to the clock of the sequential element that has just been traversed. Consider the multiple-clock domain circuit in Figure 6.8. Suppose we are looking at node D and we want to determine the time at node A, which affected the current value at node D. Assume the current time at node D is the last rising edge of clock clk2 at time 19. Moving to the input, the time at which the value at node C might have changed can be anywhere between 9 and 14, during which the latch was transparent. To determine exactly when, we need to examine the drivers to the latch. Going over the AND gate does not change time. Node B could change at a falling transition of clock clk2. Therefore, node C might change at time 6. Moving backward further, node A might change only at a rising transition of clock clk1. Therefore, the value of node A at time 1 affects the current value at node D. If the current value of D is erroneous, the value of A at time 1 is a candidate to be examined.
The same principle can be applied to circuits in RTL. Consider the following sequential element:
DFF g1 (.clk(clk1), .Q(A), .D(D), ...);

always @(clk2) begin
   data = A;
   @ (posedge clk2) begin
     state <= data << guard;
     out <= state ^ mask;
   end
end
We want to determine the time of variable D that affected the current value of out. The current time is 17, using the waveforms in Figure 6.8. To trace backward, we need to determine the last time clock clk2 had a positive transition, which, based on Figure 6.8, last changed at time 11.5. The assignment to data was executed when clk2 changed at time 6. Hence, the value assigned to data from A is the value of A at time 6. Because A is the output of the DFF g1, which is clocked by clk1, the time of D that affected A at time 6 is 1. Therefore, the time of D that affected out is 1. Any error in variable D at time 1 will be observed in variable out at time 17.
To understand the cause of a symptom at a node, the logic or circuitry potentially contributing to the node needs to be traced. Three common items are traced in practice: load, driver, and cone. Load tracing finds all fanouts to the node and is often used in forward debugging. Finding all fanouts of a node, which can be difficult in a large design in which the fanouts are spread over several files and different directories, is done with a tool that constructs connectivity of the design. Similarly, such a tool is used to find all drivers, or fanins, of a node. Tracing fanins or fanouts transitively (finding fanins of fanins) is called fanin or fanout cone tracing. A fanin cone to a node is the combinational subcircuit that ends at the node and starts at outputs of sequential elements or PIs. Similarly, a fanout cone is the combinational subcircuit that starts at the node and ends at inputs of sequential elements or POs.
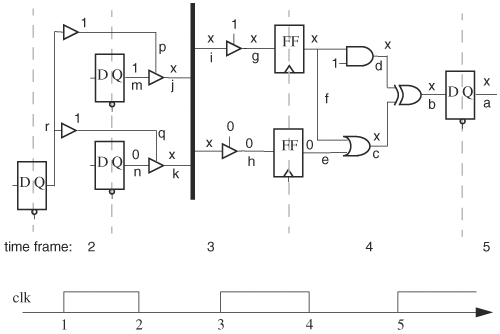
Let’s consider an example of debugging that requires driver and cone tracing. Consider the circuit in Figure 6.9 in which a data bit at node a has an unexpectedly unknown or indeterminate value x at the current time 5. Assume that all FFs and latches are clocked by the same clock clk, with the waveform shown. For simplicity, let’s assume that all clock pins are operational, free of bugs. To debug, we trace all drivers to node a. Because node a is the output of a transparent low latch, the time of the latch’s input that affected node a at time 5 is between 4 and 5. Therefore, as we backtrack across the latch, the current time frame changes from 5 to 4. The driver to the latch is an XOR gate with an output value that is unknown. The XOR gate has two fanins, both of which have unknown values. Selecting the lower fanin, we arrive at an OR gate. One of its fanins, node f, has an unknown value. Node f is driven by an FF that had an unknown input value. Because this FF is positive-edge triggered, crossing it backward moves the current time frame from 4 to 3. The driver to the FF is a tristate buffer that is enabled at time 3; thus, the unknown value comes from the bus. The value on the bus indeed had an unknown value. Now we find all drivers to the bus and determine which ones are active at time 3. There are two active drivers to the bus and they are driving opposite values because their inputs are opposite. Further investigation into why both drivers are turned on at the same reveals the root cause: one of the buffers to the bus drivers should be an invertor.
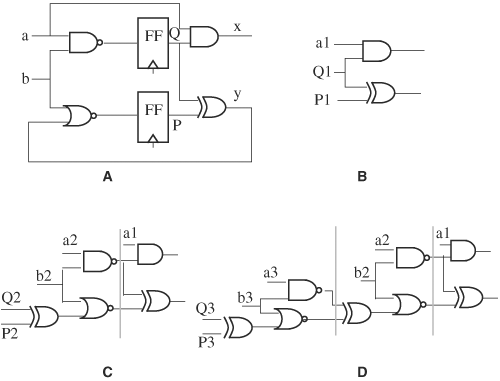
In a large circuit, instead of tracing drivers one gate level at a time, the entire cone of logic can be carved out for examination. Cone tracing is not limited just to combinational cones; it can be a cone of logic spanning a couple cycles. Three fanin cones for nodes x and y are shown in Figure 6.10. One-cycle cones are just combinational cones. Multiple-cycle cones are derived by unrolling the combinational logic multiple cycles and removing the sequential elements between cycles. For example, the two-cycle cone consists of all gates that can be reached from node x or y without crossing more than one FF. Similarly, the three-cycle cones include all gates reached without crossing more than two FFs. The primary inputs to a cone are the original primary inputs and outputs of the FFs. The cone’s primary inputs are marked with the cycle numbers. For example, P3 means the value of P three cycles backward from the current cycle. The current cycle is 1. Note the fast growth of cone size as the number of cycles increases; thus, in practice, only a small number of cycles are expanded for logic cones.
Whenever an FF or a latch is crossed, time progresses or regresses. When memory or an array is crossed, the number of cycles that the time changes is a function of what data are being traced and can be deduced as follows. Suppose that we find out that the output of memory is wrong and we want to back trace to the root cause. Assuming the current time is T, we first determine whether the address and control signals to the memory (such as read, write, and CS) at time T are correct. If any of these signals is not correct, tracing continues from that line and time does not change. However, if the address and control signals are correct, then the wrong data were caused by either a bug in the memory model itself or by writing wrong data to that address. We search for the most recent time at which that address was written. Let this be time W. If the data at time W are not identical to the output at time T, the memory model has a problem. If the data are the same, the input data are wrong, tracing follows the input data, and the time frame becomes W. That is, the amount of time of the backward time lapse is T – W. To illustrate this algorithm with the memory and waveforms in Figure 6.11, let’s assume that the output of memory at address 8'h2c is expected to be 32'hc7f3 at time 1031, but is 32'ha71 instead. We back trace across memory. From the waveforms, the control signals, CS, W/R, and address are correct. That is, CS is active, W/R is READ, and the address is 8'h2c. So we search for the last time the memory was written at address 8'h2c, and the time was 976. Because the input data, value of in_data, are identical to the output data at time 1031, the memory model is fine and the error tracing continues from time 976 to determine why the input data had the wrong value of 32'h0a71. The algorithm for back tracing memory is shown here:
In summary, forward tracing is just simulation. Backward tracing is searching the current or last input combination or condition that produced the current output. If found, time moves to that time and back tracing continues from there.
Loop constructs occur most often in test benches, as used when iterating array elements, and usually do not contain delays. Hence they are executed in zero simulation time. That is, variables of the loop are computed at multiple times at the same, current simulation time as the loop is iterated. An example of such a loop is as follows:
always @(posedge clock) begin
   if (check_array = 1'b1)
      for (i=0; i<= 'ARRAY_SIZE; i=i+1) begin
        var = array[i];
        if( var == pattern ) found = 1;
       ...
      end // end of for loop

   if (found) ...
end // end of always block
The loop is computed with no simulation time advancement. Variable var is assigned to array[i] the number of times equal to 'ARRAY_SIZE at the current simulation time.
Multiple writes and reads to the same variable at the same simulation time cause difficulties in debugging, because when the simulation is paused, the variable value displayed is that of the last write. For example, the value of var displayed when the simulation is paused is array['ARRAY_SIZE]. If a bug is caused during the loop computation, seeing only the last value of the variable is not enough. To circumvent this problem, variables inside a zero time loop need to be saved for each loop iteration so that their entire history can be displayed at the end of the simulation time. For the previous example, the intraloop values of var can be pushed to a circular queue every time var is written:
always @(posedge clock) begin
   if (check_array = 1'b1)
      for (i=0; i<= 'ARRAY_SIZE; i=i+1) begin
        var = array[i];
        queue_push(var);
        if( var == pattern ) found = 1;
       ...
      end // end of for loop

   if (found) ...
end // end of always block
Some debuggers show all intraloop values of loop variables (such as var[1], ..., var['ARRAY_SIZE]) when the variables are displayed.
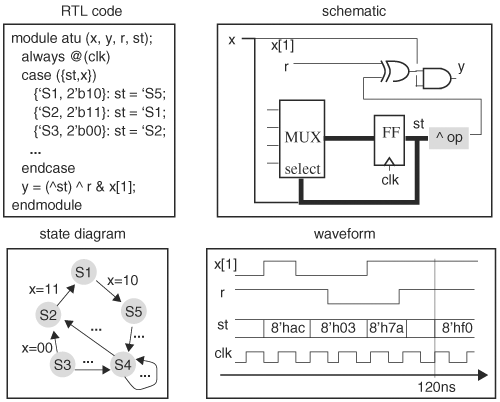
In RTL debugging, four views of a circuit are essential—RTL, schematic, finite-state machine, and waveform—although other views exist, such as layout and DFT. A circuit and waveform viewer displays these four views and allows the user to switch among views. An RTL view shows the design code. A schematic view is a circuit diagram representation of the design code. The viewer creates the schematic by mapping simple code constructs in the design to a library of common gates. For example, a quest operation x ? y : z is mapped to a multiplexor. Other simple constructs are AND, OR, multiplexor, bus, and tristate buffers. Finite-state machines and memory, if they conform to a set of coding guidelines, will also be recognized. The mapper attempts to recognize as many common constructs as possible. If recognized, the constructs are represented with graphical symbols in the schematic view. The constructs not recognized are “black boxed.” A schematic view preserves the module boundaries of the design so that a module instantiation is represented as a box labeled with the module instance name. To go inside the module, simply click on the box. The finite-state machine view shows state diagrams of finite-state machines. To recognize finite-state machines, many viewers assume certain finite-state machine coding styles. Finally, a waveform viewer displays waveforms of nodes. The waveforms are created from dumped data files in either standard format, such as VCD, or vendor-specific format, such as fsdb. Figure 6.12 shows an example of the four views. In the schematic view, the reduction XOR ^ is not recognized as a common construct and hence is black boxed (the shaded box labeled ^ OP.) All other constructs are recognized and are represented by standard circuit symbols. The coding style of this example conforms to the finite-state machine’s coding style: hence, it is recognized as a finite-state machine and its state diagram is shown in the state machine view. The waveform view displays signals or variables specified by the user.
For most viewers, the different views of a circuit are coordinated by drags and drops. For example, to switch from RTL to schematic view, click on a variable or signal and drag it to the schematic view. The schematic view will display the scope (such as a module) in which the variable or signal resides. To see the waveform of a signal, simply drag and drop the signal to the waveform viewer. The different views offer their unique benefits. The RTL view shows the exact functionality of the design unit, the schematic view best displays connectivity, the state diagram view offers a functional and graphical description of the RTL code, and the waveform view reveals the temporal behavior of signals.
Let’s discuss some typical functionality in a debugger. The most basic functionality is tracing of drivers and loads of a node in the RTL and schematic views. With the schematic view, a command to trace a signal highlights all drivers or loads, depending on whether the driver or load option is set. Such a command can be a simple click on the signal. A continual command on a highlighted driver or load effects transitive tracing. With RTL view, a list of drivers or loads is shown when a net is traced. It is also possible to select a cone tracing option and have the debugger show a fanin or fanout cone of a variable or a net.
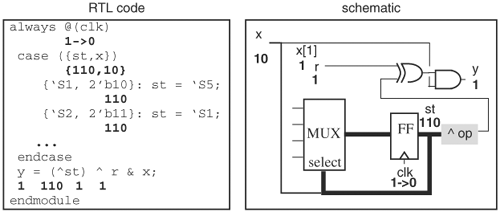
Tracing must be coupled with simulation values to be useful. When the user comes to a decision point—a multiple-fanin point for backward tracing or a multiple-fanout point for forward tracing—she needs to know the fanin or fanout that has the wrong value to continue. A convenient feature is annotation of simulation values in the RTL and schematic views (that is, signal values at the current time are appended to signals or variables). An example is shown in Figure 6.13, in which the annotated values are in bold. At the time shown, clock clk is in a falling transition. If the current time is changed, the values will change to reflect the simulation results. Based on the annotated values, the branches with expected values are pruned. Tracing follows the paths with unexpected values. To assist in keeping track of a tracing, branching points can be bookmarked and later revisited. An application of bookmarking is that after the current selection at a branching point turns out to be a deadend, the saved branching point is reverted so that another path is pursued.
With waveform view, waveforms can be searched for values or transitions. For instance, a waveform on a bus can be searched to find the time the bus takes on a specific value. Furthermore, two sets of waveforms can be compared, and the differences are displayed at the times they differ.
Finally, a debug session can be saved to a file and can be restored later. This is useful when a debug session needs to be shown to another person at a remote location. Then the saved session file is sent to that person.
When a group of engineers work on a project consisting of many files, files change constantly while being accessed. It is imperative to have a system to manage multiple variants of evolving files and track revision, as well as manage the project environment so that only the stable and correct version combinations of the files are visible. This is where a revision control system comes in. A revision control system has two objectives: to grant exclusive write access to files and to retrieve versions of files for read consistent with a user configuration specification. The exclusive write access feature ensures that a file can only be modified by one person at any time. This prevents a file from being edited simultaneously by more than one user, where only one user’s result is saved and the others' are lost. A file must first be checked out before it can be modified. Once a file has been checked out, it can no longer be checked out again until it is checked back in. A file can have many revisions.
When a file is accessed, the version of the file needs to be specified. A view of a project is a specification of versions, one version for each file. This specification determines a view and is sometimes called a configuration file. To access a particular version of a file, the user simply specifies the version number for the file in a configuration file. When a configuration file is activated to provide a view, only the files that meet the specifications in the configuration file are accessible. An example configuration is shown below. The first item is the name of a file, followed by the version used in this configuration. File all_RTL.h in this configuration has version 12.1. The last line indicates that any file without a specified version is assigned the version labeled RELEASE_ALPHA.
all_RTL.h version 12.1 // header file
CPU.v version 15.3 // top level CPU
itu.v version 15.3 // ITU block
* version ALPHA_RELEASE
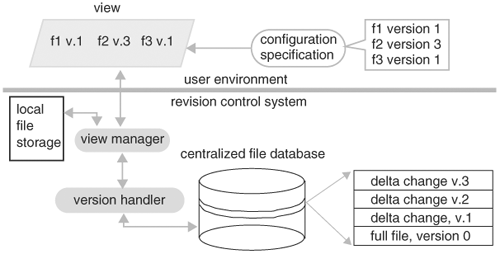
Conceptually, a revision control system has the following key components and architecture, as shown in Figure 6.15. All files are stored in a centralized database. Each file is stored in a layered structure, with the bottom layer being the full content of the file. On top of it is a collection of incremental changes to the file. Each layer is labeled with a version number. A user environment is determined by a view with a configuration specification. To reconstruct files of particular versions, the view manager in a revision control system takes in a configuration file and dispatches each file and its version to a version handler, which reconstructs that version of the file from the layers in the centralized database.
When a file is checked out, a copy of the file is placed in the local file storage area and can be modified by the user. Any modification to that file is only visible in that view, and thus does not affect other users using that file in other views. When changes are finalized, the file is checked in. When a check-in command is issued to the view manager, it removes the file from the local file storage area and passes it to the version handler, which attaches a new version number to the file and stores it incrementally to the centralized file database.
Once a file is checked in, its newly updated contents can be visible by specifying in the configuration file the new version number assigned to the file.
In practice, a configuration specification file does not indicate a version for every file explicitly. Instead, files without an explicit version are assumed to be retrieved from a default version, such as the latest version. Furthermore, when a project arrives at a milestone release, all checked-in files at that milestone can be tagged with a label, say ALPHA_RELEASE, so that a view of this milestone release can be invoked by simply using label ALPHA_RELEASE, as opposed to the version numbers for the files.
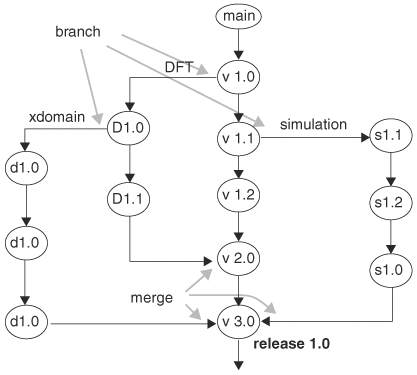
In a large project, restricting editing of a file only to one user serializes development and hampers progress. When several engineers need to modify a file during the same period of time, copies of the file can be created through a branching process so that the engineers can work on it simultaneously. When a branch is created, the original version becomes the main branch. Files on any other branches are revision controlled in the same way as the main branch. When a branch of the file has reached stability, it can be merged with the main branch. When merging two branches, the version control system displays the two versions of the file, highlights the differences, and prompts the user to make decisions regarding which of the differences should go to the merged version. Figure 6.16 is a diagram showing a file’s revision history, in which the nodes represent versions and the file has been branched three times. The main branch forks at a side branch for DFT team at version 1.0. Branch DFT has two versions, D1.0 and D1.1, before it merges with the main branch at version 2.0. In other words, version 2.0 has all updates from the DFT branch. The DFT branch has its own subbranch for another group doing cross-clock domain enhancement. This xdomain branch merges with the main branch at version 3.0. Similarly, at version 1.1, a branch is created for simulation work that itself has three versions and later merges with the main branch at version 3.0. Version 3.0 is also labeled as RELEASE 1.0, denoting a milestone version. A branch is not restricted to merging only with the main branch; it can be merged with any other branch.
The centralized file database must maintain high-quality code. To prevent bugs from being checked into the centralized file database, a set of tests, called check-in tests, must be run to qualify the to-be-checked-in code. If the tests pass, the code can be checked in. A check-in test may not detect all bugs; therefore, all files in the centralized file database should be run on a larger suite of tests, called a regression test, at regular intervals (such as weekly). A check-in test can be regarded as a smaller scale regression test. Its runtime is much shorter, so that code can be checked in without much delay.
Large regression tests can be layered further. First, the full regression test suite is run only occasionally (for example, biweekly or before a major release). Second, the regression suite of the next scale can be run for patch releases or for a weekly release. Third, a nightly regression suite is run to catch as early as possible bugs in newly checked-in files. Finally, a check-in test, when considered a regression test, is run whenever there is a file to check in. The sooner a regression is run, the sooner the bugs are detected; however, regression tests place a heavy burden on computing resources. A full regression test suite can take as much as a day on a computer farm, and a nightly test can take as long as 12 hours on a project server. Therefore, regression tests are often run after hours. If a regression suite takes more than 12 hours on the project server, it should be run either on a weekend or on a computer farm to avoid slowing down engineering productivity during the day. The frequency of running a regression test may increase as a milestone release approaches.
A regression suite, whether for a check-in test or the entire code database, collects test cases from diagnostics targeted at specific areas of the code, randomly generated programs, and stimuli that had activated bugs. A well-designed regression suite has good code and functional coverage, and a minimum number of overlapping tests. To verify a design using a regression test, the output from the regression run is compared with a known, good output. Because code and even project specifications can change over time, the known, good output also changes. Therefore, regression suites require maintenance. Mismatches from a regression run should be resolved in a timely fashion to prevent error proliferation. All errors from the current week’s regression run must be resolved by the end of the week so that these errors will not create secondary errors. An objective of the regression run is to minimize the number of errors per root cause while maximizing detection of errors.
Large regression suites are run distributively on a computing grid, also called a computer farm, which consists of hundreds and thousands of machines. The individual tests in a regression suite are run simultaneously on separate machines. A computing grid has a multiple-client/multiple-server queue as its interface. Jobs submitted are queued up and served by available machines from the farm. A job submission entry usually contains a script for job execution, a list of input files, and a point to store output files. When a job is finished, the submitter is notified of the status and the time of completion.
Release mechanism refers to the method by which code is delivered to customers. In a hardware design team, products can be RTL code, PLI C programs, CAD tools, and test programs. The most primitive release mechanism is to place files in a specific directory so that customers can download them. A key consideration in determining a release mechanism is to understand how the code will be used and to craft a release mechanism to minimize the impact on the customers’ application environment. For example, if the release product is an executable program that resides in the customer’s environment in the directory /application/bin/, one release mechanism is to put the release program in that directory under the customer’s revision control system and attach a new version number to it. To use it, the customer simply changes the version number of the product in his view. In this example, copying the released product directly to /application/bin may interfere with the customer’s operation. For instance, the older version of the program may be in use at the time of copying. A script that invoked the program multiple times might end up using the older version in the first invocation and the new version in the later invocations.
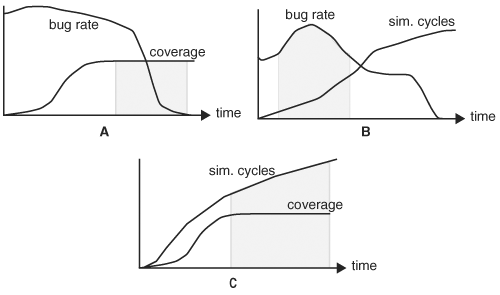
Because there are no direct ways to know that a design is free of bugs, several indirect measures such as tape-out criteria, are used in practice. One is the coverage measure. Usually, nearly 100% code coverage must be achieved. On the other hand, numerical measures for parameter and functional coverage may not be accurate enough to cover the complete functional spectrum and hence may be subject to interpretation. An alternative practical approach is to have project architects to review all functional tests to determine whether sufficient coverage is achieved. Another tape-out criterion is bug occurrence frequency or, simply, bug rate, which is the number of bugs found during the past week or weeks. If bug rate is low, it may indicate that the design is relatively stable and bug free. Of course, it may also mean that the tests are not finding any new bugs; therefore, they should be used in conjunction with a coverage measure. Another criterion is the number of cycles simulated, which offers some insight into the depth in state space in which the design is explored, but this lacks any proved accuracy. Figure 6.17 shows plot of the three tape-out criteria. The bug rate curve eventually becomes zero and the coverage metric reaches a plateau of 98% regardless of the increases in the simulation cycle. The tape-out time in this example is dictated by the coverage, because it reaches a plateau last. The simulation cycle can never reach a plateau.
In this chapter we examined the debugging process and the verification cycle. During the debugging process, the environment in which a bug is detected must be preserved to make the bug reproducible. We listed several common environment variables to be saved. To make debugging traceable, the circuit size should be reduced, which amounts to estimating the block in which the error might initially occur and, if a block of the circuit is carved out, replacing the rest of the circuit with a test bench that drives the block using the waveforms from the original simulation. Besides circuit size reduction, the test case can also be trimmed. This can be done with a binary search algorithm. When a test case is cut, the preserved portion of the test case may have to start from the same state as before, which can be obtained by simulating the beginning portion of the test case. Check pointing is a technique to save a system’s state so that the system can be run from the saved state instead of the beginning. This technique is often used to reduce test cases and to transfer a circuit from one simulator to another for debugging.
Next we studied the states of an issue tracking system and the process of filing and closing a bug. Then we looked at mechanisms of simulation data dumping and determined the window of data dumping. With regard to the debugging process, we first introduced forward and backward signal tracing and a branching diagram to keep track of decisions made during tracing. As sequential elements are traced, simulation times change accordingly. In particular, we studied tracing across FFs, latches, and memory arrays. To conclude tracing, we examined driver, load, and cone tracing as a basic step in debugging. In passing, we talked about zero simulation time constructs that require special attention to view their value progression. We looked at the basic four views of a design and some typical features in a debugger. When a bug is fixed, it needs to be checked into a centralized database. We then discussed the revision control system and its basic architecture and use, particularly code branching for paralleling design effort. Finally, we studied some aspects of a verification infrastructure: regression, computing grid, release mechanism, and tape-out criteria.
1. | If a bug is detected while running a simulation under a revision control system, the environment variables required to reproduce the bug must include the versions of all the files used in the simulation.
|
2. | To reduce circuit scope in debugging, it is often necessary to carve out a block of the circuit from a full chip and focus debugging on that block. To do so, a test bench modelling the surrounding circuit around the block has to be created. The test bench instantiates the block and drives the inputs of the block with the waveforms of the inputs captured in a full chip simulation run.
|
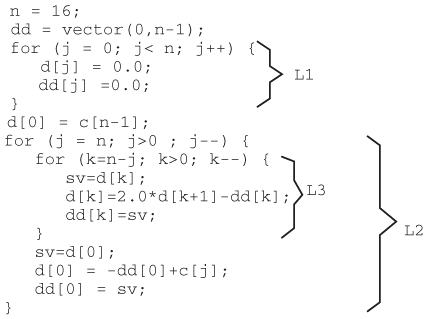
3. | In practice, midpoint statements in a test case are often approximated for various reasons. For example, the exact midpoint is difficult to compute or the state at the exact midpoint statement is complicated. Besides, if an approximation yields only a few more lines of statements while making restarting much easier, it is well worthwhile. In this exercise, assume that a microprocessor runs a C program shown in Figure 6.19 and an error occurs. Furthermore, let’s assume the inner loop, L3, is indivisible, meaning if an approximation for a midpoint statement is to be used, it should not happen inside L3. Use a binary test case reduction algorithm to trim down the test case. For simplicity, assume all assignment statements are of equal weight.
|
4. | Let’s consider the optimal check pointing interval. In a design, the average number of simulation cycles from the time an error is triggered to the time it is observed is P. Assume an error can occur at any cycle with equal probability, and simulations are run with a check pointing interval of L (in other words, the design is check pointed every L cycles).
|
5. | Referring to the five states of issue tracking, describe the roles of the manager and engineers, and the transitions of the states in each of the following scenarios.
|
6. | For the circuit in Figure 6.20, construct a forward tracing branching diagram with a depth of 3. The error site is X. Repeat for backward tracing. |
7. | Derive a two-cycle fanin cone for node |
8. | Consider the circuit and clock waveforms shown in Figure 6.22.
|
9. | Consider the following RTL code. If message “error found” is displayed, how do you go about finding the root cause using the backward tracing method? What problem may be encountered during your debugging process? always @(posedge clk) begin
hit = 1'b0;
for(i=0; i<=10; i=i+1) begin
vt = target[i];
if(vt == checked) hit = 1'b1;
end
end
always @(negedge clk)
if (hit == 1'b1) $display ("error found");
|
10. | In this problem, you learn to check point and restore from a check point, and dump out signals to debug. The following code is an asynchronous queue. First get familiar with the code and the functionality of the queue: module top;
parameter WIDTH = 32;
reg [WIDTH-1:0] in;
wire [WIDTH-1:0] out;
wire full, empty;
reg enq, deq, reset;
initial begin
enq=1'b0;
deq=1'b0;
reset <= 1'b1;
// add your input stimuli below
end
queue m(.in(in), .out(out), .enq(enq), .deq(deq),
.full(full), .empty(empty), .reset(reset));
endmodule
module queue(
out, // queue head
full, // 1 if FIFO is full
empty, // 1 if FIFO is empty
reset, // reset queue
in, // input data
enq, // enqueue an input
deq // dequeue the head of queue
);
parameter WIDTH = 32; // queue width parameter
DEPTH = 3; // length of queue
output [(WIDTH-1):0] out;
output full, empty;
reg full, empty;
input reset, enq, deq;
input [(WIDTH-1):0] in;
integer ic; // item count
integer i; // index
reg [(WIDTH-1):0] item [0: (DEPTH-1)]; // queue
// output is the head of the queue
assign out = item[0];
always @(posedge reset)
begin // reset queue
ic = 0;
full <= 1'b0;
empty <= 1'b1;
end
always @(posedge enq or posedge deq)
begin // enqueue or dequeue
case ({enq, deq})
2'b00: ;
2'b01: // dequeue head of queue
begin
for (i=1; i<ic; i=i+1)
item[i-1] <= item[i];
ic = ic-1;
end
2'b10: // enqueue input item
begin
item[ic] <= in;
ic = ic+1;
end
2'b11: // enqueue and dequeue simultaneously
begin
for (i=1; i<ic; i=i+1)
item[i-1] <= item[i];
item[ic-1] <= in;
end
endcase
full <= (ic == DEPTH) ? 1'b1 : 1'b0;
empty <= (ic == 0) ? 1'b1 : 1'b0;
end // always
endmodule
|
11. | Use the following stimuli to simulate the asynchronous queue in the previous problem: enq <= 1'b0; deq <= 1'b0; reset <= 1'b1; #5 reset <= 1'b0; #5 in = 32'habcdef; enq <= 1'b1; #5 enq <= 1'b0; #5 deq <= 1'b1; #5 deq <= 1'b0; #5 deq <= 1'b1; #5 deq <= 1'b0; #5 in = 32'h12345; enq <= 1'b1; #5 enq <= 1'b0; #5 in = 32'hbeef; enq <= 1'b1; #5 enq <= 1'b0; #5 deq <= 1'b0; #5 deq <= 1'b1; #5 deq <= 1'b0;
|
12. | For each of the following tasks, decide whether a branch in a revision system should be created to accomplish the task for the files in question.
|
13. | Consider the plots of bug rate, coverage, and simulation cycles in Figure 6.23.
|
14. | A computing resource for a project is usually tiered in terms of response time and computing capacity, such as performance, memory, and disk space. Three tiers are possible: computer farm, project server, and engineer’s workstation. A computer farm is shared with other projects and jobs are queued, and it usually has the largest capacity among the three. Large jobs that do not require fast turnaround times are sent to a computer farm. Project servers are used for running large jobs from the project that need a response faster than that given by a computer farm. An engineer’s workstation is reserved for the quickest response and small computing jobs. For each of following tasks, decide to which computing resource to send the task.
|


