79. ROI Optimizer™: Increase the Effectiveness of How Marketing Is Measured
The MarketSmarter ROI Optimizer is a methodology for connecting, visually and mathematically, all the components of the demand chain to give managers and executives the ability to dramatically improve the efficiency, effectiveness, and predictability of their entire demand chain. An organization’s demand chain is comprised of the sales, marketing, and service organizations, and the activities and programs that are implemented to consumers, to a sales force, and through various channels such as distributors, wholesalers, and strategic alliance partners.
The ROI Optimizer provides a framework for planning, managing, and measuring every entity and activity within the demand chain. It is made up of five primary elements that, when linked, provide a holistic picture to gain insight about what is working and what is not working. These elements are: (1) the revenue and quantity goals for the number of products sold, sales goals for sales and distribution channels, target customer segments, and sales and marketing programs that will be implemented; (2) the products or services that you sell; (3) the sales channels that sell them (sales force and the distributors, resellers, and other channels you sell your products through); (4) the goals for target customer segments; and (5) the marketing and sales programs you will implement to reach all audiences.
An important benefit of the ROI Optimizer is that it provides a clear picture of how sales, marketing, and service organizations must work together to achieve the best results. Departments have clear objectives about what is needed to stimulate demand and support for every other section of the demand chain.
Additionally, the ROI Optimizer creates a continuous improvement cycle so people can learn from every program that is implemented and improve over time. Optimization occurs when the existing situation is analyzed for its contribution to the overall goals of an organization. If you set this up in a spreadsheet, multiple scenarios can be quickly created to evaluate different versions of what is most effective regarding the mix of products, channels, customers, and marketing and sales programs.
The first time you use the ROI Optimizer, it will take some getting used to because it’s a different way of thinking about linking marketing and sales activities to the company’s overall goals. But do you want to base your decisions upon linking the demand chain, or on the accuracy of your intuition? Measuring marketing and sales ROI also takes discipline, but you will see improved ROI and continuous improvement. As you learn more each time you use the ROI Optimizer, it will become easier over time to predict results.
The ROI Optimizer is a solution to the problem that plagues most organizations—particularly marketers. As you read in earlier chapters, the ability to measure marketing is the nemesis of every marketer. It’s a real-time marketing tool that can significantly reduce the time to develop, justify, manage, and measure plans, and it can increase the ROI for any sales and marketing program. In short, it will help you market smarter and improve results.
ROI Optimizer™ Process
The following process will help you visually connect all the components of your demand chain to improve the efficiency, effectiveness, and predictability of marketing and sales programs. The ROI Optimizer will be created with information defined in five areas:
• Goals
• Products and services
• Sales channels
• End users
• Marketing and sales programs
Figure 79.1 depicts the basic flow of the ROI Optimizer, and the dependencies between each sections. Complete each step following the directions outlined in each section.

NOTE:
• Numbers have been rounded.
• Definitions for terms used in the ROI Optimizer are defined at the end of Step #5 “Define Marketing and Sales Programs.”
• The Marketing ROI Optimizer™ is flexible and can be customized to your business needs.
Step 1: Set Your Goals
Define overall sales goals, which should include at least the basics: quantity and revenue. Keep in mind that the more specific your goals are, the more they can be measured and improved over time.
Goals can include the number of products you want to sell, the size or revenue goals for target customer segments (which defines the opportunity for possible sales), and specific sales goals for each of the sales and distribution channels (see Figure 79.2).
• Define revenue and quantity goals for products/services, sales channels (direct and indirect), and end user market segments.
• Make your goals quantifiable. For example:
• Reach $5.2 million in revenue by the end of your fiscal year.
• Obtain 230 new customers, including service plans for 175.
• Sell 45% of yearly revenue goals through indirect channels ($2.3M).
• Recruit 50 resellers by March 1st.

Step 2: Products and Services
• List all of your products and services.
• Map your products to the previously identified goals.
• Make sure your cumulative product goals equal your overall goals.
• For example:
• Achieve $1.0M in revenue from the Basic Package and 31% of Enhanced Package revenues ($1.9M) through the direct company sales channel.
• Attain 36% of indirect channel revenues from the Enhanced Package totaling $840K (represents 45% of overall revenue goal).
• Shift 100% of service fulfillment to channel partners, resulting in 64% of indirect channel revenues ($1.5M).
• Obtain 175 new Enhanced Package customers, all with a service plan.
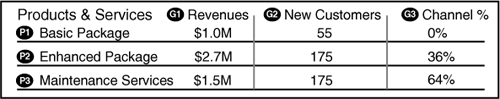
Figure 79.3 Define products and services
Step 3: Define Sales Channels
• Identify and list all the sales organizations and channels, both direct and indirect, that the products are sold through, including an inside sales team, major account sales, distributors, resellers, strategic partners, and other channels.
• Depending on the complexity of your sales channels and how specifically you would like to measure your results, you should define each specific sales channel. (Note: Reports can group sales channels like online catalogs, marketing affiliates, and manufacturers’ representatives so they roll up to one number for a category like “online sales channels,” but each channel needs to be measured individually first.)
• Map your sales channels to the previously identified goals.
• Make sure your cumulative sales channel goals equal your overall goals.
• For example:
• Attain $2.9M (55%) of revenues through direct sales.
• Attain $2.3M (45%) of revenues through indirect channels.
• Gain 39 new customers through Partner A, 32 new customers through Partner B.

Figure 79.4 Define sales channels
Step 4: Define Target Customer Segments
• Identify and list each discrete customer segment you will be targeting. Target segments may be defined by demographic, vertical industry, company size, number of employees, geography, type of asset, job title, and other criteria.
• Map your target customers to the previously identified goals.
• Make sure your cumulative target market goals equal your overall goals.
• For example:
• Attain 46 percent of revenue from existing customers in the primary market segment (Segment A).
• Utilize channel partners to get 46 percent of revenues from Segment A, 31 percent from Segment B, and 23 percent from Segment C.
• Achieve 23 percent of revenue from small and medium businesses in the technology sector (Segment C) (see Figure 79.5).

Figure 79.5 Define target customer segments
Step 5: Define Marketing and Sales Programs
• Define what percentage of your goals (for example, revenue or wins) will be derived from marketing and sales programs versus other sources (that is, upgrades from existing customers, existing channel sales contacts, and so on).
• For example:
• Drive 20 percent of revenues, or $1.0 million, from marketing and sales programs.
• Achieve 160 wins from these programs.
• List the tactical marketing and sales programs you plan to implement to achieve your program-driven (as opposed to overall) goals.
• For each program, include the estimated cost, projected number of impressions, leads, qualified leads, wins, revenue goals, and resulting ROI (see “Definitions” for how to calculate ROI).
• Map each program to a specific product/service, sales channel, and target market segment.
• Note: Each program should map to a single product/service, channel, and target customer segment. If programs overlap multiple areas, repeat the program listing as needed.
• Define the goals you would like to achieve for each marketing and sales program. Note that each program needs to have its own goal, and that these will roll up to provide you with a campaign-level view.
Defining each program in this manner provides insight into the total costs associated with each marketing activity, how each program is designed to achieve the best result, and how each program is quantitatively based upon impressions, response rate, and conversion rates (see Figure 79.6). For example:
• Conduct a $15,000 telemarketing campaign to convert 150 leads into 35 qualified leads, resulting in 15 wins to drive an estimated $97,500 in revenues.
• Conduct a joint seminar with Channel A to target Segment A with B Package offer, resulting in $39,000 in estimated revenues for an ROI of 3.9:1.

Figure 79.6 Define marketing and sales programs
Definitions
Impressions: The total number of people who are exposed to your marketing program. (Impressions could be Web page views, for example—not necessary who is “targeted.”)
Leads: The number of people who respond to the program.
Q Leads: Qualified leads fit the specific description a company uses to define a qualified lead (for example, interest and ability to purchase).
Wins: The number of closed sales/contracts.
ROI (n:1): Return on Investment calculated by dividing the estimated revenue by cost. (For example, 10:1 ROI means the return was 10 times the investment.)
Top-Down and Bottom-Up Analysis
By taking a cumulative view of all programs, you can ensure that your programs are sufficient enough to meet your previously stated program-driven goals for revenues for each product/service, channel, and target market. Perform an analysis on your anticipated results by reviewing the cumulative results broken down by product/service, channel, and end-user markets.
For example: The overall revenue goal of $5.2 million and $1.0 million is from the Basic Package. If you anticipate 20 percent of that revenue to come from marketing and sales programs, your tactics for the Basic Package need to account for $200,000 in revenues. However, the programs only provide estimated revenues of $71,500, which prompts the questions:
• Is your Basic Package revenue goal realistic?
• Can you achieve more than 80 percent of your revenue goal for the Basic Package from non-marketing related activities?
• What other marketing and sales activities can be added to make up the shortfall?
• Do you have enough of a budget to support the additional programs that would be required to meet the revenue goal?
This analysis should be repeated for every product/service, sales channel, and target market. The ROI Optimizer tool provides an immediate insight into whether your programs are sufficient to meet your goals.
In addition, while performing the analysis of the bottom-up estimates versus the top-down goals, you need to continuously check your assumptions to make sure they make sense (see Figure 79.7). For instance:
• Does Partner A have the expertise and contacts to drive 150 leads at a joint seminar?
• Is online advertising the best method for driving revenues from the Enhanced Package?

Figure 79.7 Top-down and bottom-up analysis
Demand Chain Optimization
Once you have created your ROI Optimizer, it can be evaluated and optimized. Because elements in the map are linked and quantified, everything can be measured. This means that every time you execute a program, it can be improved the next time. Most businesses don’t measure marketing, and if you don’t, the goal is to start now. You can only get better if you begin to track and measure now. The ROI Optimizer can simplify and automate the process, and help track real results to analyze programs and adjust assumptions for future planning.
Schedule quarterly reviews to share results and assess the next steps in improving performance. Demand generation is dynamic, not static, so don’t plan once and wait to change strategies and tactics until next year. Update the ROI Optimizer quarterly, and monthly if you execute many programs and have the ability to measure often. As you apply the ROI Optimizer process, you create a culture of accountability, high performance, and continuous improvement.