
6. Illuminating the Pathway: How to Measure Innovation
To Measure or Not to Measure?
“I agree that innovation is a tricky thing to bring about. Companies want it but focus on the wrong things.”
—Art Fry, developer of Post-Its1
From the amount of time and number of pages that have been devoted to the topic of performance measurement in the last decade, you might imagine that we know all we need to know. Frankly, many companies do not have this issue adequately covered.
Measurement is both fundamental and critical to success with innovation. However, you would not know it by the amount of thoughtful text or time given to discussing innovation metrics.
It is not enough to simply pick several areas, use whatever you happen to measure, and expect that to give you the information you need to manage innovation. With so many metrics in existence, some managers skirt the problem by measuring most of everything they can think of and hoping that some of them provide useful information. They employ dozens of measures with different criteria.2 In addition to being excessively time consuming and a drain on productivity, using too many metrics can lead to incoherent analysis and improper action. A fundamental rule of innovation is that linking strategy to innovation measurement with a few sharp metrics provides a clear picture of performance.
Creating a few sharp metrics is not to be confused with fitting them all on one page. We visited one company that literally had one page of innovation metrics. We estimate that approximately 60 metrics were crammed onto the page. The font was so small that it was barely readable, and the four margins were the smallest possible. This one-page measurement system is useless and probably harmful.
What Gets Measured Gets Done
The adage “What gets measured gets done” is frequently used to argue for the need for measurement systems. Although this is true, a carelessly designed innovation-measurement system may do more harm than good.3 In a recent survey, more than 60% of respondents indicated that innovation was a key feature in their companies’ mission statement, yet more than half rated their performance-measurement system for innovation as poor or less than adequate.4
Many large organizations throughout the world measure results using money-based metrics.5 However, most managers in those organizations feel that nonfinancial measures should be used to track the execution of an innovation effort and project its future value. Managers rely on nonfinancial measures much more than they do financial ones because these measures give a better real-time, granular evaluation of progress and likelihood of success.6
Mobil’s retail division provides a vivid example of the dramatic effects of a well-designed measurement system. When a new management team came on board, the $15 billion-per-year division was unprofitable and one of the laggards in the industry. The new management team defined a clear strategy that emphasized efficiency and focused on specific market segments that valued service and premium products. The management team translated the new strategy into a measurement system with metrics that included ROCE (return on capital employed), market share in the targeted segments, and the success of specific innovation measures such as new product acceptance rate and new product ROI. The measurement system was used in all levels of the organization. This gave all employees in the organization clear milestones to gauge their work and understand how they helped the organization succeed. The result was profound: a return to profitability and ascension to the number one company in the industry in a little more than a year.7
Measurement is one of the most critical elements of success in innovation. When measurement systems are not aligned with the strategy and not tailored to the portfolio’s mix of incremental, semi-radical, and radical innovation, managers lose a key source of information. That translates into lower performance and decreased payoffs from innovation investments.
The Three Roles of a Measurement System
Measurement systems are managerial facilitators; they are not solutions. They fill three roles, as follows:
• Plan—define and communicate strategy. Make assumptions about the sources of value explicit and clear, select the intended strategy, and clarify expectations about strategy throughout the organization
• Monitor. Track the execution of innovation efforts to assess changes in the environment, intervene only if necessary, and evaluate performance.
• Learn—identify new opportunities. Learn about new solutions to achieve performance goals, new business, or technology opportunities.
Plan: Define and Communicate Strategy
A measurement system that captures the logic behind an innovation strategy facilitates agreement in terms of what is important, how day-to-day activities add value, and how each person contributes to the mission. Making the strategy explicit through a measurement system has three advantages:
• Allows a discussion about the underlying assumptions and mental models, and provides agreement in the organization about the strategy.
• Encourages the communication of the strategy and its execution throughout the organization. Communication clarifies expectations and helps organizational members see why certain actions add value whereas others do not.
• Tracks the evolution of the organization and the strategy. Innovation efforts frequently span long periods of time; a measurement system identifies whether the organization is on the right track to achieving its innovation objectives and whether the innovation strategy is working.
An executive of a successful technology startup described the importance of planning: “I think that operating without a (strategic) plan and without a cash flow projection is like trying to walk with no eyes; it’s a challenge.”8
Monitor
The second use, and probably the most commonly thought-about function of measurement systems, is monitoring progress.9 For example, within product development processes, the reference point for measuring progress is typically the planned performance that describes product introduction date, development budget, technical and quality specifications, and customer satisfaction targets.
When used to monitor implementation, the measurement system can identify deviations from the plan that require managerial action. In this context, a measurement system is used by exception (thus liberating managers’ attention from constantly supervising the process) instead of to stimulate discussion or to make a business model explicit.
Learn: Identify New Opportunities
Innovation depends heavily on communication and exchange of ideas; people exchange points of view, discuss their different perspectives, and find new solutions they had not contemplated before.10 This is the third role of measurement systems: to facilitate the ongoing discussion within an organization that will lead to better innovation and execution. One of the tools USA Today, the leading newspaper in sales in the United States, relied on to continually innovate its product was a detailed weekly circulation and advertising report. These reports were carefully analyzed and discussed to understand the effectiveness of new ideas, pitch new ones, and uncover new trends. Pepsi used similar weekly market share reports, with share numbers in specific counties and even cities, in its effort to beat Coke.11 At Siemens’ medical products division, project schedules stimulate innovation because the pressure to meet milestones and deadlines galvanizes discussion and creativity and creates a bias for action. Figure 6.1 summarizes these three roles.

Figure 6.1. The three roles of measurement systems
A Balanced Scorecard for Measuring Innovation
Designing a measurement system for innovation relies on a clear model of how innovation is managed and how ideas are created, evaluated and selected, and transformed into value. A clear model describes the inputs, processes, outcomes, and outputs from idea generation to execution and value capture. This model of innovation management can transform into a measurement system to manage innovation. Figure 6.2 illustrates these stages.

Figure 6.2. Business model and measurement system
The Business Model for Innovation
The Balanced Scorecard is one of the most powerful concepts in measurement systems. Although the original Balanced Scorecard focused on business strategy, its main idea is applicable to any business process, including innovation management.12
A basic tenet of the Balanced Scorecard is that the measurement system is only as good as the underlying business model. The business model describes how the company will be innovative and how it will generate value from innovation.
This is the key to the power of Balanced Scorecards: The richer our understanding of the innovation processes is, the better our business model will be. The derived measurement system will then provide a more informed management of innovation. By making the business case for innovation investments, managers can integrate innovation impacts into their business strategies. This integrated perspective is directly linked to the third Innovation Rule: Integrate innovation into the company’s basic business mentality.
Inputs, Processes, Outputs, and Outcomes
Putting together a business model of innovation is probably the most challenging part of designing a measurement system.13 It forces managers to make their assumptions explicit about how to get innovation and to agree on an innovation model.
The following framework (illustrated in Figure 6.3) presents a useful approach to describe the causal relationships behind an innovation model. It can be applied to describe innovation not only at the business unit level, but at any level within the organization.14
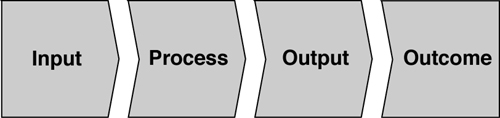
Figure 6.3. A business model of innovation
Inputs are the resources devoted to the innovation effort. Possible inputs include tangible elements such as people, money, equipment, office space, and time, but also intangibles such as motivation and company culture. Inputs are leading measures of success. Sears Roebuck and Co.’s turnaround relied to a large extent on carefully measuring the quantity and quality of the workforce as a key input to success. A significant part of Sears’ measurement system was devoted to monitoring the investment on recruiting the right talent and training it, as well as to monitoring the workforce commitment to change and the generation of ideas.15
The different types of inputs that might be considered in examining this part of the business model include the following:
• Tangible resources include capital, time, software, and physical infrastructure.
• Intangible resources include talent, motivation, culture, knowledge, and brands.
• Innovation structure includes interest groups and corporate venture capital.
• Innovation strategy includes innovation platforms and positioning in the Innovation Matrix.
• External network includes partners, lead customers, and key suppliers.
• Innovation systems include systems for recruiting, training, continuous learning, execution, and value creation.
Processes combine the inputs and transform them. They are “real-time” measures (meaning that they measure current activities) and track the progress toward creating outputs. Process measures are critical during execution because they can signal the need to change course or alter the execution.
• The creative process tracks the quality of ideas, the ability to explore them, and the conversion rate into projects and value.
• Project execution tracks the evolution of projects currently underway in dimensions such as time, cost, technology performance, and estimated value generated.
• Integrated execution tracks the aggregate performance of all projects.
• A balanced innovation portfolio tracks the mix of projects within the Innovation Matrix and its alignment with the strategy.
Outputs are the results of innovation effort. Output measures describe what the innovation efforts have delivered. These measures are lagging measures because they inform after the fact, once the effort is done. Output measures describe key characteristics such as whether the company has superior R&D performance, more effective customer acquisition, or better customer loyalty.
• Technology leadership is evaluated through number of patents, cites, seminars, technology licenses, and technology adoption in the business model.
• Project completion is evaluated through execution metrics vis-à-vis expectations or competitors.
• New product introduction is evaluated through the number of successful products, and their acceptance is compared to competitors, market share, and sales.
• Business processes improvement is evaluated through improvement in process metrics.
• Market leadership includes customer acquisition, customer share, and customer loyalty.
Outputs describe quality, quantity, and timeliness, whereas outcomes describe value creation. Outcome measures capture how the innovation effort translated the outputs into value for the company and the net amount of the value contribution. If the output of a particular innovation project is successful in the market and profitable for the company, the outcome is strongly positive. However, a similar project could produce the same quality and quantity of innovation outputs, but not lead to value creation. It may have missed the market window of opportunity, or the innovation characteristics delivered may not have been as powerful in attracting consumers as had been anticipated. In this case, the outcome would be negative, at least in the sense of commercial viability; valuable learning outcomes from the project still may have made it worthwhile, despite the cost.
Accurately measuring value is controversial. Changes in valuation of share prices should reflect the creation of value under the assumption of efficient markets. But this measure is limited to public companies and to the ups and downs of the stock market. For private companies, divisions, departments, and even specific products, a new breed of measures was developed. Broadly called residual income, these measures relate profitability and cash flows to investment in dollar terms (rather than as a ratio estimated by traditional measures such as ROI). Coca-Cola, AT&T, FMC, PepsiCo, and Boeing are among the numerous companies that have adopted these new measures of value creation.
Residual income = profits – capital employed × cost of capital
• Project profitability estimates the value generated during its lifecycle, compared to expectations and comparable projects.
• Customers and products profitability estimates the overall value of innovation from a market and product perspective.
• Return on investment estimates the current profitability of the organization.
• Long-term value captured estimates the value captured through the life of the product or product family.
From the Business Model to the Measurement System
The business model of innovation varies for different types of innovation and business processes. For example, developing a measurement system for incremental innovation16 within the manufacturing processes requires a business model that explicitly describes the following:
• What resources are required from employees, external consultants, or contact with other organizations facing similar challenges
• How these resources are combined to create innovation, such as through workgroups and development of analyses and action plans
• How the specific innovation translates into business value via increased quality, decreased cycle time, or decreased inventories
Figure 6.4 illustrates the innovation model at the business unit level. Inputs track the management infrastructure—strategy, structure and systems, employee commitment, and new talent. Measures include a questionnaire for employees and partners to track their understanding of the strategic direction, an audit of structure and systems, the number of ideas that are funded, and the background and diversity of the new recruits. Process objectives track the innovation portfolio, an aggregate view of effective project execution, the health of the innovation pipeline, and an evaluation of partners’ added value. Outcomes track product and process performance (against competitors’ products), whether existing customers commit more of their needs to the company, market share through new customers, and the quality of the technology developed. Finally, outputs track sales and profit growth as short-term measures of financial performance and share price relative to the industry as the ability to generate value for the company.

Figure 6.4. Example of a business model for innovation underlying the measurement system
Following development of the innovation business model, the next step is identifying the measures that will describe this business model. Measures are organized into perspectives (usually between four and seven), such as inputs, processes, outputs, and outcomes. The rule of thumb is to have, at most, five to seven measures per perspective; that way, you avoid becoming overwhelmed because too many measures are reported. The total should not exceed 15 to 20 measures. Each organizational level has its own set of measures that cascade down from the model and measures defined at the business unit level. Distilling measures at each level is important to provide the adequate tools throughout the organization. Good measures at the top of the organization are a small part of a good measurement system.
In some cases, objective measures are readily apparent, but in other cases, they are less obvious. When objective measures are not obvious, subjective assessments are better than no measures at all. Siebel Systems, the company that developed the Customer Relationship Management (CRM) market and grew to $1 billion annual sales faster than either Microsoft or Oracle, relied on subjective measures to understand and manage the important intangibles of its standard services and innovations. Every quarter, the company administered an employee survey to measure various dimensions of employee satisfaction. Siebel Systems also complemented its daily interactions with customers (carefully recorded in its CRM system) with customer satisfaction surveys administered by a third party. These provided important understandings of how well things were working from the perspective of the customers and the employees.
Figure 6.5 reflects the set of measures associated with the business model illustrated in Figure 6.4.

Figure 6.5. Measures for the business model presented in Figure 6.4
Designing and Implementing Innovation Measurement Systems
The measures for gauging innovation vary depending on how far you drill down in the organization: The measurements at the project level are very different from the measures at the strategic level.
Figure 6.6 reflects the idea that measurement systems cascade from the business unit level down to each innovation effort and extends throughout the value chain (internal as well as external). The x-axis captures the business model and value chain perspectives, and the y-axis captures the organizational dimension. Measurement systems are nested from particular projects up to the business level. At each stage, measures are aggregated and new ones are added.

Figure 6.6. Framework for innovation measurement
At the venture capital division of a large technology firm, ideation is measured via the quality and quantity of the deal flow. The quality of the portfolio selection is measured by comparing the fit between the companies in which the division has invested and the markets identified by the corporation as strategic for its future. The execution measures include the number of transitions for portfolio firms through new funding rounds, sales growth, and the quality of the intellectual capital developed. Sustainable value creation at the division level includes measuring the ROI, the number of acquisitions of firms in the portfolio, and the new business brought to existing divisions.
The measurement system for an individual firm in the portfolio of the division is very different from the divisional measurement system. Project resource measures include the actual dollar investment in the startup firm, the number and types of contacts among the startup management team, and people at various divisions in the corporation who can assist with the startup. Project execution measures track the startup firm’s development compared to its business plan, changes to its strategy, and financial indicators. Project outcomes and outputs are evaluated at the exit event and include ROI and intellectual capital, as well as new business generated for the corporation.
The following sections describe in more detail the development of measurement systems at the strategic organizational level.
Measures for Ideation
The flow of ideas with which to fuel innovation depends on the ability to leverage the human capital of the organization. The measurement system for innovation needs to track the various pieces of the human capital equation:
• Culture
• Exposure to innovation stimuli
• Understanding of innovation strategy
• Management infrastructure for ideation
A significant amount of qualitative information is generated through the regular human resource mechanisms, including performance evaluations, exit interviews, and external audits that can be used to diagnose the state of the innovation culture. In addition, employee surveys can enrich the understanding of innovation culture. In combination, these can give a quite accurate picture of the state of the innovation culture and climate in the organization.17
Objective measures like employee turnover, applicants per position, or employee involvement in innovation initiatives also exist. But even objective measures need to be carefully applied. Red Herring, a leading magazine in the technology industry space, went through three editors-in-chief before it found the right person for the culture of the company and the requirements of the job. It expected the need to experiment to find the right match. In this case, turnover was a good thing rather than a negative.
The second aspect of a healthy idea flow is the exposure that the organization has to innovation stimuli. Similar to the sales process, in which lead quality and volume depend on the depth and breath of the marketing process, the quality and quantity of ideas depend on the exposure of the organization to internal and external innovation forces.18 The effectiveness of internal innovation efforts—quality circles, brainstorming groups, training sessions—can be measured to give the organization a sense of whether it is devoting sufficient resources to these efforts and whether they are successful. A company can quantify the number of efforts and their effectiveness by using satisfaction and effectiveness surveys. British Petroleum (BP) encouraged and tracked internal efforts, including these:
• Peer assists, in which managers from other divisions assisted a particular division to solve a unique problem
• Peer groups, in which managers from different divisions met periodically to support each other and transfer knowledge
• Federal groups, made up of formal projects to solve a problem that cuts across various divisions
Measurement of external stimuli—from suppliers, customers, partners, infrastructure providers, and experts—is also a key to success. Each particular external interaction has an execution model governing the inputs required to maximize the potential value of the collaboration, the processes in place to execute the strategy, and the outputs such as the quantity and quality of ideas generated. For collaboration projects with universities, IBM tracks the quality of the people involved, the meetings that take place, the achievements throughout the project, the quality of the ideas generated, and the follow-up work undertaken.
The third leg of a healthy idea-generation process is a clear strategy backed up with access to competitive knowledge that is used to direct and catalyze innovation. One of the purposes of strategy is to clarify what efforts are within the bounds of the company’s playing field and, therefore, should be pursued. By clarifying these boundaries, the company focuses creativity and energizes action.19 Assessments of the types of ideas and projects combined with employee surveys can provide a good indication of whether the organization understands the strategic framework for innovation and uses it to generate ideas. Chrysler conducted assessments of the range of innovation efforts across its platforms and measured employee attitudes and their understanding of the strategic framework to gain a better understanding of its innovation efforts.
The last lever of a healthy environment for ideation—the infrastructure element of the measurement system—should track whether adequate resources and processes are in place, including these:
• Talent, which measures the level and effectiveness of recruiting, training, and resource allocation.
• Money, which measures funding available for ideation from the budgeting process and from discretionary pools within the company.
• Knowledge, which measures the development and use of effective knowledge-management platforms to support internal and external groups.
• Management systems that track the quality of information, planning (such as strategic planning mechanisms), resource allocation, and incentive systems that reward ideas. These systems enable the “friction” that leads to creativity.
• Communication, which tracks the level and effectiveness of planning and constructive conversations regarding the need and direction of innovation.
Siebel Systems developed internal knowledge-management software, later commercialized as Employee Relationship Management Systems, to put relevant information at the fingertips of each employee, enable access to the people throughout the company’s network, and provide targeted training. This software allowed the company to track how it was using its network of people and training processes.
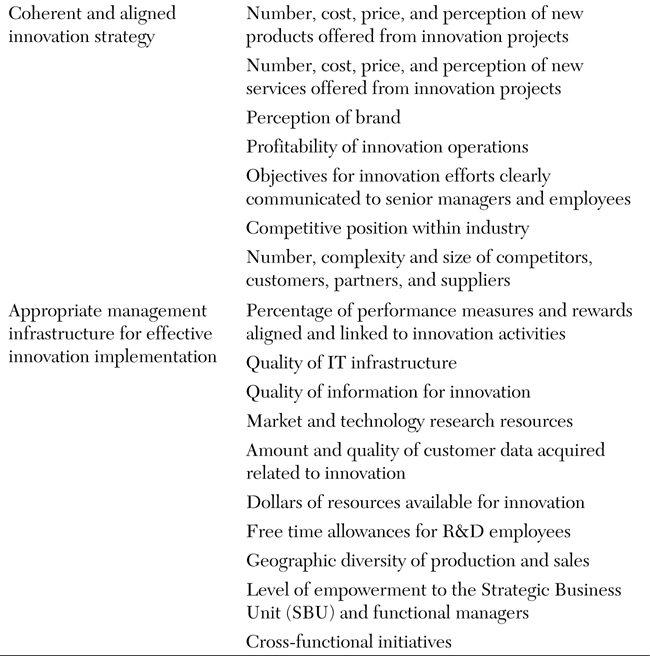
Table 6.1 describes other measures that are used to measure innovation input.
Table 6.1. Measures for Ideation

Measuring Your Innovation Portfolio
The purpose of portfolio-measurement systems is to evaluate the balance of the various innovation efforts across several dimensions.20 The typical portfolio tool is a graphic in which two of the dimensions are plotted on the x- and y-axes. An additional two dimensions can be captured in the size of the bubble identifying each project and the color of the bubble. Figure 6.7 provides an example from an energy organization. The portfolio matrix for this organization positions each innovation in terms of risk, time frame, funding, and business line. In this example, the company has chosen to de-emphasize low-risk projects and focus its efforts on medium- and high-risk projects. This is a reflection of the innovation strategy that stresses taking appropriate risks in order to make significant advances.

Figure 6.7. An innovation portfolio perspective
Key measures commonly used in portfolios include the following:
• Time to value. Because of the forward-looking nature of innovation, portfolio analysis includes the dimension of time. This dimension refers to the time until the project achieves a significant milestone, usually related to market release or positive cash flow. From a portfolio perspective, this dimension provides visibility into the development pipeline. Break-even time, a measure widely used in technology firms, is the time since inception of the project until it pays back the investment.
• Risk. Risk may be associated with risks of the technology, business model, or execution of the project. Risks are typically measured through a subjective assessment based on previous experience and personal knowledge. For high-risk strategies, the risk dimension often receives additional attention through scenario analysis, more elaborate probability distributions, options assessment, and contingency plans. Portfolios provide optics to see and manage the risks inherent in the innovation strategy and execution.
• Value. Another dimension of the portfolio analysis is the economics of each project. This dimension can be limited to measuring the budget for a project, or it can be disaggregated to include other measures of value. In particular, value can be measured through expected profits, expected value added (profits minus the cost of the capital involved in developing and running the innovation), or likely measures as ROI or return on assets. More sophisticated measures may include option-valuation methods that take into account not only the expected benefits from the current effort, but also future benefits associated with the capabilities developed. This latter approach is especially relevant when evaluating platform products in which the benefits come from the platform as well as future derivatives.
• Type of innovation. Another dimension is the balance among the incremental, semiradical, and radical projects. This perspective is valuable in keeping the investments aligned with the innovation strategy.
• Implementation stage. To assess the projects in the pipeline, a useful dimension is to examine the stage of development of each project. Typical stages include pure research, development, demonstration, and commercialization. A good pipeline of projects has projects distributed through the different stages, typically with more projects in R&D stages than in commercialization.
Finally, some measures are related to the dynamic dimension of portfolios. These measures address how fast the organization adapts its portfolio to changes in its execution plans or strategy.
Portfolio measures and diagrams are sophisticated analytical tools. However, they are only tools, and the decision is always in the hands of managers. A common fallacy is that a “perfect measurement system exists and can be designed,” which means delegating decision making to these analysis tools. This is potentially destructive. Every measurement system has limitations, and nothing can replace good judgment.
In addition to portfolio maps, innovation roadmaps are another way of looking at an innovation portfolio. In contrast to portfolio maps, innovation roadmaps depict current and future innovation projects and link the projects to demonstrate the inter-relationships and dependencies. The development of new transmission technologies to solve the U.S. power outage problems is dependent on the development path of distribution technologies, demand response technologies, new business models by utilities, and federal policy development. Mapping these relationships provides a crucial strategic context. The roadmaps also make it clear that certain innovation efforts may not be financially attractive on their own, but could develop value that can be leveraged into the future. A leading medical device company with sales grossing more than $4 billion uses innovation roadmaps that describe the general evolution of certain internal and external technology developments to manage investments in services or products that may be attractive only at a future date when the market has evolved. Projects are planned, evaluated, and improved against this backdrop.
Measuring Execution and Outcomes of Innovation
In a business unit or company, typically many different innovation efforts are going on at the same time. Some ideas are still in the exploration phase, some are incremental innovation projects, some are semiradical innovation projects that explore technologies and business models outside the current strategy, and some are radical projects that explore potentially disruptive innovations.
A good system for measuring the aggregate performance of all these types of innovation efforts has four characteristics:
• Visibility over the evolution of the various projects being executed
• Information about the relevant aspects of each particular project
• Capacity utilization
• Product platform leverage
The first characteristic of the execution measurement system is the ability to provide visibility into all these innovation efforts. This capability is intimately related to the information technology infrastructure that underlies the measurement system.21 Managers must have the option to drill down into the measurement system to understand the evolution of each innovation effort. Good managers use this capability to stay on top of the developments in their company and to be able to ask the right questions and take action when needed, but they avoid the precision of micromanaging the organization.
The second characteristic of the execution-measurement system is to give an informative picture of the innovation status of the organization. To achieve this, the measurement system has to aggregate the project level information into a higher-level overview. For example, on-time performance is aggregated to provide an overall diagnostic of the company’s performance in managing its projects on time. Current information technology has the flexibility to aggregate information in various ways and look at performance using different perspectives.
Matching a project’s needs to the different types of resources over time leads to more efficient project execution. This is the third characteristic of the execution-measurement system. A well-designed system must clearly describe the various types of resources needed, the resource capacity available, and the allocation of resources to projects. This capacity utilization identifies potential resources that will be constrained (or oversupplied) and permits planning—especially important for resources that take longer to develop.
A leading company in external power supplies developed a measurement system following these design rules to track its product-development projects. As a result, senior management had periodic, informative reports on how the company as a whole was performing in terms of schedule, budget, engineer productivity, and project changes. For finished projects, it also aggregated time-to-develop, budget, and market acceptance. This information was tracked over time to visualize the trend of R&D efficiency and effectiveness.
Product platform measures are the fourth execution measure.22 These measures evaluate the effectiveness and efficiency of a product. Product platform effectiveness is defined as follows:
Derivative development cost (or time) ÷ Platform development cost (or time)
Well-designed product platforms allow derivative products to be developed quickly and with low investment. Therefore, the lower the ratio, the higher the leverage the development organization is getting out of the initial product platform. As the ratio starts to increase, the organization should explore whether to move to a new platform.
Measuring Sustainable Value Creation
The desired result of innovation efforts is value creation.23 Within for-profit firms, value creation is measured through financial performance. Typically, financial measures link value creation to the innovation. For nonprofit firms, including government research and development organizations, value creation depends on the particular mission of the organization. The California Energy Commission (CEC) uses its specific program mission and goals as the basis for determining the value creation of its transmission and distribution research projects.
For incremental innovation projects, financial performance is relatively easy to measure.24 Because the value that these projects generate is easily and rapidly captured, the value generated is the associated increase in revenues minus the associated change in costs, minus the cost of the resources invested. This value can be measured as ROI or residual income (RI, also known as value-based management)25; the latter has the advantage of being an absolute measure, compared to ROI, which is a ratio measure.
Return on Investment
(Sales – Costs) ÷ Investment
Residual Income
(Sales – Costs) – Cost of Capital × Investment
Limitations of ROI absent in the RI measure include the following:
• Ignores the absolute magnitude of the investment. But two projects returning 10% (same as ROI) are very different if the investment in one of them is $100 and the other is $1 million.
• May lead to underinvestment. A division with an ROI of 25% may reject a project with a 20% ROI because it would lower its ROI, even if the cost of capital (the adequate reference point) is 10%.
• May lead to overinvestment. A division with an ROI of 5% may reject a project with a 7% ROI because it would increase its ROI, even if the cost of capital (the adequate reference point) is 10%.
Figure 6.8 presents an illustrative cash flow of a project over time. This information is critical to have at both the individual project and the aggregate level. It depicts the financial risk of the project (and, at the aggregate level, the potential need to borrow cash), the time to recover the investment (the break-even point), and the value generated (the cumulated cash flow at the end of the product’s life).
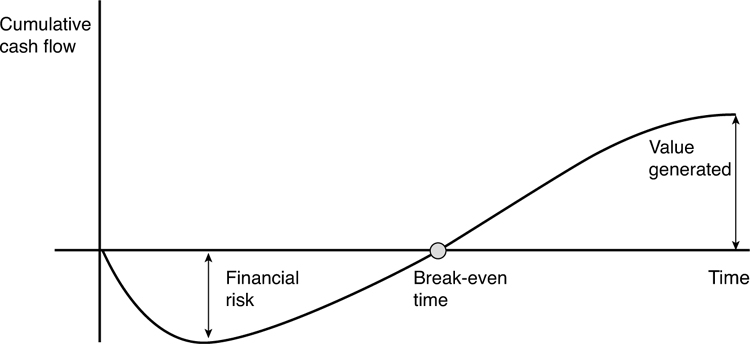
Figure 6.8. Project cash flow over time
For radical projects, measuring value creation becomes more challenging. First, the overall value generated may take years before it is captured. Think about the time it took Amazon.com to start capturing the value (to turn its original concept of selling business on the Internet into a cash-flow-positive business) that this initial concept had the potential to generate. FedEx, a radical business innovation when first started in 1971, received $90 million in venture capital (a quantity unheard of at the time) and did not turn cash flow positive for 26 months, after accumulating losses of $29 million.26
Second, it is difficult to disentangle how much of the value is directly attributable to the innovation effort and how much of it is due to the execution of the strategy. How much of Google’s value is linked to the original search code, and how much is associated with a skillful execution of the business model around the technology breakthrough?
Third, the project may develop capabilities that can be further extended through additional development efforts. The development of the minivan concept and the original Dodge Caravan not only saved Chrysler from a likely death, but also created one of the most successful product lines in the auto industry, which is constantly being improved. What were the financial returns as a result of the development of the first Caravan? Huge, but hard to quantify.
Finally, measuring value creation is difficult because the risk of failure is very high. Thus, value creation should be looked at not only at the project level, but also (and more importantly) at the portfolio level. Eli Lilly, one of the largest pharmaceutical companies in the world, bought a portfolio of medical device startups in the early 1990s. Some of them were unsuccessful, but a decade later, these companies were spun off as Guidant Corporation, with an initial market capitalization of $1 billion (which became $9 billion three years later).
Alternative value-creation measures—such as experts’ evaluation, development milestones, intellectual property creation, and patents—are more relevant especially in the early phases of radical innovation, where the uncertainties are the largest and the time horizon is very long.
Table 6.2 provides examples of the components of a measurement system. These are presented as examples of what could work in your company, not as what would be best for your company.27 Some may fit your situation well, and some do not. During this process, you may also think of some that are not presented here. Select and develop those that best fit your company.
Table 6.2. Examples of Measurements


The Barriers to Effective Performance Measurement
Seven basic barriers interfere with having a measurement system in place and functioning well:
1. If the basic business model is flawed, the organization will focus on the wrong levers of value creation and measure the wrong variables in developing the innovation. Microsoft has shown time and again its ability to observe, learn, and change its business model to adapt to market and technology changes.
2. Avoid measuring the wrong variables. One company that we worked with reported every financial number, down to the cent, but failed to measure crucial nonfinancial variables. For example, measuring time-to-market is important if the execution model is built on the assumption that first-mover advantages are key to the strategy and the value-creation proposition. However, for innovation projects following a low-cost product strategy, time-to-market must take a back seat to innovation centered on lowering costs more than reducing time.28
3. Objective measures are attractive, but in a lot of settings, they are of limited use. Subjective measures allow companies to capture intangibles and to adapt the information to the particular events of an innovation effort.29 Citibank periodically evaluated the motivation and commitment of its branch managers to the company strategy, without any reliable objective measures.
4. Failure to use the power of the available information technology is a costly mistake. The cost of measuring and communicating information has gone down significantly. Better information allows not only better management, but also data mining capabilities to uncover new opportunities. Information technology can be more powerful than is usually assumed. Boeing used information technology to design the 777 airplane faster, better, and cheaper than traditional design approaches could have delivered.
5. Another barrier to success is believing that IT is more powerful than it is. No measurement system can replace the analysis and judgment of management. Measurement systems guide the attention to the information reported, raise questions, and frame the thinking process. However, the measurement system never provides the answers; managers do that.
6. Using a management system the wrong way is a common mistake. Using a system to monitor instead of to learn is damaging. A well-known business story describes a company in the baby food industry that continually monitored sales. Management noticed that the sales office in Florida consistently met its sales target. After many years of this phenomenon, someone in management went down to Florida to see what was happening. He found that, in addition to babies eating the food, many seniors were also consuming it because it was easier to eat. Using the measurement system to monitor sales blocked the communication and learning that would have brought this innovation quickly to headquarters and benefited the whole company.
7. The final barrier is using the wrong data. Just as “garbage in, garbage out” plagues a company’s manufacturing operations, the same phenomenon also hurts innovation.
Senior management should look very carefully at its innovation-measurement systems and honestly assess which of these barriers are real or potential problems. It is management’s responsibility to ensure that the innovation-measurement systems are designed properly and are in good working order; the company’s future depends on it.
Measurement and the Innovation Rules
Managing and measuring go hand in hand. Thomas Edison managed his research team by measuring the number of innovations it developed every week. He set the innovation target at one small innovation per week and a big one every six months. This was a breakneck rate of innovation, and Edison’s team called itself “the insomnia squad.”30
While Edison’s measures seem overly aggressive and a little simplistic, he was on the right track; managers and teams need a small number of straightforward, effective measurements to guide and drive successful innovation.
You have several critical things to do when you design and implement innovation-measurement systems:
• Directly link the innovation measures to the innovation strategy and the innovation business model. The majority of global companies surveyed recognized that they were deficient in measuring the strategic value of their innovation.31
• Don’t be rigid; build in enough variability to allow valuable measurement. Different innovation processes and different organizational levels need different measurement systems, and these can vary over time. Projects need measures that are consistent with the business unit but different enough to capture project-specific innovation characteristics. The measures that are appropriate at the beginning of a project may not be adequate in the later stages.
• Know the specific purpose of each type of measurement system; trying to achieve too many objectives will get you nowhere. Dissect measurement systems to ensure that they are proving the right mix of planning, monitoring, and learning.
• Keep it simple; too many measures can be more of a distraction than a help. Having five simple measures linked to the strategy and the innovation business model is better than having 20 to 30 measures; even if the additional measures provide a more complete picture, they will overwhelm the decision makers. In this case, quantity is the enemy of quality.
• Stay in charge. Be aware of the limitations of measurement systems. They enhance but do not replace good management.
Measurement is one of the most significant factors in successful innovation. Ironically, in many organizations, it is one of the least attended to.