6. Rule #4: Reinforce a Results Culture
Creating a results culture means creating a culture that is evaluated based on producing measurable results. This means defining measurable milestones and rewarding people based on performance.
There are three rules-based practices for creating a results culture:
• Identify measurable milestones
• Implement recognition and rewards
• Initiate the Balanced Brand-Business Scorecard
McDonald’s was not a results culture. Brand image declined, same-store sales declined, profits declined, and share price declined. Yet there was little correlation between executive rewards and business performance. Even though McDonald’s business performance was deteriorating, top management continued to be rewarded. This made no sense; management rewards need to be placed in line with brand and business goals and shareholder interests.
People manage what management measures, recognizes, and rewards. We need to create a Balanced Brand-Business Scorecard that evaluates whether we are producing the right results the right way.
Rich Floersch, head of human resources and the team leader of the People P, redesigned the management evaluation system. Performance, against both business and marketing metrics, were increasingly correlated with salaries and bonuses.
There is high-quality growth and low-quality growth. Low-quality growth actually destroys value even while revenues increase. Managing for growth is not enough. We must manage for quality revenue growth. Creating brand value is the basis for quality revenue growth. Quality revenue growth is the basis for enduring profitable growth. Enduring profitable growth is how we create sustainable increases in shareholder value. The Balanced Brand-Business Scorecard measures how well we are doing.
To create brand value, marketers must evolve their thinking from product management to brand management, from supply-driven management to customer-driven management, from “how can we do it cheaper” to “how can we do it better.” The McDonald’s growth goal changed from being bigger, to being bigger by being better.
This discussion has been going on for decades: Which is more important for my brand, generating more customers or creating more brand loyalty?
Both are critical measures for any brand. Penetration refers to having more customers. Growing the customer base is important. Brand loyalty refers to having customers purchase more often, building brand preference and reducing price sensitivity.
The bottom-line objective needs to be the combination of more customers, more often, more brand loyal, and more profitable.
When I arrived in September 2002, the McDonald’s customer base per store was decreasing. If this trend were allowed to continue, the end game would have to be that the last customer would have to visit McDonald’s 50 million times per day just to maintain McDonald’s volume!
It is possible to have increased brand loyalty among a shrinking base of customers. But increasing loyalty among fewer customers is a risky business. Jaguar found this out as its customer base dwindled.
The ongoing brand challenge is to continuously attract customers and to create a positive experience so that they return and are more loyal. This means creating and reinforcing an enduring and profitable bond between a customer and a brand. We cannot build a successful brand focusing only on customer attraction. Attracting new customers who do not return is a fool’s errand. But, relying on repeat customers within a declining customer base is also risky.
When it comes to the bottom-line brand-business goals, our goals are to attract more customers with greater frequency and increased brand loyalty and with increased profitability.
The first step in building a results culture is to define measurable milestones. Managing for value begins with strategy and ends with business results. We must measure sales and profitability. We must measure and monitor changes in brand reputation. To be a market leader, you need sales volume. To be a profitable market leader, you need brand loyalty.
Of course, the first step is to be efficient. This means reducing costs by eliminating waste, increasing productivity of the available resources, and optimizing allocation of limited resources. This relates to financial discipline and operational excellence.
McDonald’s was not getting a satisfactory return on incremental invested capital. Matt Paull introduced a more disciplined approach that yielded significant improvements in ROIIC (Return on Incremental Invested Capital).
Improving productivity alone is not really a strategy for enduring prosperity. The only way to enduring profitable growth is by achieving a sustainable competitive advantage that increases sales and margins.
To be enduring, we must build both the sales and profitability of the brand, and we must also continuously strengthen the brand. The brand must be powerful. Brand power is built along three dimensions: familiar identity, relevant differentiation, and authority (quality, leadership, and trust).
A powerful brand is not the same as a big brand. And repeat purchase is not necessarily a sign of brand loyalty. It is a mistake to assume that repeat behavior is an indication of brand loyalty. Nonloyal repeat purchase is a threat to brand value. Educating a generation of customers to repeat only because of price and convenience does not build brand value; it destroys brand value.
Cable television is a good example of how having repeat customers does not necessarily mean having loyal customers. When cable television was the only alternative, people joined. But the service and responsiveness of the operators was terrible. People felt trapped. When the availability of small, easy-to-install satellite dishes became widespread, frustrated customers flocked to dish networks, abandoning cable TV.
Airline frequency programs based on mileage rewards do not necessarily build brand loyalty. They do reward frequent travelers. But there are those who may fly Northwest Airlines frequently to Detroit. This does not necessarily mean that these frequent travelers would rate Northwest as their favorite airline.
McDonald’s fell into the frequency-loyalty trap. Frequency is not necessarily the same as loyalty. The majority of McDonald’s most frequent customers were not loyal to the McDonald’s brand. McDonald’s most valuable customers did not have a favorable view of the McDonald’s brand.1 Brand loyalty is more than repeat purchase. Brand loyalty is repeat purchase based on a commitment to the brand. This means that your customers believe that your brand is the superior alternative for satisfying their particular need in a particular context. It means that your brand is their favorite—the brand they prefer, the brand they intend to buy again, the brand they are willing to recommend.
The result was that McDonald’s became increasingly vulnerable to competitive offers.
Building sales volume is important. For enduring profitable growth, we must not only build the quantity of sales, we must also build the quality of our sales, and we must align the culture around building both quantity and quality of sales. This means ridding the culture of a “sales is all that matters” mentality and instilling into the culture the concept of building sales based on brand loyalty.
At McDonald’s, we recognized that it is not enough to have customers frequent the brand. We wanted people to frequent the brand because they favored the brand. As the McDonald’s brand purpose stated, the goal is “to be our customers’ favorite place and way to eat.”2 McDonald’s led the market in penetration and frequency. But, frequent customers did not favor McDonald’s. They frequented McDonald’s because it was convenient and low-priced.
Brand loyalty is like a ladder: There are degrees of commitment to a brand, from minimal to real commitment—steps you take to go to higher levels of brand commitment. The process of revitalization requires that we understand and audit the entire pool of users to determine where the potential customers are and how these customers array themselves on the loyalty ladder.
In the universe of potential customers, there are those who are simply unfamiliar with the brand. Among those customers who are familiar, there are two main groups: those who are not using the brand and those who are, to some degree.
Among those who are not using the brand, there are customers who:
• Have not tried the brand
• Have tried the brand but have not rejected the brand
• Have tried and rejected the brand
In 2002, there was a growing number of people familiar with the McDonald’s brand. These people had experienced the brand in the past, had fond memories of the brand, but were not current users even though they were not rejecting the brand. This was a fertile area for brand revitalization. We needed to understand how to win these customers back to the brand.
In general, when analyzing a brand’s customers, among those who are using the brand to some degree, there are four types of brand commitment (see Figure 6.1):
• Commodity consideration—Brands in this group are in a customer’s consideration set. These brands are perceived to be basically the same. Consumers like the category, but they do not see relevant brand differences. Price and convenience are the differentiators.
• Short list—These brands are on the customer’s short list, usually the customer’s top three favorite brands.
• Preference—A preferred brand is the one that the customer prefers above the others, their favorite choice.
• Enthusiasm—Brands in this category are ones the customer prefers to buy even when their second choice brand costs less. These customers not only intend to repeat, they intend to recommend the brand to their friends.

Building brand favoritism means moving people up this loyalty ladder. The goal is to increase the number of customers who not only prefer your brand but also prefer the brand even though there is a price premium. These enthusiasts not only intend to continue to buy the brand, they would recommend it to a friend.
Balanced Brand-Business Scorecard
A Balanced Brand-Business Scorecard needs to be created. Metrics to evaluate performance on each action P were defined. Key measures such as store cleanliness, brand loyalty, and so on were standardized providing a globally consistent view of progress.
At McDonald’s, the milestones were published for everyone to see. Quarterly meetings with area executives throughout the year focused on reviewing performance against the milestones. The scorecards were displayed prominently in Charlie’s office. He had a wall-size board specifically made to display the brand’s progress. The Balanced Brand-Business Scorecard was designed to assure that while it is good to produce the right results, it is important to produce the right results the right way. The McDonald’s Brand Scorecard included measures relating to each of the five action Ps, customer perceptions of the brand, as well as mystery shopper scores.
“Every job in McDonald’s is dependent on those consumers coming into our store at the front counter. And that’s what causes everything else in McDonald’s. And without those people, we wouldn’t be here.”3
The fundamental goal of business is value creation, but Ray Kroc understood that to create value for investors, we must create value for customers. Ray knew that all cash flow begins with a customer exchanging money for your offer. The business has little value unless there is value to customers.
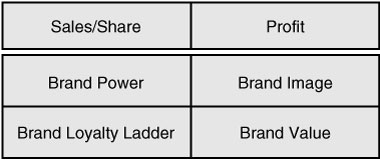
Brand power and brand loyalty are measurable. A brand’s image is measurable, and the brand’s value is measurable. A Balanced Brand-Business Scorecard takes into account these performance indicators as well as the brand’s sales, share, and profits.
Think of the scorecard as a dashboard; it has all the critical elements for driving your brand on the road of enduring profitable growth (see Figure 6.2).
Revitalizing a brand requires an organization that is committed to measuring the results of our progress toward achievement of our Plan to Win. All the activities and all the articulations of where we want to be and how we plan to get there are irrelevant if we do not institute a yardstick for assessing movement. It aligns the organization on increasing the value of the brand.
Regardless of how glorious the philosophy is and inspirational the words are, most managers will overlook something that is not measured and rewarded.
It is essential to put in place and implement a corporatewide measurement program; otherwise, it is just an academic exercise. McDonald’s aligned all business units around the same goals. Just as it had common financial measures, McDonald’s instituted common business measures across all aspects of the business—the tangibles and intangibles—as articulated in the Plan to Win.
McDonald’s created customer-based measures for each of the five action Ps: people, product, place, price, and promotion. And for each of these five action Ps, McDonald’s created three-year milestones.
Examples for the people P were measures for key service criteria, employee commitment, and employer reputation. The measures for product focused on those that would help define favorite food and beverage. For place, the measures included items such as cleanliness and other items relating to the image of the store. For the price P, value for money was an important measure. And for promotion advertising, effectiveness and brand trust were assessed.4
There were global measures and local measures. In addition, a quality improvement program was instituted to evaluate local store performance.5 This comprehensive restaurant review program was led by the persistence of Mike Roberts, McDonald’s US president at the time. Mystery shoppers evaluated each store regularly. The purpose of the Restaurant Operations Improvement Program (ROIP) was to help operators and managers identify shortcomings and help them improve performance by providing the necessary tools and training. The ROIP “involves evaluations related to 12 areas (or ‘systems’) that directly impact customer experience and, hence, business results.”6
Putting a system like this into place takes patience and courage. It is a lot easier to describe than to actually do. Gaining agreement on common performance measures is an accomplishment in any organization. It is a particular accomplishment in decentralized global organizations where geographies have different standard measures in place. There is resistance to changing measures. Time and again, McDonald’s was confronted with the complaint that a new common system will invalidate the years of normative data collected locally.
A Balanced Brand-Business Scorecard assesses progress against a vision of brand perfection. In other words, it is not just about reaching achievable objectives; we also need to evaluate whether we are making progress toward our ultimate goals. This means we must incorporate the brand vision into our measures. We compare where we are versus where we want to be in the future. Are we making progress toward the defined brand destination? How close, or far, are we from our stated goals?
For example, some companies measure customer satisfaction versus what they consider to be an achievable objective such as 80% customer satisfaction. But Toyota aims for zero defects and 100% customer satisfaction. These may not be achievable next year, but Toyota measures whether they are making progress toward goals such as these. Those who measure achievement compared to achievable objectives will lose to those who set higher goals, measuring progress toward a vision of perfection.
It is commonly recognized that the value of a brand is among a company’s most valuable assets. So, measuring progress in building brand equity can be a useful measure of our effectiveness as marketers.
Brand equity is the customer’s perception of the financial worth of the brand identity. It is the difference in the financial value of a branded good or service compared to an equivalent good or service without the brand identity. As Ray Kroc once said, “A hamburger patty is a piece of meat. But a McDonald’s hamburger is a piece of meat with character.”8
Brands do not always add value. Sometimes they subtract value. When Carlos Ghosn came to Nissan, he was quoted in the press on the perceived value of the Nissan brand. Based on recent research, he said, “Compared to an equivalent Toyota vehicle, Nissan vehicles in North America are worth about $1,000 less.”9 In other words, the Nissan brand subtracted $1,000 per vehicle perceived value.
It is not enough to measure marketing success through increases in market share. Market share can be bought through bribes, or through brand exploitation. For instance, in the automotive world, these are called incentives, zero percent down, or $2,500 off the MSRP. For McDonald’s, this meant excessive dependence on price promotion.
But brand value must be earned and re-earned. It is possible to have a brand whose sales go up, but its value goes down. Some companies wonder why sales are up but business is so bad. These companies wonder why with increasing revenues, margins are down.
The concept of brand power and its relationship to brand value is more than just nice marketing phraseology. There is real, genuine bottom-line impact. As brand power goes up, price sensitivity goes down, and sales and profitability increase.
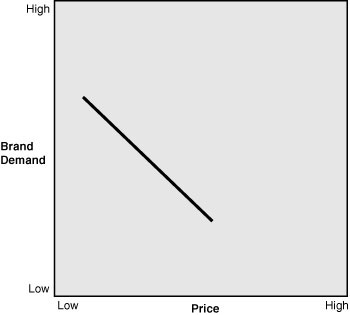
Price elasticity is a useful indicator of brand equity. We learned from basic economics that as price goes up, demand goes down. Economists call it demand instead of volume because actual volume depends on your distribution, promotional activities, and a variety of things. This price-demand equation is quantifiable.
Here is an example. Imagine that we plot brand demand against price for a particular brand. The chart would look like Figure 6.3.
Now, imagine that we have also calculated the same line for the major competitive alternative. From this analysis, we can determine the brand value differential (see Figure 6.4).

Brand B has greater customer perceived value than Brand A. Consumers are willing to pay a higher price for this brand. Or, at the same price, demand will be higher for this brand. In other words, the brand on the right has a significant brand value strategic advantage.
Brand value differential is defined as the price difference that would yield equal demand for the two brands. In other words, at what prices would the average consumer in the selected market segment consider the two brands to be equal in value. Brand A has a significant brand value disadvantage.
In one case, for a technical product priced on the average around $2,000, one brand had a brand value advantage of more than $300. In the case of Nissan, as just mentioned, Carlos Ghosn reported that Nissan had a brand value disadvantage in North America of around $1,000 relative to Toyota.10
We worked with a consumer durable product priced at around $1,000. The brand had a negative brand value differential of about $200. The result was that without heavy discounting versus major competitors, this brand would lose significant share.
A business-to business service client had a brand value differential advantage of $43 per transaction over its major competitors. This kind of advantage is a major contributor toward superior brand profitability.
Just because you have a brand value advantage does not mean you should charge the highest prices that you can. That is a strategic decision that depends on whether the plan is to maintain share, grow share, or exploit the brand.
Sometimes marketers are tempted to maximize short-term profitability of the next transaction, sacrificing long-term value creation. You cannot continue to raise prices to make up for lack of volume. It was related to me that Ray Kroc liked to emphasize the point that raising prices without justification is a sad way to run a business. He understood the concept of “fair value.”
A study by Boulding, Lee, and Staelin concluded that “brand-focused communications decrease price elasticity.”11 Overemphasis on price—whether in a promotional vehicle or in a promotional ad destroys rather than builds brand loyalty. These types of price communications hurt brand equity. If the emphasis of the marketing message is price, then brand loyalty is being exploited, not enhanced.12
A high-tech product marketer included the brand value differential measure as part of the reward system for brand management. The fair value analysis and the brand value differential can be used as measures of the brand management progress in creating customer-perceived value.
Creating a Balanced Brand-Business Scorecard not only allows for measurement of progress but also management of progress.
At McDonald’s, we used the Balanced Brand-Business Scorecard for assessing the health of the brand around the world and for evaluating the progress we were making toward our overall brand destination of becoming our customer’s favorite place and way to eat. We also used the scorecard as a resource to guide priorities for continuous improvement. Where are the successes? Where are the problems? What is working? Why? What is not working? Why? Where should we allocate resources?13
The goal of a Balanced Brand-Business Scorecard is ultimately to help create a learning organization—not just to learn what progress we are making, but also to learn how to improve.
The leadership of Eric Leinenger and Jerry Calabrese turned the Balanced Brand-Business Scorecard into a useful learning tool. A remarkably user-friendly database was created to enable a variety of customized analyses to learn how to improve. A valuable part of their contribution was creating simple analytics to highlight where the brand is performing well and on what attributes it is underperforming. Continuous improvement is the management priority.
Management of progress needs to include learning how to make progress. Learning from each other is the best way to continue to improve our performance. Global learning is based on three principles:
• Adopt an idea that seems to be working somewhere else.
• Adapt that idea to the local market environment.
• Continuously improve the idea.
A properly designed Balanced Brand-Business Scorecard provides important learning, from successes and from failures. Having a shared measurement system does not just aim to recognize and reward, it helps to spur ideas as well as prevent us from repeating failed ideas.
Creating a results culture sometimes leads to excessive reliance just on the reported measures. We should measure all that we can measure. But there is no substitute for good judgment. We must be able to weigh the results against the knowledge and judgment that we possess and make the decisions that need to be made. Waiting for the right research number only keeps you and the company waiting. Waiting for just the right answer sometimes causes us to interpret the results in a way that reinforces what we are hoping to find. Data does not make decisions. People do.
The Do’s and Don’ts of Creating a Results Culture
Do
• Focus the organization around brand value—To be the best value, you cannot compete on price alone. You cannot cost manage your way to enduring profitable growth. Galvanize the organization around the value equation.
• Build brand power—Powerful brands make money. The goal must be to become the identity that is most familiar, the highest quality, and most trustworthy source of a relevant, differentiated promised experience. Remember to focus on the four components of a powerful brand: identity, familiarity, specialness, and authority.
• Grow brand loyalty—Move your customers up the loyalty ladder. Take care of your most loyal customers.
• Understand your rejectors—Know why people have problems with you; know why they are turning away. These may be bigger issues than you realize. You may be able to win these people back along with others as well. We had one client who was stunned to learn that consumers had more than 500 problems within his product category even though his particular company continued to make product changes every year.
• Measure what you want managed—Measure more than just sales, share growth, and profit growth. Build both quantity of share and quality of share simultaneously.
• Align around the measures—Use the metrics not just to evaluate progress but to manage progress as well. Don’t punish low scores but learn from them. Reward performance.
• Conduct key research—Many different types of research can contribute data.
Don’t
• Don’t misinterpret results—Accept the results and move forward. This means analyze, interpret, and synthesize but do not manipulate.
• Don’t rely on the results/data to decide for you—Data does not decide. You are the “decider.” You are the decision-maker. Use the data to understand and prioritize the decisions that need to be made. Don’t get bogged down with the paralysis of analysis.
• Don’t use results to support preconceived opinions—Results and data are opinion neutral. Imposing your preconceived notions on the data may point people and resources in the wrong direction.
1 Light, Larry, speech to the Association of National Advertisers, October 2004.
2 McDonald’s 2005 Annual Report, p. 10.
3 Kroc, Ray, TV interview with Tom Snyder, Tomorrow, 1977.
4 McDonald’s Shareholders Brochure, October 2003.
5 McDonald’s Corporate Responsibility Report, 2004.
6 Ibid.
7 “McDonald’s Revitalization Plan,” brochure for shareholders, McDonald’s Corporation, October 29, 2003.
8 Kroc, Ray, with Anderson, Robert, Grinding It Out, St. Martin’s Paperback ed., p. 102.
9 Thorton, Emily, with bureau reports, “Remaking Nissan,” BusinessWeek International, November 15, 1999.
10 Ibid.
11 Boulding, W., Lee, E., Staelin, R., “The Long-Term Differentiation Value of Marketing Communication Actions,” MSI, Working Paper, 1994, 92-134.
12 Light, Larry, with Morgan, Richard, The Fourth Wave: Brand Loyalty Marketing, The Coalition for Brand Equity, American Association of Advertising Agencies, NY, 1994.
13 The measurement goals are articulated in the Shareholders Brochure, October 2003, pp. 4-6.