

Troubleshooting
Problems can occur when running Java web applications inside of CICS Transaction Server (CICS TS). Additionally, with several different components running in tandem, the amount of documentation to review can be confusing. When you have CICS TS, the Liberty Profile, and the Java virtual machine (JVM) running and gathering documentation, where should you begin?
If you encounter problems, you can use the diagnostic tools provided by CICS, the JVM, and the Liberty Profile to determine the cause of the problem. CICS provides statistics, messages, and tracing to help you diagnose problems related to your Java applications. The IBM Java software development kit (SDK) diagnostic tools give more detailed information about the internals of the JVM, including the garbage collection and just-in-time (JIT) daemon threads running in a JVM. The Liberty Profile tools provide information about its inner workings.
This chapter discusses some of the diagnostics and tools available that can be obtained from your Liberty JVM server environment and applications, mainly focusing on diagnosing problems within a CICS region.
This chapter describes the following topics:
12.1 Diagnostics
In addition to the traditional CICS administration facilities, such as the CICS EXEC Master Terminal (Customer Information Control System (CEMT)) transaction, the system programming interface (SPI), transaction monitoring, and statistics, there are a number of unique interfaces and diagnostic logs that are specific to the CICS Liberty JVM environment that you can use for problem determination with Java web applications.
12.2 Messages and log files
Several logs can be used by the JVM server environment on CICS. These logs vary from z/OS file system (zFS) files to traditional DD destinations in the CICS job. The zFS files are located, by default, in the working directory of the JVM server.
12.2.1 CICS logs
Most errors that occur in a JVM server result in a message being issued to the CICS MSGUSR DD log. This is one of the first places to look for any CICS related errors, warnings, or abends that might have occurred.
The SYSPRINT DD log is the stdout destination normally used by C-language routines. In a CICS region in particular, it might contain errors from the initialization of the JVM server. If omitted, individual SYSPRINT DD logs are dynamically allocated for each JVM server instance, in the pattern SYSnnnnn.
12.2.2 Java logs
When the JVM server has initialized, output from the System.out stream is written to the STDOUT destination set by the STDOUT option within the JVM server profile. If the file exists, output is appended to the end of the file.
If you specify the USEROUTPUTCLASS option in a JVM profile, the Java class named on that option handles the System.out requests instead. CICS supplies a sample class, com.ibm.cics.samples.SJMergedStream, which can be used to redirect output from stdout back to the MSGUSR log.
The STDERR destination is the primary location to which Java exceptions and stack traces are written. These exceptions are typically a result of errors in Java applications or components.
The location is set by using the STDERR option in the JVM server profile. If the file exists, output is appended to the end of the file.
For JVM servers, the default file name is <applid>.<jvmserver>.dfhjvmout, which means that a unique file is created for each JVM server and CICS region. In addition, further unique files can be made by using the &APPLID; &JVMSERVER, &DATE; and &TIME; symbols.
12.2.3 Liberty Profile server logs
Three primary log files are written by the Liberty Profile server:
•The messages.log file contains all messages except trace messages that are written or captured by the logging component. All messages that are written to this file contain more information, such as the message time stamp and the ID of the thread that wrote the message. This file does not contain messages that are written directly by the JVM process. Each message has a unique message identifier, and includes an explanation of the problem, and details of any action that you can take to resolve the problem. Liberty profile system messages are logged from various sources, including application server components and applications.
•The console.log file contains the redirected standard output and standard error from the JVM process. The console output contains major events and errors if you use the default consoleLogLevel configuration. The console output also contains any messages that are written to the System.out and System.err streams if you use the default copySystemStreams configuration. The console output always contains messages that are written directly by the JVM process, such as -verbose:gc output. By specifying the following parameter within the JVM profile, you can control which messages that Liberty writes to the stdout file:
com.ibm.ws.logging.console.log.level={INFO|AUDIT|WARNING|ERROR|OFF}
•The trace.log file contains all the messages that are written or captured by the product. This file is created only if you enable additional trace. This is usually at the request of Level 2 Support. This file does not contain messages that are written directly by the JVM process. Within the JVM profile, selectively enable this trace and specify the file name by using the following parameters:
com.ibm.ws.logging.trace.specification=*=all=enabled
com.ibm.ws.logging.trace.file.name=trace.log
12.3 Dumps and trace
Several sources of detailed diagnostic information can be collected from a JVM server. This includes several types of dumps as well as tracing that can be activated in each of the components.
12.3.1 Java dumps and trace
Three types of Java dumps can be produced by the JVM.
The Javadump is often referred to as a Javacore or thread dump in some JVMs. This dump is in a human-readable format. It is produced by default when the JVM terminates unexpectedly because of an operating system signal, an OutOfMemoryError exception, or when the user enters a reserved key combination (for example, Ctrl-Break on Microsoft Windows). You can also generate a Javadump by calling a method from the Dump API, for example com.ibm.jvm.Dump.JavaDump(), from within the application. A Javadump summarizes the state of the JVM at the instant the signal occurred. Much of the content of the Javadump is specific to the IBM JVM.
The JVM can generate a Heapdump, which is a snapshot of JVM memory. It shows the live objects on the heap along with references between objects. It is used to determine memory usage patterns and memory leak suspects. A Heapdump can be taken at the request of the user by calling com.ibm.jvm.Dump.HeapDump() from inside the application or when the JVM ends because of an OutOfMemoryError exception. You can specify finer control of the timing of a Heapdump with the -Xdump:heap option. For example, you can request a Heapdump after a certain number of full garbage collections have occurred. The default Heapdump format (.phd files) is not human-readable and must be processed by using available tools, such as Memory Analyzer.
System dumps are platform-specific files that contain information about the active processes, threads, and system memory. System dumps are usually large. By default, system dumps are produced by the JVM only when the JVM fails unexpectedly because of a general protection fault (GPF) or a major JVM or system error. You can also request a system dump by using the Dump API. You can call the com.ibm.jvm.Dump.SystemDump() method from your application. You can use the -Xdump:system option to produce system dumps when other events occur.
IBM JVM tracing allows execution points in the Java code and the internal JVM code to be logged. The -Xtrace option allows the number and areas of trace points to be controlled, as well as the size and nature of the trace buffers maintained. The internal trace buffers at a time of failure are also available in a system dump and tools are available to extract them from a system dump. Generally, trace data is written to a file in an encoded format and then a trace formatter converts the data into a readable format. However, if small amounts of trace are to be produced and performance is not an issue, trace can be routed to STDERR and will be preformatted.
12.3.2 Liberty Profile server dumps and trace
Within a running server, there might be occasions when a dump is needed for further analysis. Within the Liberty Profile server, use the server script command to capture status information for a Liberty profile server.
The server dump command is useful for problem diagnosis of a Liberty profile server, because the result file contains server configuration, log information, and details of the deployed applications in the workarea directory. This command can be applied to either a running or a stopped server.
The server javadump command is useful for diagnosing problems at the JVM level, such as hung threads, deadlocks, excessive processing, excessive memory consumption, memory leaks, and defects in the virtual machine. The server must be running to use this command. Each dump type creates a file, but not all dump types are supported by all virtual machines. By default, the files are written to the ${server.output.dir} directory.
For a running server, the following information is also included:
•State of each Open Service Gateway initiative (OSGi) bundle in the server
•Wiring information for each OSGi bundle in the server
•Component list that is managed by the Service Component Runtime (SCR) environment
•Detailed information about each component from SCR
•Configuration administration data of each OSGi bundle
•Information about registered OSGi services
•Runtime environment settings, such as JVM, heap size, operating system, thread information, and network status
Within a CICS environment, use the wlpenv script to request these dumps. We discuss this script in 12.7.1, “Using the wlpenv script to run Liberty commands” on page 224.
12.3.3 CICS dumps and trace
When errors occur, transactions abend and messages are written to the appropriate log. Messages related to Java are in the format DFHSJxxxx. You can also turn on tracing to produce more diagnostic information. When the first JVM is started in a CICS region after initialization, CICS issues message DFHSJ0207, which shows the version of Java that is being used:
DFHSJ0207 date time applid JVMSERVER jvmserver is running Java version version
In addition to the logging produced by Java, CICS, and the Liberty server, CICS also provides some standard trace points in the SJ (JVM) and AP domains. These trace points trace the actions that CICS takes in setting up and managing JVM servers, installing and running applications, and making JCICS calls. JVM server tracing does not use auxiliary trace or GTF tracing. CICS writes some information to the internal trace table. However, most diagnostic information is logged by Java and written to a file in zFS. This file is uniquely named for each JVM server and created within the WORK_DIR directory when you enable the JVMSERVER resource. The default file name has the format applid.jvmserver.dfhjvmtrc. You can change the name and location of the trace file in the JVM profile. If you delete or rename the trace file when the JVM server is running, CICS does not re-create the file and the logging information is not written to another file.
This file does not wrap so you must manage its size and the number of unique entries in zFS. You can manage the number of files by setting the LOG_FILES_MAX option in the JVM profile to control the number of old trace files that are retained on the JVM server startup. If you disable the JVMSERVER resource, you can delete old entries or rename them if you want to retain the information separately. When you enable the JVMSERVER resource, CICS appends the new entries to the trace file if it already exists and creates a file.
You can activate JVM server tracing by turning on SJ and AP component tracing by using either the CETR transaction or the SIT STNTRxx parameter. The SJ component traces exceptions and processing in the SJ domain to the internal trace table. The AP component traces the installation of OSGi bundles in the OSGi framework.
Set the tracing level for the SJ and AP components:
•SJ level 0 produces tracing for exceptions only, such as errors during the initialization of the JVM server or problems in the OSGi framework.
•SJ level 1 and level 2 produce more CICS tracing from the SJ domain. This tracing is written to the internal trace table.
•SJ level 3 produces additional logging from the JVM, such as warning and information messages in the OSGi framework. This information is written to the trace file in zFS.
•SJ level 4 and AP level 2 produce debug information from CICS and the JVM, which provides much more detailed information about the JVM server processing.
12.4 Additional documentation
In addition to the above sets of documentation, there are other ways that are available to help monitor and tune the JVM server. CICS statistics and garbage collection can be used to properly tune the JVM.
12.4.1 CICS statistics
CICS collects statistics for the JVM servers and for Java programs that run in the JVMs. You can use these statistics to manage and tune the Java workloads that are running in your CICS regions. The JVM server statistics tell you about the activity of the JVM that is used by a particular JVM server. The JVM program statistics tell you about Java programs that run in the JVM servers. You can use the CEMT transaction to inquire on the JVMSERVER. You can also access JVMSERVER statistics online by using the EXEC CICS EXTRACT STATISTICS JVMSERVER() command, by using the STAT transaction, or through the CICS Explorer JVM Servers view. JVMSERVER statistics are mapped by DFHSJSDS DSECT.
12.4.2 Garbage collection data
Garbage collection and heap expansion are an essential part of the operation of a JVM. When a JVM runs out of space in the storage heap and is unable to allocate any more objects, an allocation failure occurs and a garbage collection is triggered. To help diagnose problems in the garbage collection, add the -verbose:gc option to the JVM profile. This produces output in XML format that can be used to analyze problems in the Garbage Collector itself or problems in the design of user applications.
12.5 Debugging tools
In this section, we discuss the tools that are available that allow you to interactively debug a Java program running in CICS.
12.5.1 Execution diagnostic facility
CICS provides the Command Execution Diagnostic Facility (CEDF) as a basic debugging tool.
You can use the execution diagnostic facility (EDF) to test an application, which can be used to test application programs online without modifying the program or the program-preparation procedure. When used, CEDF intercepts a transaction when each program starts and finishes, before and after any EXEC CICS or EXEC SQL commands are executed, and when the task ends. Using CEDF gives you a chance to interact with your transaction and view the parameters and responses that are passed back and forth as well as storage areas when each command is executed.
When used with a JCICS program, CEDF intercepts the CICS commands that the Java Native Interface (JNI) programs start, which provide the interface between JCICS classes and CICS. There might not be an obvious relationship between the JCICS class method and the CICS command. For example, the HelloCICSWorld sample uses the Task.out.println() method to send a message to the user terminal. The JNI program starts the SEND command to write to the panel.
To use EDF on the same terminal as the transaction you are testing, follow these steps:
1. Type CEDF and press Enter to turn it on.
This results in the following message being printed to the terminal:
THIS TERMINAL: EDF MODE ON
2. Type CEDF,,OFF and press Enter to turn it off. (notice the double commas)
This results in the following message being printed to the terminal:
THIS TERMINAL: EDF MODE OFF
To use EDF on a different terminal than where the transaction is located:
1. Type CEDF,#### where #### is the other terminal ID and press Enter to turn it on.
2. Type CEDF,####,OFF and press Enter to turn it off.
12.5.2 Java debugger
When you use the CICS Explorer SDK to develop your web applications and then deploy them in the Liberty JVM server, if a failure occurs in the application it can be difficult to debug because there is no development environment there. This is where remote debugging comes in handy. The Java Platform Debugger Architecture (JPDA) is a useful tool for debugging applications that are failing in a deployment environment remotely. The JPDA is the standard debugging mechanism provided in the Java 2 Platform. This architecture provides a set of APIs that allow the attachment of a remote debugger to a JVM. The JPDA connects your running application with your development environment (such as Eclipse).
Java provides this debugger using a listener mechanism. The application that you want to debug attaches a socket to itself where it listens for any debug instructions. The JPDA then uses this socket to connect to the JVM. To debug an application remotely, it must be running in debug mode. This requires that the JVM is started with the following debug argument:
-agentlib:jdwp=transport=dt_socket,server=y,suspend=n,address=port
In a CICS environment, this means adding the –agentlib:jdwp option to the JVM profile for the JVM server and using the CICS Explorer SDK to debug your applications.
To configure Eclipse to remotely debug CICS web applications, follow these steps:
1. Ensure that the Liberty JVM server is either DISABLED or not installed in your CICS region.
2. Add the following option to your JVM profile to attach the remote debugger:
-agentlib:jdwp=transport=dt_socket,server=y,suspend=n,address=53107
3. Set the address= option to an available port number that the CICS region user ID is authorized to open. This is the port that Eclipse will connect to during the debug session.
4. Install your JVMSERVER resource definition (or set it to Enable).
5. Install the CICS BUNDLE resource definition for your CICS web application.
6. In the CICS Explorer SDK, switch to the debug perspective by going to Window → Open Perspective → Other → Debug → OK.
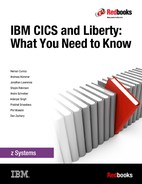
7. Select Run → Debug Configurations to set up the JPDA configuration.
8. Right-click Remote Java Application and click New.
9. Give the configuration a meaningful name.
10. Select the Project you want to debug.
11. Select Socket Attach to attach the debugger to the application.
12. Specify the host name of your z/OS system and the port from step 2.
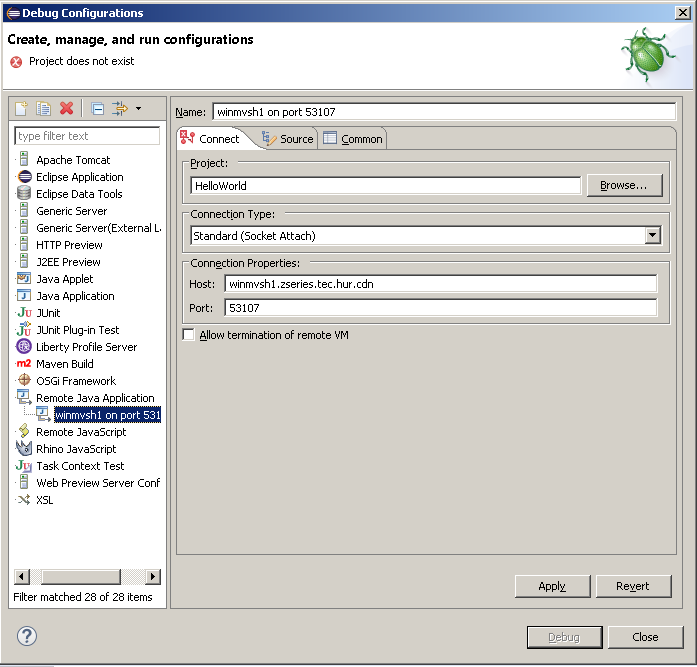
Figure 12-1 Debug configurations
Because the JVM is running in server mode, it must be started first in debug mode. Then, the debugger is started. Otherwise, you would get a “Failed to connect to remote VM” message.
14. Switch to the web perspective and go to your application class that you need to debug.
15. Set your breakpoints by double-clicking in the margin.
16. Save your changes and export the CICS Bundle to zFS.
17. Install CICS BUNDLE resource to deploy it to the Liberty JVM.
18. In your web browser, enter the URL for the web application.
19. When the first breakpoint hits, the Eclipse perspective switches to the debug perspective. You can now step through your application code.
12.6 JVM Health Center
The IBM Health Center is a diagnostic tool for monitoring the status of a JVM and can be used with any IBM JVM, including the CICS Liberty server. It provides recommendations and analysis that help you improve the performance and efficiency of your application. In particular, it is good for deep dives into issues with performance, high CPU, and monitor contention. In this section, we look at the Health Center and how to integrate it with CICS Explorer for monitoring.
12.6.1 What the Health Center is
The Health Center has a low runtime overhead and can be used to profile and tune your CICS Java application. The Health Center is a monitoring tool that consists of two components, which are installed separately:
•The agent, which is shipped with the IBM JVM
•The client, which is an Eclipse-based GUI perspective
Figure 12-2 shows where the Health Center agent and client are installed when using CICS.

Figure 12-2 Location of Health Center agent and client
The Health Center agent is a JVMTI native library that must be enabled in the JVM (by default, it is off). It monitors the Java applications and collects data from the running application. The agent can be enabled in three modes:
•Socket communication, by specifying –Xhealthcenter:port=xxxx: The agent connects to a client through a socket. It communicates either in IIOP (default) or JRMP.
•Headless, by specifying –Xhealthcenter:level=headless. Instead of opening a socket, it stores the agent data to a zFS file system in an HCD file.
•Late attach, where no data is collected until the client connects.
It is always a preferred practice to update the agent because it is independent of the JVM and the latest version has bug fixes, additional collection, better options, and so on.
The Health Center client is used to interpret the data collected by the agent. It provides recommendations to improve the performance of the monitored application. The Health Center client has several different views, each providing data on a different aspect of the JVM. Following are some of the available views:
•Classes: Provides information about classes being loaded
•CPU: Provides processor usage for the application and the system on which it is running
•Environment: Provides details of the configuration and system of the monitored application
•Garbage Collection: Provides information about the Java heap and pause times
•I/O: Provides information about I/O activities that take place
•Locking: Provides information about contention on inflated locks
•Method Trace: Provides information about method use over time
•Native Memory: Provides information about the native memory usage
•Profiling: Provides a sampling profile of Java methods including call paths
•Threads: Provides information about the live threads of the monitored JVM
12.6.2 Install and Configure the Health Center and CICS Explorer
Because the Health Center client is Eclipse-based, it can be installed and utilized by using the CICS Explorer. We do not look at how to monitor a CICS web application using the Health Center and CICS Explorer.
To monitor a CICS Liberty JVM using the Health Center, follow these steps:
1. Install the Health Center client
The easiest way to install the Health Center client is by using the Eclipse Marketplace. In your Eclipse client, follow these steps:
a. Select Help → Eclipse Marketplace.
b. In the Search tab, enter Health Center in the “Find” field.
c. Select IBM Monitoring and Diagnostic Tools for Java - Health Center from the list and click Install.
d. Confirm that the Health Center and Health Center Core will be installed and click Confirm.
e. Read and accept the license terms and then click Finish.
2. Enable the Health Center agent in the JVM:
a. Ensure that the JVMSERVER resource ID is DISABLED.
b. Add the following arguments to the JVM profile:
-Xhealthcenter:port=53108
-Dcom.ibm.java.diagnostics.healthcenter.agent.iiop.port=53109
|
Note: Information that will help you follows:
•The default port for the Health Center agent is 1972. You could just add –Xhealthcenter to use the default port 1972.
•The secondary port is used for the JVM over RMI-IIOP connection. The default is to choose this port randomly. It can be configured by specifying the iiop port.
•If you use a non IBM JDK to run the Eclipse client, there can be a conflict in protocols. Set the following option instead so that the Liberty server uses RMI-JRMP to connect:
-Xhealthcenter:transport=jrmp,port=xxxxx
|
c. Enable or start the JVM server
The JVM server jvmerr file will show the following messages indicating the Health Center agent was successfully started:
Nov 15, 2015 6:55:11 AM com.ibm.java.diagnostics.healthcenter.agent.mbean.HCLaunchMBean <init>
INFO: Agent version "3.0.4.20150622"
Nov 15, 2015 6:55:12 AM com.ibm.java.diagnostics.healthcenter.agent.mbean.HCLaunchMBean createJMXCon-nector
INFO: IIOP will be listening on port 53109
Nov 15, 2015 6:55:12 AM com.ibm.java.diagnostics.healthcenter.agent.mbean.HCLaunchMBean startAgent
INFO: Health Center agent started on port 53108.
3. Connect the Health Center Client to the JVM:
a. In the CICS Explorer SDK, go to the Health Center perspective by going to Window → Open Perspective → Other → Health Center Environment → OK.
b. Click File → New connection to open the Health Center Connection wizard. Click Next.
c. In the JMX connector tab, enter the z/OS host name and port number that the Health Center agent is listening on as specified in the JVM profile (-Xhealthcenter:port=).
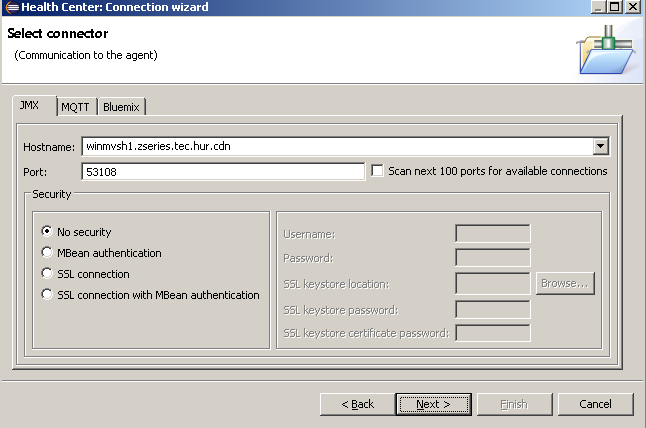
Figure 12-3 Connecting the Health Center client
Figure 12-4 Selecting an agent
You are now successfully connected. The Configuration view is now displayed, providing useful information about all the Java parameters, dump options, and classpath settings in the JVM. By using the Status view, you can access the different functions of the Health Center.
For more information about how some of these features can be used to analyze the CICS JVM server, see Integrating IBM Health Center and CICS Explorer at the following site:
12.7 Liberty debug tools
You might be asked by IBM service to run one or more of the Liberty profile-supplied commands, such as productInfo or server dump. To run these commands, use the wlpenv script as a wrapper to set the required environment for running the Liberty commands. This script is created and updated every time the Liberty JVM server is enabled after the JVM profile has been successfully parsed. This script is unique to each JVM server in each CICS region. Therefore, it is created in the WORK_DIR directory as specified in the JVM profile.
12.7.1 Using the wlpenv script to run Liberty commands
To run the wlpenv script in the UNIX System Services shell, change to the WORK_DIR directory, and run the script with the Liberty profile command as an argument. For example:
./wlpenv productInfo version
You can verify the integrity of the Liberty profile installation after you install CICS or apply service by using the productInfo script.
The following examples demonstrate the correct syntax for using the Liberty command scripts and parameters using the CICS wlpenv script:
•compare: Allows you to compare APAR fixes installed in the current installation with a different version of the Liberty profile:
./wlpenv productInfo compare --target=C:wlp
ewInstallwlp
./wlpenv productInfo compare --target=C:wlp
ewInstall.jar –-output=C:wlpcompareOutput.txt
./wlpenv productInfo compare –-apars=com.ibm.ws.apar.PM39074,com.ibm.ws.apar.PM39075
•featureInfo: Lists all features installed on the current Liberty profile server:
./wlpenv productInfo featureInfo --output=c:wlpfeatureListOutput.txt
•validate: Validates the Liberty profile server:
./wlpenv productInfo validate
•version: Displays the product name and version:
./wlpenv productInfo version
•viewLicenseAgreement and viewLicenseInfo: Displays the license agreement and information for the Liberty profile edition that is installed:
./wlpenv productInfo viewLicenseAgreement
./wlpenv productInfo viewLicenseInfo
•help: Displays help information for the specific action:
./wlpenv productInfo help compare
•server: Captures a snapshot of the server or JVM status:
./wlpenv server dump --archive=package_file_name.dump.pax --include=heap
./wlpenv server javadump –-include=heap
12.8 Symptoms and user actions
This section describes the basic failure scenarios that might occur during JVM server set up, the deployment of user applications, or at application runtime.
12.8.1 Unable to start the Liberty JVM server
If you are unable to start a Liberty JVM server, check that your setup is correct. Use the CICS messages and SYSPRINT data for any errors in the Liberty messages.log file that is below WLP_OUTPUT_DIR to determine what might be causing the problem.
Check that the -Dfile.encoding JVM property in the JVM profile specifies either ISO-8859-1 or UTF-8. These are the two code pages that are supported by the Liberty profile server. If you set any other value, the JVM server fails to start.
12.8.2 Web application is not available after it is deployed to dropins directory
If you receive a CWWK0221E error message in dfhjvmerr, check that you set the right values for the host name and port number in the JVM profile and server.xml. This error message indicates that the port number or host name that are specified are incorrect. The host name might be invalid or the port number might be in use.
12.8.3 CICS CPU usage is increased after a Liberty JVM server is enabled
The Liberty JVM server is scanning the dropins directory too frequently and causing too much I/O and CPU usage. The frequency that the Liberty JVM server scans the dropins directory for applications is configurable. The default interval that is supplied in the configuration templates is 5 seconds, but you can increase this value or disable the application scan. To fix this problem, edit the following XML in the server.xml file to disable application monitoring:
<config monitorInterval="5s" updateTrigger="polled"/>
<applicationMonitor updateTrigger="disabled" pollingRate="5s" dropins="dropins" dropinsEnabled="false"/>
If you install your web applications in CICS bundles, do not disable polling in the <config> element, but disable the application scan.
12.8.4 Application not available
You copy a WAR file into the dropins directory but your application is not available. Check the Liberty messages.log file for error messages. If you receive the CWWKZ0013E error message, you already have a web application running in the Liberty JVM server with the same name. To fix this problem, change the name of the web application and deploy to the dropins directory.
12.8.5 Web application is not requesting authentication
You configured security, but the web application is not requesting authentication. Follow these steps:
1. Although you can configure CICS security for web applications, the web application uses security only if it includes a security restraint in the WAR file. Check that a security restraint was defined by the application developer in the web.xml file in the dynamic web project.
2. Check that the server.xml file contains the correct security configuration information. Any configuration errors are reported in dfhjvmerr and might provide some useful information. If you are using CICS security, check that the CICS security feature cicsts:security-1.0 is specified. If CICS security is switched off, check that you specified a basic user registry to authenticate application users.
3. Check that the server.xml file is configured either for <safAuthorization> to take advantage of EJBRoles, or for a local role mapping in an <application-bnd> element. The <application-bnd> element is found within the <application> element in server.xml or installedApps.xml. The default security-role added by CICS for a local role mapping is 'cicsAllAuthenticated'.
12.8.6 Web application is returning an HTTP 403 error code
The web application is returning an HTTP 403 error code in the web browser. If you receive an HTTP 403 authorization failure, either your user ID is revoked or you are not authorized to run the application transaction:
1. Check the CICS message log for the error message ICH408I to see what type of authorization failure occurred. To fix the problem, ensure that the user ID has a valid password and is authorized to run the transaction.
2. If the application is returning an exception for the class com.ibm.ws.webcontainer.util.Base64Decode, check dfhjvmerr for error messages. If you see configuration error messages, for example CWWKS4106E or CWWKS4000E, the server is trying to access configuration files that were created in a different encoding. This type of configuration error can occur when you change the file.encoding value and restart the JVM server. To fix the problem, you can either revert to the previous encoding and restart the JVM server, or delete the configuration files. The JVM server re-creates the files in the correct file encoding when it starts.
12.8.7 Web application is returning an HTTP 500 error code
The web application is returning an HTTP 500 error in the web browser. If you receive an HTTP 500 error, a configuration error occurred:
1. Check the CICS message log for DFHSJxxxx messages, which might give you more information about the specific cause of the error.
2. If you are using a URIMAP to run application requests on a specific transaction, ensure that the URIMAP is using the correct transaction.
3. If the URIMAP is using the correct transaction, ensure that the SCHEME and USAGE attributes are set correctly. The SCHEME must match the application request, either HTTP or HTTPS. The USAGE attribute must be set to JVMSERVER.
12.8.8 Web application is returning an HTTP 503 error code
The web application is returning an HTTP 503 error in the web browser. If you receive an HTTP 503 error, the application is not available:
1. Check the CICS message log for DFHSJxxxx messages for additional information.
2. Ensure that the TRANSACTION and URIMAP resources for the application are enabled. If these resources are packaged as part of the application in a CICS bundle, you can check the status of the BUNDLE resource.
3. The request might have been purged before it completed. The error messages in the log describe why the request was purged.
12.8.9 The web application is returning exceptions
The web application is returning exceptions in the web browser. For example, the application is returning an exception for the class com.ibm.ws.webcontainer.util.Base64Decode:
1. Check the dfhjvmerr for error messages.
2. If you see configuration error messages, for example CWWKS4106E or CWWKS4000E, the server is trying to access configuration files that were created in a different encoding. This type of configuration error can occur when you change the file.encoding value and restart the JVM server. To fix the problem, you can either revert to the previous encoding and restart the JVM server, or delete the configuration files. The JVM server re-creates the files in the correct file encoding when it starts.
12.8.10 Error message CWWKB0109E
If the Liberty server fails to shut down cleanly, the next Liberty JVM server with WLP_ZOS_PLATFORM=TRUE writes the error message CWWKB0109E to the messages.log file. You do not need to fix this error and it can be ignored.
12.8.11 JVM server set-up failures
If you are unable to start a JVM server, check the available documentation for an indication of the problem. The CICS message log will provide the following message indicating the reason for the failure:
DFHSJ0210 date time applid An attempt to start a JVM for the JVMSERVER resource jvmserver has failed. Reason code: reason
One of the following reasons will be given:
•ATTACH_JNI_THREAD_FAILED
An attempt to attach a thread and run setup or termination classes in the JVM server has failed. Contact IBM Support for further assistance.
•CHANGE_DIRECTORY_CALL_FAILED
An attempt to change the zFS working directory has failed. Check that the CICS job has read, write, and execute access to the directory specified by WORK_DIR in the JVM profile.
•CREATE_JVM_FAILED
An attempt to create a JVM has failed. Additional diagnostic messages have been output to the standard error stream. Use these messages to determine the cause of the problem.
•ENCLAVE_INIT_FAILED
The IBM Language Environment® enclave failed to initialize successfully. Check that the SDFJAUTH library is in the STEPLIB concatenation of the CICS region. Check SYSPRINT, or the CICS log, for any error messages that are output by the Language Environment. It is likely that either the SDFJAUTH PDSE has not been included in the APF-authorized STEPLIB concatenation, or there is not enough storage available to Language Environment. Additional information might be available in message DFHSJ0216.
•ERROR_CODE_UNRECOGNIZED
START_JVM returned an error that was not handled. Contact IBM Support for further assistance.
•ERROR_LOCATING_MAIN_METHOD
An attempt to locate the main method within a setup or termination class has failed. An exception has been output to the standard error stream. Use the exception to determine the cause of the problem.
•JNI_CREATE_NOT_FOUND
JNI Create has not been found. This error might occur because the JAVA_HOME value in the JVM profile does not specify the correct Java installation location. Check that the JAVA_HOME value specifies the correct installation directory.
•JVMPROFILE_ERROR
An error occurred when processing the JVM profile. Additional diagnostic messages have been output to the standard error stream. The standard error stream is usually redirected to the location on zFS specified by the WORK_DIR parameter of the JVM profile. However, for early failures before redirection, the standard error stream might be in SYSPRINT, or in the CICS log as a dynamically generated DD name. Use the additional messages to determine the cause of the problem.
•OPEN_JVM_ERROR
An error occurred when opening the JVM DLL. This error might occur because the JAVA_HOME value in the JVM profile does not specify the correct Java installation location. Check that the JAVA_HOME value specifies the correct installation directory.
•REDIRECT_IO_FAILED
An attempt to redirect stdout, stderr, or jvmtrace output for the JVM has failed. Additional diagnostic messages have been output to the standard error stream either on zFS, in SYSPRINT, or in the CICS log as a dynamically generated DD name. Use the messages to determine the cause of the problem.
•SETUP_CLASS_NOT_FOUND
A setup class specified in the JVM profile cannot be found. An exception has been output to the standard error stream. Check that the directory or archive containing the setup class is added to the classpath using the CLASSPATH_SUFFIX JVM Profile option and that the setup class is fully qualified.
•SETUP_CLASS_TIMEDOUT
A setup class did not return in a reasonable amount of time and was therefore canceled. Ensure that your setup classes are not long running and return from the JVM within a reasonable amount of time.
•STDOUT/STDERR_ACCESS_FAILED
An attempt to open the stdout or stderr stream for output has failed. The most likely reason is that the CICS job has read-access only to the directory specified by WORK_DIR in the JVM profile. Check that the CICS job has read, write, and execute access to the directory specified by WORK_DIR in the JVM profile.
•TERMINATION_CLASS_NOT_FOUND
A termination class specified in the JVM profile cannot be found. An exception has been output to the standard error stream. Check that the directory or archive containing the termination class is added to the classpath using the CLASSPATH_SUFFIX JVM Profile option and that the termination class is fully qualified.
•USS_VOLUME_CHECK_FAILED
An attempt to create stdout and stderr files for the JVM has failed because the UNIX System Services file system is full. You need to allocate more space to the file system used for stdout and stderr. It might also be useful to remove files that are no longer needed.
12.8.12 Deploying from Explorer SDK failures
If you are unable to deploy your web application using CICS Explorer SDK, check if there are errors in the CICS bundle project. If there are errors, the CICS Explorer SDK will not export files to zFS.
..................Content has been hidden....................
You can't read the all page of ebook, please click here login for view all page.