Chapter 9: Managing Performance and Troubleshooting
Managing performance for SharePoint Server has not changed much from prior versions. The same tools and processes you used in the past can be used in this version, though there are some caveats. Some of the things we did with other SharePoint versions have become integrated into the configuration of the platform, which gives us a baseline to make even more performance improvements. SQL and SharePoint settings are automatically configured in some cases, whereas in the past, we had to do it ourselves.
In this chapter, we will talk about ways to get a baseline configuration documented on your environment and what tools there are to help you get there. This includes tools that will help you configure your baseline, as well as things admins forget as part of their environment. There are many ways to slice and dice this and I will not be able to cover all possible areas. However, I will point you in the right direction so that you can move forward with getting your server resources figured out and set up for success.
The following topics will be covered in this chapter:
- Performance overview
- Troubleshooting tips
- SQL Server performance
Let's get started!
Technical requirements
The technical requirements for this chapter are as follows:
- Experience using SharePoint Administration versions 2007, 2010, 2013, and 2016
- Lite coding using Visual Studio
You can find the code present in this chapter in this book's GitHub repository at https://github.com/PacktPublishing/Implementing-Microsoft-SharePoint-2019.
Performance overview
All users want is speed and reliability when it comes to satisfying the services provided by SharePoint and your team. I cannot tell you how many times I have been confronted by users and management on why something is performing slowly. Tuning performance ensures that the platform is solid and working as it should, while also giving users the ability to quickly do their work.
When SharePoint runs slowly or is not reliable, you run the risk of users not being able to complete work – there could be major work being done in SharePoint you may know nothing about. I have been on site at a bank where a process ran every day at the same time. No one knew what was going on. We did some performance checks and figured out it was coming from a specific department. It ended up being a reconciliation process that was custom developed for one of the departments.
This type of scenario is common because, as farm administrators, we do not commonly get in the weeds talking to developers all the time or talking with user groups, but we should be. In the previous chapter, I mentioned a hierarchical support model for the SharePoint service. Within that diagram, there were relationships that were built between the support staff and brown bags, as well as information sharing going on between farm admins and users.
This tells us what people are doing, but it also helps us figure out what teams are going to do in the future. This makes everyone aware of those future processes because they could come with modifications that are needed for the systems to perform those duties successfully. This also gives you time to change things as needed to support any content structures, such as web applications, site collections, and other areas, where you can split off a new process to isolation, which also helps with performance.
A lot of times, as admins, we pay too much attention to the high-level requirements, such as Microsoft recommendations on minimum RAM, CPU, and disk space, but there is a lot more to performance that we seem to forget. Sometimes, even with those minimum recommendations, admins still undercut the server resources, thinking it is not a good minimum. They then run servers on less than the minimum specifications, which is a bad choice.
I am here to tell you to make sure you use those minimum specifications. Microsoft tests SharePoint Server builds before releasing the product to give us best practices. Those minimum recommendations are captured for a reason. This is done to set the expectation level of SharePoint running in an environment where you can be comfortable that the product will work as it should.
The performance of your farm all depends on how you created it. Here, again, you use best practices and software boundaries to figure out what is supported. If you are not separating processes, understanding where and how processes run, and figuring out the overhead of related processes that may run in the environment, then you are going to lose the battle. There are also other areas where you can isolate some processes at the web application level, thus giving a site its own IIS space, or even a site collection level, where the site collection is in its own content database.
When systems are slowed by poorly performing configurations, depending on the user or group who encountered the issues while the system was running slowly, you could either have an angry mob or a single user who just puts in a help desk ticket. A single user is not that noticeable in the overall company because it is a single incident that is isolated. There is the factor of who that user is, of course, which depends on their rank and position in the company.
In the case of an angry mob having an issue that is consistent across departments, this will get you and your boss's attention. These incidents are the ones you want to avoid if possible. That is why, in this book, I have been basically preaching about best practices and making sure you have covered every area of configuration. This will save you in the long run.
Client configurations come into play as well, as the user's desktop can be a bottleneck in the environment. The big thing now is that everyone is working from home, so there is a dependency on connectivity from the home to the office. Then, you have a VPN where the users connect to the office from home, which could also slow them down. Understanding these areas as an admin will help you detect what the problem is in most cases.
When site collection admins or developers develop solutions for SharePoint, they can also be bottlenecks for performance. There are best practices they should follow as well. We will touch on them in this chapter, but Chapter 12, SharePoint Framework, will explain more about how we support our developers and what we need to ask about in meetings with them.
There are a lot of areas that we will talk about in this section of this book that were not mentioned in other chapters. This is because they are for special configurations or we need to dwell on these topics a little deeper. You will see why I chose to keep these topics separate; I wanted to have room to expand on them.
There is lots to cover in this chapter as we dive into configurations for caching, which will give you some insight into how it can help your users get faster performance from SharePoint. Distributed Cache also helps as the configuration for this service is usually untouched. With this service, there are other caching methods that can really speed up your farm's performance, especially when you're using large files.
So, let's dive into performance for SharePoint!
The client's role in terms of performance
Since the servers provide the services on your farm, we must be conscious of our users and how their desktop is configured and performing with SharePoint. In this section, we will discuss user resources and how they come into play for performance, as well as what settings can really bring down user responsiveness from the desktop.
Most users that work remotely believe they do not have the right tools to get the job done from their home. Positioning employees so that they perform well is very important. In some cases, it's crucial, depending on the company and the position the employee holds. If they have performance issues, we have lost the battle again. The key thing we want for our home users and on-premises users is a great overall employee experience when working.
The desktop is the first key to successful performance on your enterprise network and cloud solutions because it supports your users at a personal level. This is their source of power and where they work every day. One thing I believe is that a SharePoint admin should understand all the clients that attach to the sites and services SharePoint offers.
Client machines can be laptops, desktops, tablets, or mobile phones. The operating systems that are used on them can be either Linux, Apple, or Windows, with all different versions and flavors available. I believe that, as a company, we should be giving out those systems and not having a user go buy a system to use on our networks. The reason why we want to have more control over these clients is due to governance, speed, and performance. Compromising those areas will cost you in the long run.
We also need to know about these so that we can support the environment, which makes us a special breed of admin. The reason why I say that is that SharePoint admins deal with identity, networks, servers, the web, and databases, and that is on top of managing services and content within the platform. We need to have a vast amount of knowledge to support our farms.
When supporting connections across the internet, there are many of client hardware configurations that can make a desktop respond quickly or slowly. When your desktop team is configuring for Microsoft 365, for example, and connecting to the cloud, we would want a fast network speed. We can key in on a few things regarding this topic, but I am just going to key in on the following areas in this section:
- Enterprise network speed
- VPN choice
- Geolocation of the data center
- User's internet speed (home network)
- Desktop configuration
A user's desktop in a large enterprise – and even a small enterprise – should have the resources available to support the workload and connectivity speeds needed for the user to complete their daily job. The network team should have enough equipment and local locations to support the number of users that will be connecting to the network. This would mean that technical resources need to come up with configurations for networking components, servers, and PCs and/or laptops that fit the person's need based on their job description.
If you want to have users test their connectivity to the Microsoft 365 cloud, there is also a Microsoft 365 connectivity test. The reason I am mentioning this is that you could be standing up your SharePoint 2019 server in a hybrid configuration. These tests need to be carried out to ensure connectivity to the cloud works as well. As far as SharePoint 2019 On-Premises goes, this all depends on the data pipes open to the user. To learn more about this tool and this connectivity strategy, please go to https://docs.microsoft.com/en-us/microsoft-365/enterprise/assessing-network-connectivity?view=o365-worldwide.
Note
To test client speed, have the users type in the words Speed Test in Bing; they will be prompted to start a test from their location.
When evaluating network connectivity, the equipment being used matters. Creating different configurations of machines can mean different behaviors occurring when they're being used. So, if someone is a developer and needs to run VMs on their machine, you may want to give them a machine that has more RAM and CPU than a normal user would need. This could mean having a four-CPU machine with 32 GB of RAM, as an example.
This configuration could also include other areas of concern, such as disk space. We should choose the right disk space for the user, be it for a laptop, desktop, or Windows Surface machine, which are very good as well. With that, we should also have the maximum speed possible from the NIC card on the devices and/or a speedy wireless network connection on the hardware. When the client machine connects to the network, we want the fastest responses to the network and, in turn, we want to have a network that supports fast speeds for the best response back to the client machine.
When you are hosting SharePoint or using Microsoft 365, you should post hardware requirements to the users of your service. The issues that come into play include that you may not be able to force someone to use a certain type of laptop or desktop, or even a mobile device in some cases. With that, the internet service speed that comes with the customer's mobile carrier also makes a difference, as well as where the mobile device is located.
So, in this case, not much can be done because you can't force your customers to buy a certain machine or a certain internet service. At this point, we just have to support the users in terms of what they bring to the table and if they do not use the minimum required hardware, we need to explain that to them when they call in for support. There must be expectations for connectivity, especially antivirus support for those client machines.
There are some things we need to be aware of when configuring a desktop, especially for SharePoint. SharePoint is a site, but there are things we need to remember. The following is a list of applications you could set up for the employees of your company:
- Syncing from SharePoint to the client device for offline access
- Syncing with Libraries and OneDrive
- Outlook calendar sync
- SharePoint Designer
- InfoPath Designer and its services
- Microsoft Project
- IE and browsers
Special configurations such as syncing content from SharePoint to desktop can be cumbersome. In SharePoint 2019, there have been big changes to make this process faster and more reliable. By using OneDrive Sync instead of Groove, like in older versions of SharePoint, we can see major differences in the process for offline files.
Most organizations I have been with have a terrible time managing their VPNs. I have had so many performance problems using Remote Desktop Manager and connecting and managing multiple servers. I can only imagine the problems that users have gaining access to the enterprise network and utilizing applications from within.
Although we believe the VPN is the only issue when using a VPN, there are other factors that add to our bandwidth at this point. This includes the VPN's software performance, the servers we connect to to establish a connection, and our authentication provider for the network.
In most cases, your VPN is establishing an authentication session with your authentication providers. The last client I worked with used Okta. So, as you are authenticating, you are establishing authentication with Okta and, in most cases, using two-factor authentication to finalize that connectivity. This all takes time and synchronization. The speed of the transactions is based on the applications and servers supporting the process.
With those processes comes the factor of the location of your data center, which can influence very heavily how the user connects to the VPN. At this point, the VPN is most likely not load balanced, meaning that any user can make a choice to use any VPN. So, by chance, location A could have 50 people connected and location B could have 250 people connected.
Having multiple sites does help support downed sites where the network is not functioning. This gives the user the choice to change locations based on their experience. If I were a user, I would test all possible locations to see which one works the best. Just because some VPNs are closer to your current location may not mean they run the fastest for you.
You also can consider switching virtual desktops running in the cloud as a solution to bypass some of the issues you may have due to different user incidents. Even your SharePoint servers can run in Azure or another cloud platform that is local to the support of those virtual desktops, which changes the game in a lot of ways in terms of performance. At this point, the performance, stability, and consistency of configurations would be the same using this method. Maintenance and other administrative processes can be run across those resources consistently to bring a similar experience for the users.
Client resources support the user but also run applications that developers create. So, let's talk about developers and their responsibility in the SharePoint environment.
The developer's role in terms of performance
As a rule, all developers should follow best practices when developing code in SharePoint. There are so many ways that code can affect performance and cause other issues with the security and stability of the farm and sites within SharePoint. Developers must be careful to use best practices and make sure to dispose of objects when using assets within the structure to run processes.
The Dispose Checker tool is used to make sure all locked objects that are used while processing a developed solution are released and not locked or in a process where they can cause looping. Solutions should be checked by admins using this tool to make sure these solutions are indeed releasing objects. Solutions that do not release objects cause memory leaks, which can cause your servers to slow down and their performance to degrade. Sometimes, these types of errors are hard to find and take a lot of troubleshooting and skill.
As I have already stated in this book, it is important to have a separate development farm, which is the best solution if you have developers that use the system daily or even in situations where we have one solution being developed for a company. You do not want any developers working on production systems, even if it's just performing a workflow process in SharePoint Designer. It is best to have them outside of the production farm where they can test and run the customization. I've stressed these best practices many times over the course of this book. This is because I have seen that most companies do not support dev and test environments as they seem to think it's a waste of resources.
We will dive into the SharePoint framework in the final chapter of this book, where we will provide more details about developer responsibilities and what you need to be aware of as a developer in a SharePoint environment.
Farm administrator tips
The responsibilities of a farm administrator are many, as stated previously in this book. We support a varying amount of technology as a SharePoint admin, depending on the size of our farm, what applications are integrated within the environment, what type of authentication we use, and our disaster recovery capabilities. These are only a few things we support on a day-to-day basis.
Supporting SharePoint farms in an environment really is downplayed by companies, management, and others I have encountered as part of my 15 years in my SharePoint career. It really baffles me how SharePoint will be used as a centralized repository for documents but is still not given the priority of a tier 1 application in the enterprise.
I have also seen where a farm administrator is supporting a huge farm with three app servers, four web frontends, and redundant SQL servers, and also provides support for many users, including authentication integration, all by themselves. Yes, if you implement SharePoint correctly and it cruises along for 6 months, that is great. The problem comes when there is an issue or there is a big need for support. How do you support that environment and troubleshoot at the same time?
When supporting SharePoint Server in the cloud or on-premises, we need to make sure we have the staff in place, full time or part-time, or a contractor to help handle anything that comes at us. We need to be able to support our environment with the best support possible while utilizing multiple people. Even in this case, one other admin is always great to have on board. The cost of SharePoint going down definitely outweighs paying one extra person to watch over the farm.
This is also true for performance as areas of administration should be separated, depending on the size of your farm. I know that in my last big SharePoint migration, I was a team of one managing a 15 TB migration, user issues, and the administration of two environments while moving from one cloud to another cloud provider. I did it and was successful, but it cost me a lot of sleep and time away from my family.
The performance of your environment is very important and in my situation, I did not have time to worry about performance or even about whether the farm was having issues. Sometimes, I didn't even have time to help users fix issues they were having within site collections. This made me prioritize each issue and fix them as they came to the surface.
If it was something quick, I did it quickly, but other than that, performance was only something I looked at now and then. If a person could connect, that was enough for me, depending on the situation. If the situation was that one user was having performance issues, then I would put that on the back burner, but if there were several users having issues, then it was bumped up in terms of priority. I had to really work hard and fast, document those issues, and prioritize to make this work.
So, in the vein of giving you thoughts and ideas on how to manage the performance of a SharePoint farm from a farm administrator's perspective, I have put together a list of proactive steps you can take to care for your environment before you release it to the users.
Some of these have been mentioned over the course of this book, but I will explain them in a little more detail in this section. There are many ways to configure this environment and you really do not want to miss anything. So, please take the time to review the expected results so that you can find the solutions and configurations that work for you in your environment.
Load testing
If you have tested and constructed a load test with Visual Studio before, you will have noticed that you get some much needed verification in terms of how the farm will support your user base. It also gives you the opportunity to see how your server resources respond as if users in your company were using the farm on a regular basis. These load tests are essential in finding out performance issues before they happen. These tests help you tune your farm and server resources so that the farm responds to the needs of your users. Always remember to run these tools after hours and/or in a segregated environment.
There are two types of Visual Studio load testing toolkits. One is Visual Studio Online, while the other is using Visual Studio 2013 behind your firewall, which is a tool you can use for on-premises environments. You can use the Online tool with your on-premises environment, but the farm must be accessible from the internet:

Figure 9.1 – Creating a new load project
Using the load test as an example, you can easily get your farm set up and configured. You can migrate or create new content within sites so that you can use the load testing tool to imitate a user by recording actions as a video screen capture. The capture then reproduces these actions, such as Power Automate actions, in the cloud to create sessions within the environment that simulate as many users as you like. In the following figure, we can add a user count to simulate as many sessions as we need for testing. We can then bring them online in certain scenarios we may find helpful for testing:
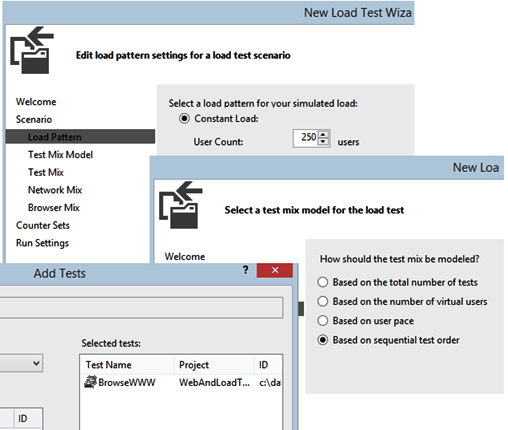
Figure 9.2 – Load testing options
When recording your steps, you can go to different sites, download documents, upload documents, and even test solutions and workflows if you like. Once you've recorded your steps, you can load as many users as you want so that you can perform those same steps as many times as you have users. This gives you a real-time test of your environment based on server resources using solutions that your company may use every day. Configure the options shown in the following screenshot to capture any URL criteria and validate error patterns:
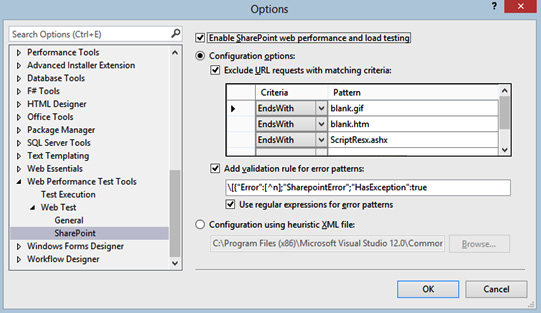
Figure 9.3 – Configuring the options
So, if you realistically have 500 or even 1,000 users, you can load tests using these fictitious user simulations by using a load test script against your farm and sites. When recording these users, who are running your script using the Visual Studio tool, you can record the performance of your servers in real time. This will give you a record of what the server response is as the process runs. You can also customize what processes you grab while the load test script is running to grab what you need or think is necessary. The performance data will be captured during the testing, which you can then export and analyze.
There is also an onboarding process as you can add to your steps at the beginning, which onboards the users based on a certain increment of time. So, if you want to have the first user onboard and start the load testing script, you can stagger the other users by a set time interval. At this point, you could choose times such as 1 minute or even a few seconds. This is when new users jump on board the process and run your load test script. This also tests how many concurrent users the farm will support, as well as how many users can be running scripts at the same time.
I wanted to make sure I shared this tool because lots of people know nothing about it. This process helps you baseline your servers and gives you reports on the different processes running in the environment, as well as information about how the server resources are responding. At this point, once this load test has been successfully run, you can analyze the data you've collected and tweak those areas of concern before running the test again.
This will save you so much time trying to tweak performance and getting ready for Go Live day. There is no need to guess how the servers will perform because you are proving how they will perform with these tests. However, you really want to use content from your environment, and even some developed solutions in your environment, to get a real feel of how these servers will perform. Doing this early in your build process once you've gathered content to test will give you a head start on your server resource configuration. If you want to run against your dev, test, and production environments, then do that. At this point, production is what you really want to understand because that is where the bulk of your users will be using SharePoint the most.
Load testing link: https://marketplace.visualstudio.com/items?itemName=SharePointTemplates.SharePointLoadGenerationTool
Warm-up scripts
There is something about being the first person to come into the office in the morning – especially when you're hitting a SharePoint site. Users want instant results and with SharePoint, if you are the first user, then sorry, but you must wait. Application pools take time to spin up. It's like you using the sleep mode on your computer. Even when you hit the power button or the keyboard, the computer still takes time to come back to a point where you can use it.
This is where warm-up scripts come into play. These scripts work on a scheduled basis, depending on the person who wrote the script. It could also be based on a certain time in the morning you have it run or based on server resources or IIS components. They are used to keep sites in SharePoint warm by keeping the application pool fresh and ready for a user to render the site.
Usually, the first person to hit a site in the morning has to take on the responsibility of the application pool being slow to spin up, which creates wait time for the site to come up for the user. Instead of having them wait, we can add a warm-up script to keep the application pool fresh and readily available so that no one ever has to wait for the site to come to life. This requires either scripting and/or Windows Server scheduling to keep this script active.
To learn more about warm-up scripts, please go to https://gallery.technet.microsoft.com/office/SPBestWarmUp-Warmup-e7c77527.
Storage
Better known as disk space, this is the next in line as disks can cause slow responses when you're reading or writing data to SharePoint. When we say reading and writing to SharePoint, we really mean SQL Server because that is where all our content, configuration, and services live. We would be more concerned about this on a SQL Server database resource than any other server role. The faster your disk can read and write, the faster information can be relayed back to the user.
We need to choose the proper storage for the proper server resources and, in the case of SQL, the proper components to house our databases. When looking at Web and App servers, you should use a disk with good performance since our operating system, logging, and search indexes will play a big part in how this server responds in the farm. Also, you should take blobs and other files that will be added to the server into consideration, as well as the amount of disk space needed to support the servers.
As far as SQL is concerned, we really need to be mindful of what types of databases SQL Server will support, their size, and how they communicate with each other. If we break this down at a high level, we have configuration, search, services, and content. You can spread just these four areas across separate LUNNs or dig deeper to narrow these databases down into more LUNNs. Believe it or not, this will bring about greater performance for the databases and the resources the server consumes to support the farm.
Disk storage comes in many forms. There are companies that specifically make disk arrays with proprietary software to help us manage disks and configurations that support our server and application needs. NetApp is one that I have used in the past that has helped me design storage and supports the SharePoint server farm. Please check out storage companies that may have something to offer you that can bring about better solutions for support.
Disk types are a great way to gain performance boosts as well, with options for SATA, SAS, SCSI, and SSD available. There are many choices, all of which bring different methods of high performance and specific ways to bring stability to your server. We also have options for RAID, which brings data protection options into play. There are a few different options here, including ones for RAID 0, 1, 5, 6, 10, 50, and 60. For more information, please go to https://www.dell.com/support/article/en-us/sln129581/understanding-hard-drive-types-raid-and-raid-controllers-on-dell-poweredge-and-blade-chassis-servers?lang=en.
More information on Azure disks types for cloud configurations can be found here. However, they come at a cost: https://docs.microsoft.com/en-us/azure/virtual-machines/disks-types.
As you configure your servers, you also need to make sure ALL the logs within SharePoint and SQL Server are moved to a separate drive other than your C drive. This can cause servers to stop working altogether. Move IIS logs, especially when you have a large user base. SQL Reporting Services and other integrated applications also have logs. Move them to a separate drive and make sure the drive is big enough to hold your logs and the search index for the farm. Size is important!
The following link talks about Microsoft's recommendations for storage: https://docs.microsoft.com/en-us/sharepoint/administration/storage-and-sql-server-capacity-planning-and-configuration.
Quotas
As we set goals to keep our content at a certain limit, we need to make sure we implement quotas. Site Collection Quotas play a part in the storage's configuration as well. Quotas help you set limits on how much content a user can have in a site collection. There are thresholds you can set here that will help warn users using that site collection that they may be running out of space.
Microsoft has limits on what you can set, which could be a 200 GB minimum to a 400 GB maximum. The reason for these limits is to help the environment recover quickly if you have to restore or perform a migration backup and copy these databases to another server or cloud service. The smaller you can keep these site collections, the better off you will be in the long run when it comes to avoiding issues with backups, restores, and performance due to the size of content databases.
Deleting site collections and subsites
Deleting a site collection from a content database can also cause performance issues you may not be aware of. When the site collection is deleted, it may take a while, depending on the size of the sites supported within that site collection. Other users who have site collections in that content database will be affected once you start this process as well.
There are a couple of ways to do this using Remove-SPSite and the GradualDelete parameter. When you delete site collections all at once, SQL Server may take some time to process the request, depending on its size and how many databases you are running on the server, as well as the RAM and CPU on the server resources. Using the gradual delete option will put this process at a lower priority so that it does not affect the performance of the server.
Some recommendations when doing this are as follows:
- Run the deletion over a weekend, which would alleviate the issue of other users being affected.
- When setting up the farm, make a rule that all site collections must have a one-to-one relationship with a content database (this helps with restoring processes).
- Move the other site collections in the content database to a new content database if there's more than one site collection per database.
- To recapture the disk space after deletion, run a shrink on the database and log files.
Deleting subsites is done within your site collection. Sometimes, these sites get very big and take up a lot of space within a site collection. At this point, you can see if the site is really needed, move content from this site to another site, or upgrade the subsite to its own site collection. This helps reduce the storage in a site collection as well.
As a site collection admin, you now have the option to create site collections. This is a new feature that was made available in SharePoint 2016 called Self-Service Site Creation. This is different from what you are thinking, because now, we can make web applications use this feature. However, the feature has gone further and lets site collection admins create their own site collections. This does take coordination, documentation, and database management, so make sure to communicate when and if you have these features activated.
RAM
As you set up your server resources, RAM is another area of concern as you will want to make sure you have enough RAM to support the server resources for the farm. Do not use minimums as your point of reference. It is better to test the load on the servers to see how they respond. There are many dynamics that come into play here, such as the following:
- How many web applications are you running?
- Are you running Host Named Site Collections?
- How many content databases are you running?
- How many users are connecting to the farm?
- What processes are running?
- How heavily used are those processes?
There are probably more things you can consider, but these have been mentioned to get you thinking about how to scale your environment with memory so that you do not revisit this right away.
Virtual environments
When setting up my environment, I used VMs within my environment to run all the server resources. One thing you want to make sure of is that you do not want to run RAM dynamically. This causes lots of issues with the servers and is not supported by Microsoft. They will basically stop working with you if you are running your farm with this configuration.
Another thing to be mindful of is the introduction of Distributed Cache. If you have a dedicated MinRole running dynamic RAM, this would negate the use of this service as this has to be configured as static. This is because the RAM cannot fluxgate. Remember to set your Distributed Cache size to an optimal setting. You can set Distributed Cache to a maximum of 16 GB.
More information on this can be found at https://docs.microsoft.com/en-us/sharepoint/install/deploy-sharepoint-virtual-machines.
PowerShell Jobs
New to the scene, or somewhat new, are PowerShell Jobs. If you come from a Unix or Linux background, then you will be familiar with these types of processes. With PowerShell, there are two types of code that can be executed:
- Synchronous
- Asynchronous
When using synchronous execution, PowerShell will execute code in the script one line at a time. It will complete each line of code before it starts another line of code. This is usually how I see admins run code so that there is order in the code so that it can complete successfully. It's usually an easy way to write something quickly and think out the strategy in some type of order, while not really taking advantage of the performance of server resources.
When creating scripts, you may want to consider using asynchronous execution and a concept called Jobs. I used a product back in the day called WinCron, when I used to do a lot of SQL and Windows Server automated processes. This type of processing using PowerShell seems to be similar. Jobs are great for performance only when a script does not depend on the results of a prior execution in the code. They run in the background and don't interact with the current session.
The following are some parameters you can use when creating jobs:
- Start-Job: Starts a background job on a local computer.
- Receive-Job: Gets the results of background jobs.
- Stop-Job: Stops a background job.
- Get-Job: Gets the background jobs that were started in the current session.
- Wait-Job: Suppresses the Command Prompt until one or all jobs are completed.
- Remove-Job: Deletes a background job.
- Invoke-Command: The AsJob parameter runs any command as a background job on a remote computer. This command also runs any job command remotely. The Start-Job command can also be started remotely using Invoke-Command.
To learn more about PowerShell Jobs, take a look at the following links:
- https://docs.microsoft.com/en-us/powershell/module/microsoft.powershell.core/about/about_jobs?view=powershell-7
- https://docs.microsoft.com/en-us/powershell/module/microsoft.powershell.core/about/about_remote_jobs?view=powershell-7
Distributed Cache service
When configuring SharePoint server, you will notice that Distributed Cache service is installed on every server you installed SharePoint on. During the installation, if you do not want a server to be updated with the service, use the skipRegisterAsDistributedCachehost parameter when creating a new configuration database. Distributed Cache supports the following caching functionalities:
- Claims-based authentication
- Newsfeeds, micro blogging, and conversations
- OneNote client access
- Security trimming
- Page load performance
This service can be run on any server and can be run in dedicated server mode or in collocated server mode. In dedicated mode, all services other than Distributed Cache are stopped on the servers that run Distributed Cache. In collocated mode, the service can run together with other SharePoint services, and it's up to you to manage which servers the service was started on. Microsoft recommends using dedicated mode when you deploy the service.
If this server is not configured properly, you could experience a serious performance hit. We need to figure out the capacity for this server so that it can support the service and how we want to install the service so that it runs within the environment. Here, you can look at the number of users that will be supported and see that, based on the number of users we have, we can determine how Microsoft considers your deployment size. The basic minimum memory for a SharePoint server in a farm is 16 GB. We want to make sure that the size of the server is correct so that we do not have any misconfiguration issues with this service.
If you have less than 10,000 users, then your farm is considered small by Microsoft's standards. If you are running up to 100,000 users, then you are looking at a medium-sized farm. Large farms contain up to 500,000 users. You should look at how much RAM should be configured for your service based on size. 1 GB would be plenty for a small farm, 2.5 GB would be great for a medium-sized farm, and 12 GB would be fine for a large farm.
In a small farm, you have the option to use a dedicated server or collocated server configuration. Medium-sized farms would be best run using a dedicated, but for large farms, you would need to have two cache hosts per farm. When running Distributed Cache service in a collocated configuration, you cannot run Search Services, Excel Services (2013), or Project Server Services on the same server.
Configuring Distributed Cache service is easy, but you really need to understand how to configure the service. To configure the service with any type of command in order to, for example, change the memory allocation, you would need to stop the service first to complete the changes and then start the service again.
From my experience, the best configuration for performance is to use dedicated server mode to run the Distributed Cache service. This takes on the burden of processing the web frontends and is recommended. You can run in collocated mode if you want to, but again, there are some services that cannot be run from that server when you're using that method.
To find out more, please go to https://docs.microsoft.com/en-us/sharepoint/administration/manage-the-distributed-cache-service.
Request Management Service
I have not seen this service used in any farms that I have supported, except when the engineer was trying to use this to route incoming requests. It was failing and was not a good choice for this small farm. This service would be better used in larger farms where there is a need to route traffic. This is because there could be latency if SharePoint were used natively to route traffic.
This service is used to do the following:
- Route good requests to available servers within the farm.
- Deny requests entering a SharePoint farm that may be harmful.
- Optimize performance by configuring rules manually.
As an example, if there was a request coming in for an available web application and your web frontend servers were busy, the service would choose the best performing server at that time to route the traffic to that better performing server. The request manager provides three functional components:
- Request routing
- Request throttling and prioritizing
- Request load balancing
The service also provides manageability, accountability, and capacity planning in order to support specific types of services, such as Search, User Profile, and Office Online Server, which means that SharePoint doesn't determine where the request needs to be routed. This makes routing less complex and the service can locate problems within those servers that may be failing or running slow.
The Request Management Service can also be scaled out as needed so that as an admin creates and implements those routing associations in the servers in the farm, the load balancer can quickly determine and load balance at the network level.
The service can be started within Central Administration or by using PowerShell. You can use the following parameters in PowerShell to change the parameters within the service to change the properties of the request management service:
- RoutingEnabled
- ThrottlingEnabled
- Set-SPRequestManagementSettings
The service can be run in two different modes. The first is in dedicated mode, where the web frontends are dedicated exclusively for managing requests. These servers would be created in their own farm, which would be located between the SharePoint farm and the hardware load balancers.
The service can also run in integrated mode, where all the web frontends run the request manager. All web frontends means all servers, as in APP and WFE. All the web frontends receive requests from the hardware load balancers and then determine where the request needs to be routed.
Using this service takes a lot of planning and configuration. You do not want to use this service on smaller farms but on large farms where you need this type of dedicated service routing. Once the service has been started, it adds information to your content databases. Without the service, this content database will be out of support in a new farm.
I have seen some weird behavior when moving a content database from one farm with request management to another farm without the service. You must be careful where you start because it may impact you once you migrate. We noticed that requests that were made to sites that had site collections from a farm with the service running were trying to route to different web applications, even when we entered the right URL in a new farm without the service.
When I worked on a project where the engineer was using this service, we ran into some issues. I was told by a well-known SharePoint architect to not use this service at all. He said he had not seen it used before and that there was no legitimate rationale for using it right from the get-go. He also said that there had been a lot of bad implementations when using this service, though it is an option you can use for performance if you dare.
To find out more, please go to https://docs.microsoft.com/en-us/SharePoint/security-for-sharepoint-server/configure-request-manager-in-sharepoint-server.
Document size
When determining document sizes that could potentially be used within your environment, note that they affect many areas. One of these areas is performance, which we will talk about in more detail in the next subsection. These documents can also be affected by search settings. I believe lots of people overlook this setting and then notice they are limited by the results they get from the search.
The max document size in SharePoint 2019 Server is 15GB. The setting for Document Size within the Search component, especially when large files are used, such as Word and Excel files, is set out of the box at 64 MB. This setting can be set to a maximum size of 1 GB if needed on both Excel and Word documents. You will capture more metadata on these large files and the search results will produce more relationships for user search results.
This setting can only be completed using PowerShell:
- MaxDownLoadSize
- MaxDownloadSizeExcel
Use these commands to maximize the document's crawl size. This is explained in more detail on the Software Boundaries Microsoft page: https://docs.microsoft.com/en-us/sharepoint/install/software-boundaries-and-limits-0.
Blob Cache
One of the things you should do when planning your farm is look at the file sizes of the documents that you will be supporting within the farm. Meetings with users should have given you some clue of what is being used now and what is being planned. If your users plan to upload large files, first, you need to make sure your network can support it. You do not want to have your users uploading 1 GB files over a 100 MB network.
Blob Cache helps with finding the easiest ways to bring performance to your farm, especially for those farms using large files within your sites. The new maximum for the file upload size for document libraries is 10 GB, while list item attachments can be 50 MB in size maximum in SharePoint On-Premises. Microsoft 365 is 15 GB for files in document libraries and 250 MB for list attachments. By reviewing those size limits, you can see that 10 GB is a pretty large file. Processing those files for a user to view in the browser would be pretty process-intensive and heavily dependent on the user's connectivity to the farm.
Using Blob Cache can help you by providing a separate flat drive space (not a database) to hold all those large files so that when users request them, they are pulled from the drive space and not placed within the content database. The blob storage space is located on SharePoint servers and you need to make sure you have storage to support those files.
When using this method to support those files, we can use a configuration where the content database would hold the site collection, which would then associate all the document's meeting certain criteria for the blob and its size to a link to the image or document that is larger than the limitation we set. Users would request that content using the same user interface, but the content would be rerouted so that it can be rendered from disk from the Blob Cache location.
There are many third-party companies that offer Blob Cache solutions, such as AvePoint. Storsimple is a product from Microsoft that also works with on-premises SharePoint environments. You can find out more about this solution at https://docs.microsoft.com/en-us/azure/storsimple/storsimple-adapter-for-sharepoint.
Microsoft introduced this feature in SharePoint Server 2019 and can be found within the Manage Web Application area of Central Administration: https://thesharepointfarm.com/2019/05/sharepoint-2019-blobcache/.
- Caching and performance planning: https://docs.microsoft.com/en-us/sharepoint/administration/caching-and-performance-planning
- Cache settings configuration for a web application: https://docs.microsoft.com/en-us/sharepoint/administration/cache-settings-configuration-for-a-web-application
Object Cache
As you saw in the installation setup for SharePoint, we have dedicated cache accounts called SuperUser and SuperReader. These accounts support the Object Cache, which stores properties about items in SharePoint Server. You cannot use out of the box accounts because of check in/check out and claims authentication issues that will arise. The service is used as part of the publishing feature and helps reduce the load on SQL servers to improve performance. These accounts must be set up; otherwise, your SharePoint farm can and will come to a complete stop one day with no warning.
Search Services
As part of SharePoint Server, there are services that provide search results based on the content that's been crawled. This product is called Search Services and we talked about it briefly in Chapter 6, Finalizing the Farm – Going Live. Some of this information may be redundant but it's good to recap at this time. To make content available based on certain criteria, a user associates metadata or column information within content that is stored in SharePoint sites. The crawler function within Search Services runs the crawler process and finds all the metadata needed to index that information for users to search and find the results of a search. Be sure to stagger your search crawls across sites so that they finish processing before you move on to the next scheduled site for crawling.
Choosing physical or virtual servers for this service is key as this server can be either. If you have a large amount of data and are planning to expand even more, then you may want to consider using a physical server for this service. Cloning, as we talked about previously, will help in defining the components of Search Services for specific server resources, which creates better support for this service.
Isolating Search Services would be yet another way of helping the performance of a SharePoint farm. This is because this service is very intensive on RAM and CPU. Search Services can take over your server because it requires the resources to crawl through all your content. Remembering to divide the search components into separate servers is key as well since they can be spread out among server resources.
You should isolate these processes either on several servers or a couple of servers. However, most importantly, you should configure these services so that they only run on application servers and not the web frontends where users request access to web applications. The services can be split up, especially when you need redundancy.
If you have more than 10 million items, you must clone your search services, which would make them redundant and boost performance for the service as well. This is the most intense service you have, and it can make or break your farm. The faster you can crawl and gather information, the better the results for your users. I haven't covered a lot on search in this book, but please research further if you wish to make this service stable.
To find out more, please go to https://docs.microsoft.com/en-us/sharepoint/install/software-boundaries-and-limits-0.
Excel Online
As you may have noticed, Excel Services is not listed in our services for the farm anymore. This service has been moved to Office Online Server and is now called Excel Online. This is a nice move on Microsoft's part. This service, especially when used heavily, needs some isolation as it can weigh heavily on the server's resources.
Another thing I used to see all the time is that no one took advantage of the segregation of Excel Services throughout the farm. In some cases where this service is used heavily, you want to use Excel Services in designated locations of a web application or even segregate it to a separate web application, purely for the purpose of big data and reporting. This takes the service out of the most used areas of the farm and isolates it in one web application, which then has its own IIS site and databases associated with content and resources.
The reason I would do the separation at the web application level is due to heavily using the service and/or related services. These could be SSRS or other third-party integrations that may need to have separate processing and relationships to services in SQL and SharePoint. These can be separated by server as well since you can integrate SharePoint with several SQL servers if you like. On the flip side, you only need to run certain web applications on designated web frontends to give some good separation of processes.
Some things to think about when configuring Excel Services are as follows:
- Use trusted file locations to segregate the use of this service within web applications. You must specify HTTP or HTTPS in your URL and the location limits where Excel can be used within your farm.
- The service also controls the location type, which could be a SharePoint Foundation location or other location types such as UNC and HTTP.
- Configuring options so that child libraries and directories are trusted within the trusted file location.
- Session management, for timeout settings and request duration.
- Calculating Excel data mode, which can be done against a file. This can be a manual calculation or automatic, except when this is done on data tables.
- External data connectivity can be allowed or not allowed and can be for libraries only or embedded connections.
- A refresh rate for the data can be set. You have many options here.
If you are looking to use Excel Online heavily, look at some of my recommendations to spread out your processes so that they do not collide a create a performance bottleneck. We will talk more about Excel Online's features and its installation in Chapter 10, SharePoint Advanced Reporting and Features.
InfoPath
If you are still using InfoPath in your farm for users, this brings up another farm service that gets overlooked as a performance bottleneck. There are areas in Central Administration that control these services and are sort of hidden. I believe most admins just keep the default settings and never look at these controls.
The issue I have seen with this service is the settings that are used to support it. I have seen some InfoPath users or developers, especially those new to InfoPath, create forms that are just one-page forms with many form inputs that collect a lot of data. In the real world, you really want to split your form up and make views so that the data settings in the InfoPath service do not have to be made larger for session data.
In some cases, I can see when you may have to do this, but if you are keying in on performance, you really want to limit that data per session from each user. You also want to watch what connections to services you are using as these can slow down forms, especially when you're querying data when the form is open. As an example, interfacing with User Profile Services can help you auto-fill forms, though this can produce issues, depending on how much data you are autoloading. SQL Server databases can also be used to connect to, but then again, you have to look at how much data you are pulling into the form.
Doing this can delay the form from opening due to the service trying to connect to get the data or user you requested, or even connecting to other resources within the domain. These services can be slow sometimes and depending on how many users are using that form at once, this could be a big burden on the farm and server resources.
Depending on how you create your form, getting data through InfoPath processes presents data when the form is opened, such as a user's manager or phone number. This could also be anything that is related to the user profile or even a separate list or database. This process must go out to that data source, gather the required information, and then load it inside the form.
This process can be quick but also a little cumbersome. So, it is better to load as little data as possible so that you do not have to change your settings and put a burden on the server resources. These are just a couple of tips about InfoPath you should think about as we investigate the settings within Central Administration for InfoPath:
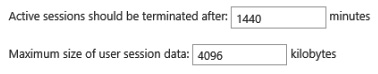
Figure 9.4 – InfoPath session settings
As you can see, there are many things to consider in terms of the performance of SharePoint. SharePoint has not changed a lot, but you do find some diamond new developments within the structure of the 2019 version that really help change how we configure our servers and manage resources within the environment. Building your farm cleverly and using recommendations from Microsoft, along with following the best practices, helps you get to a point where you can have a solid baseline to support your company's goals.
Farm administrative monitoring
When building and administering a SharePoint environment, you will find you are setting up logging and other aspects that help you report issues and problems. Logging, as you saw when we configured SharePoint, was set up to use a separate disk space so that we had room for these logs to grow and ensured they did not affect our operating system's functionality.
I cannot stress enough that you need to move all logs, even if it is a third-party tool you are deploying, to make sure those logs are moved to a separate drive space. Even IIS falls into this category as those logs can grow quickly, depending on the number of users you have. If you are performing a migration, you will see your logs growing dramatically for IIS and ULS.
Now that our logs have been set up, we need to proactively monitor our SharePoint farm. There are different ways to monitor SharePoint. As a starting point, you can use the Central Administration website, which provides health and reporting features for SharePoint. There is also the System Center Management Packs for SharePoint, which provide out-of-the-box monitoring insights for monitoring SharePoint natively.
Then, there is PowerShell, which may take you some time to get set up. However, it is a very powerful way of making sure your farm services and farm is running well. There are also SQL monitoring tools that you can purchase to monitor the tasks that are being processed on this server, but SQL includes an activity monitor that will feed processes in real time:
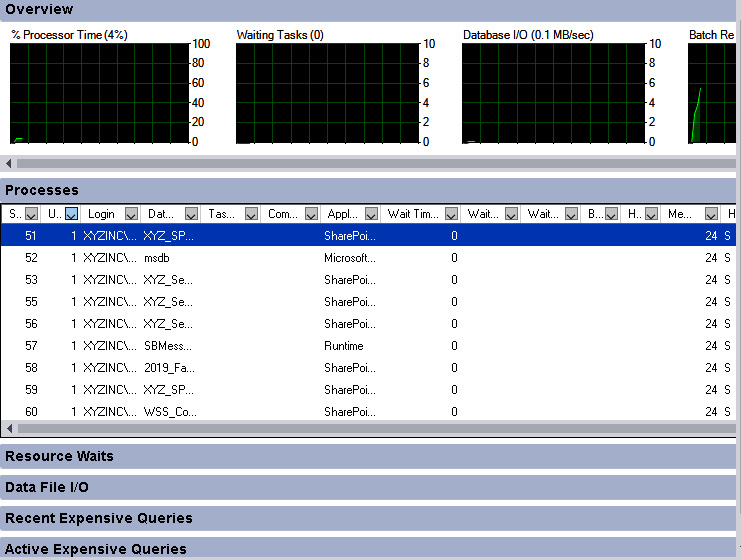
Figure 9.5 – SQL activity monitor
When monitoring SharePoint, there's a host of areas we need to take into consideration:
- The Health Analyzer: How to mitigate issues that have been captured
- Reporting: Using the reports within Central Administration to find solutions to issues
- Performing regular checks to inspect the current state of the environment
- Defining what is important to your business and what to monitor more frequently
The configurations for logging we set up in the installation are native to SharePoint only. SQL Server is also monitored from a configuration standpoint to help you promote a configuration that supports performance and best practices. SharePoint uses databases that capture logging, as well as diagnostics and usage. There are still server components outside of SharePoint that we use to support troubleshooting and to monitor our services. All of the services we use for SharePoint run on the servers we provision, and how we provision them makes a difference in terms of how the farm performs.
In SharePoint 2016 and 2019, MinRoles come into play. They help us manage roles within our environment so that we can support our server resources. This is because MinRoles limit what services can be run on our servers. These preconfigured and dedicated MinRoles can be added to our environment:

Figure 9.6 – Specify Server Role screen
These were covered in Chapter 2, Planning and Architecture. We need to make sure we choose the right MinRole for the server resource. We also have Server Compliance. This is shown in the following figure, which shows the role of the server in the farm. This Central Administration function monitors which services are running on the specific MinRole or server resource. If a server is running a service that is not accounted for by the restrictions within the MinRole, the server will be deemed non-compliant:
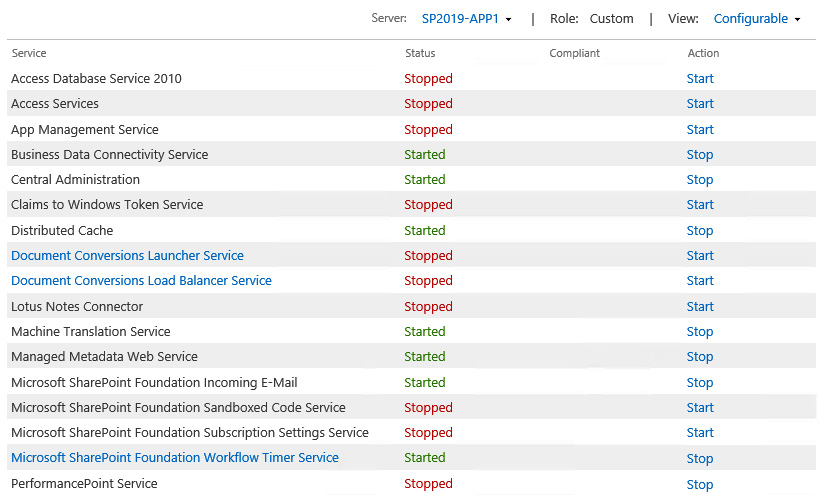
Figure 9.7 – Server compliance
As you can see, there is a column related to compliance. If there was a service that was not compliant on this MinRole, you would see it flagged in this list of services. Note that this MinRole is a custom role, so no service would be flagged for non-compliance. I can change the role by going to the Systems Settings menu and clicking on Convert Server Role in this Farm:
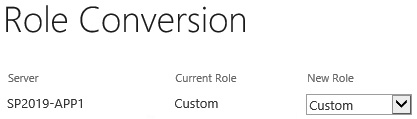
Figure 9.8 – Role Conversion screen
Diagnostic Logging is a log that collects data that is used to troubleshoot SharePoint farm environments. When you set up logging, you will see there are various ways to capture data. These will be provided in a drop-down list. You can select from a list for the least critical events to monitor in the event log and do the same for the trace log. There are also categories you can select from where there's a list of areas you can choose to report on. Since we configured our logging in Chapter 4, Installation Concepts, we will give some background on logging here, as well as what to look for in SharePoint that can help with performance and troubleshooting:

Figure 9.9 – Log location definitions for ULS logs
When using diagnostics for monitoring, you can select the level of logging you want to perform. If you are performing well and not making any significant changes to the environment, you will want to keep it at a default level, where we are capturing minimal information about the farm and its state. If you are making changes or seeing issues, then you will want to find out detailed information. Here, you would change that setting to Verbose, which will create more information in your log. The size of your log will be larger due to those intimate details being captured based on that change.
Some of the best practices for diagnostic logging have been mentioned in this book, but here is a short list to help you remember:
- Update the drive location where the logs are being captured.
- Restrict the trace log disk space's usage (set a quota).
- Back up the logs regularly as part of your server backup.
- Enable event log flooding protection (limits repeating events in the event log).
- Only use the Verbose setting when troubleshooting (more logs will be created and there will be storage issues).
The levels you can set within the diagnostic logging feature limits the types and amounts of information that will be gathered within each log. The level settings for each log are available here:
Event Log Levels:
- None: No trace logs are gathered based on this selection.
- Critical: This type of information gathering is related to serious errors caused by a major failure.
- Error: These messages are gathered based on an urgent condition.
- Warning: These messages are gathered based on a potential problem that requires immediate attention.
- Information: These messages do not require attention as they are only informational messages.
- Verbose: These messages only capture lengthy messages.
Trace Log Levels:
- None: No trace logs are gathered based on this selection.
- Unexpected: These messages gather only unexpected, assert, and critical message levels.
- Monitorable: These messages gather information that limits functionality but does not stop the application.
- High: These messages combine all the methods that are gathered at the Unexpected and Monitorable levels.
- Medium: These messages combine all the messages that are gathered, except for at the Verbose and VerboseEx levels.
- Verbose: These messages combine Medium messages and include most actions. Verbose tracing can contain a vast amount of log messages.
- VerboseEx: You can only set this level using the PowerShell Set-SPLoglevel command. Microsoft recommends that this level is only used in a development environment. The messages that are gathered here include all trace log levels.
Usage and Health Data Collection is a logging method based on how SharePoint is used from an overall perspective. The information that's gathered here is assembled into a database and placed in the logging folder on the server. This data is used to create the health and administrative reports that are shown on the Central Administration Monitoring page. This includes search usage and performance counter data:
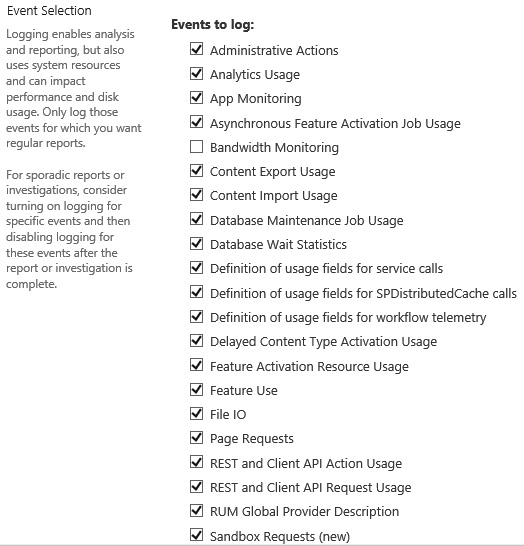
Figure 9.10 – Central Administration Monitoring page
Usage and Health Data Collection features include health and other services, such as SQL Server, all of which rely on timer jobs. These timer jobs are run on schedules that are controlled within Central Administration. These timer jobs monitor tasks and collect data specific to the timer job's relationship to services. These time jobs schedule how frequently these jobs should be run and how frequently services should be started based on their needs. The SharePoint Timer Service is a service that runs on the operating system and is part of every server in the farm.
You can change the settings for these jobs so that they run more frequently or less frequently. Disabling jobs is only recommended if you really understand what that time job is being used for. In some cases, time jobs are not needed, and we do disable them. As an example, Dead Site Deletion may be disabled because you may not want SharePoint to automatically delete sites. If a site is not being used, this timer job would automatically try to delete the site. It will send you a notification to ask you if the site is still being used. You may not want this type of automatic service on your farm, so you would disable this timer job.
It is also important to run Health Analysis jobs after maintenance so that you can see the effects is has on your health report. The Health Analysis rules verify and update health collections so that if anything is not a best practice, it will post that to the health report page, which is called Review Problems and Solutions. By doing this, you can get the status of the environment and clean up any loose ends.
As part of timer Job management, you can do the following from Central Administration:
- View and modify timer job schedules
- Immediately run a timer job
- Disable and enable timer jobs
- View the status of a timer job
- Find what time job has an association with what web application
- View a timer job's history
Always remember to run PSConfig after maintenance to make sure your farm is configured cohesively and successfully. Do not just run the minimum PSConfig command; instead, run the full command so that the configuration is fully updated; for example:
PSConfig.exe -cmd upgrade -inplace b2b -wait -cmd applicationcontent -install -cmd installfeatures -cmd secureresources -cmd services –install
PSConfig finalizes the configurations for the servers and databases, which then get updated. You may see changes in the GUI of Central Administration in some cases or even sites. Next, we will look at monitoring in Central Administration and how that helps us manage the farm proactively.
Monitoring in Central Administration
Health Analyzer within Central Administration is used to view and resolve issues within the farm. Again, Health Analyzer is updated after health timer jobs have been run to trigger the statuses of services within the farm's environment. The rules associated with the timer jobs are located within Central Administration | Monitoring and can be edited. These health rules create alerts and give you information about the rule that was run so that you can fix the issue:

Figure 9.11 – Health Analyzer
There are specific categories a health rule can fall into, and these categories cannot be changed. You can, however, edit some areas of the rules:
- Title of the rule
- Schedule the rule runs on: Hourly, Daily, Weekly, Monthly, or OnDemandOnly
- Enable or disable the rule
- Enable Repair Automatically
- Change the version of the rule
- Receive alerts about the rule once it has been run
You can also change the way the rules are viewed and add more information using a custom view. You can also export this list to Excel or use the RSS Feed for the list. There is also an Analyze Now button in those rules that can be corrected through the Health Analyzer. Not all are successful all the time and they may require some manual intervention. The big thing is that Health Analyzer can help identify potential issues.
Monitoring as a Site Collection Admin
Site Collection Administrators are really the key to creating a cohesive environment and supporting the users in that community or department. As a Farm Admin, we are outside of the user community and cannot possibly know everything users are working on in real time or even any time. I often wonder how large organizations go without these roles and expect Farm Admins to know all and be all to everyone. This is especially true for small SharePoint support shops where you have one person supporting 10,000 – 100,000 users, normal administration duties, updates, and mandates from management.
As a site collection admin, this takes all the guesswork from the farm administrator and makes the load lighter. Again, as stated in Chapter 2, Planning and Architecture, you need to make sure you provide site collection administrators to your user community. This can be a side job for one person and strictly the only job for that person. In a perfect world, these teams would meet and find out how to best solve problems for the users in that community or collectively with other farm admins and site collection admins.
As part of a site collection administrator's duties, they should be monitoring how the tools are used within the Site Collection admin page, under Site settings. These tools give them reporting capabilities for storage and other insights needed to manage the site collection. Storage reports in a site collection will give the administrator the total storage being used in the site collection and break out each subsite, thus giving totals for these areas as well. This way, you will know where most of your content is being kept within the site collection.
As a site collection administrator, there are best practices that you need to follow. These play into how the site collection is managed:
- Keep your content under 200 GB unless you're told otherwise by your Farm Administrator.
- Split subsites across site collections when needed to load balance your storage.
- Organize your subsites across site collections using department or project names.
- Do not turn on features you do not need in your site collection.
- Always uninstall third-party features you do not use or have been abandoned.
- Tag content and come up with metadata that makes sense to describe the content.
- Use Active Directory groups within the security model for your site collection.
These are just a few things site collection administrators can do to support their sites based on best practices. This team really helps Farm Admins do their jobs more efficiently and helps mitigate issues within the environment that are site-related. If a farm admin is administering a farm with over 2,500 sites, you do not want them managing the user community as well. Site Collection admins are a plus in this scenario and a recommendation.
SQL Server performance
Tuning SQL Server has a big bearing on how SharePoint will run as an application. This is the backbone of SharePoint and stores all data for the farm. There are outside configurations that help here, such as blob storage, which we talked about earlier in this section. The easiest way to gain performance on your databases is to follow these recommendations:
- Database maintenance
- Dual NICs to minimize traffic
- Isolate Search Indexing
When creating a maintenance plan, one of the key responsibilities is to make sure you have enough disk space to hold backups of the content you are managing in the SharePoint farm. If you do not have enough space, you will not be able to hold backups for all your databases. You also want to use cheap storage for this location, depending on the size of your content and services. If you have a large amount of data, then you may want to use faster writing disks.
When looking at the size of our databases, what could cause the database to grow? What processes would start making our databases get larger? Well, the answer to that question can have many credible sources. Let's look at some:
- SharePoint migrations can cause databases to grow quickly.
- Users adding content can cause fast growth, depending on the users.
- Moving site collections can cause growth in content size.
- User activity can cause growth in the log file.
I have managed small and large farms where I had up to 3,000 site collections. When you look at space, you may need the same amount of content you have at the moment, or double or triple, depending on how much data you want to retain for direct access if something was to go wrong.
When creating a maintenance plan, the options we must run against our database to keep them healthy are to shrink the databases to clean up any unallocated space. This helps keep the databases at their current size when site collections or many documents are deleted. Indexes can then get fragmented, which then can cause performance issues. We can handle those fragmented indexes by scheduling index defragmentation as part of our maintenance plan.
You can create the steps in a maintenance plan and then clean up to delete old backups. This ensures that your drive space is free from old data that may have already been moved to offsite storage. Make sure to keep backups off your C drive where the OS is located. I have often seen times when SQL was implemented with one huge drive. Lots of things can happen in that configuration.
Another way to help with performance is to create separate service user and database traffic. Web frontends and SQL could be routed through one NIC card, while the other NIC card can be used for user traffic. This separates the traffic so that those networks are dedicated to supporting the processes in separate environments. This could be a VLAN or even a physical network.
Choosing a physical or virtual server for the SQL database server would be another way of boosting performance. Physical servers run with better performance and do not have any contention on other VMs or HOST server processes that may be running on the same server.
Troubleshooting
Troubleshooting SharePoint is a task you will fail at many times, but the good news is that there are others who have experienced the same frustration. It is such a big platform and it touches on so many other applications and systems within the enterprise that it takes dedication to support this platform. You must really understand SharePoint under the hood to take the right steps in fixing issues. As you may have noticed, we keep harping on about best practices. If you can keep those in mind as you go through the implementation, you will be able to configure a stable farm.
This section will be light due to the vast arena of issues we could come across and because this could be a whole other book in itself. If you wish to understand troubleshooting in SharePoint, we recommend the book Troubleshooting SharePoint by Stacy Simpkins. It goes through many scenarios to show you how to deeply analyze SharePoint issues. It also provides tips on how to figure out common issues within SharePoint.
So, let's start this section by providing a list of areas you should check when you're monitoring your server daily. Performing daily checks and even consistent checks throughout the day, if you're not using a monitoring tool, is recommended. SharePoint can change at any moment, even when you think things are OK. Just make sure you look at these areas on each server and SQL Server at least once a day to verify you have a good standing of the farm, especially after changes and updates have been made:
- Health Analyzer
- Windows Event Logs
- Windows Application Logs
- Task Manager
- Task Manager – Performance
- Scan a recent diagnostic log
- View Administrative Reports
Finding the issue is the tough part of working with and administrating SharePoint. In some cases, these issues are easy, but in others, you will find yourself surfing the net finding information about what others have done to fix the issue. In SharePoint 2003 and 2007, this type of information was not available because the SharePoint products did not take off immediately until MOSS and once that happened, Microsoft had to catch up and post information. In those days, there were not a lot of blogs and support there to help you. You had to work through the issues and fix them yourself.
Now, there is a lot of readily available information and you have many resources to choose from. However, be aware that some of the issues that were fixed may not have been fixed properly in Blog Posts. The first thing you must do is test the scripts you see in posts and alter them as needed. Test the script in a lower-level environment first to see the effects of the script. Do not trust every blog you see that contains scripts and other fixes that, in your gut, do not seem to be correct. Beware of posts that go against best practices and others that may ask you to run a script to update or change a database.
We mentioned some great tools in the previous chapter but did not really dive into how they are used. We will show you the real-world scenarios of how we found the answers to solving issues within the farm. The following tools can help you troubleshoot issues in SharePoint:
- Fiddler: Client-side logging software used to capture events with clients connecting to SharePoint
- Process Monitor: Logs all processes running on the server and what the process is processing
- Network Monitor: Logs all the network activity of the resource
- ULS Viewer: Gathers information from the ULS logs and color codes information that may be critical
- PowerShell: Can be used to help manage the ULS files by merging logs, starting a new log, setting the log level, clearing log levels that have been changed for VerboseEx, and so on
When troubleshooting the first area, I always check the Windows event logs, either on the client or the server. Most of the time, you will find the issue or a related issue in these logs right away. Sometimes, it can be hidden among many entries, so you must be thorough in your search. If it's a sporadic issue, you will see that it could be one line in hundreds of entries, so sometimes, it's best to recreate the issue and log the first time to see if anything comes up in the Windows logs while using the other tools mentioned as well.
When capturing logs, you want to set your ULS log level to VerboseEx. The first thing you must do before starting VerboseEx is check your drive space. Depending on the size of your farm, you can generate some big logs if you are not careful. Therefore, we have other commands to help us manage these logs instantly.
So, let's say we have an issue we are about to recreate. The first thing we must do is set the log level to VerboseEx, as shown here:
Set-SPLogLevel -TraceServerity verboseex
This will help us capture everything SharePoint spits out so that we can gather details about anything happening within the environment. Once we start the log at that level, we must immediately recreate our issue. The reason we must recreate the issue is that we want our log to be as small as possible when capturing information about the error. So, let's perform a quick recreation and then start a new log:
New-SPLogFile
Now, you will need to clear the log level, which means setting the log level back to the default and not capturing verbose logging anymore:
Clear-SPLogLevel
If you are unsure of what server the error is happening on due to it being a service or something you just don't understand, then you can also merge the logs to find errors for the same period of time:
Merge-SPLogFile -Path "D:OutputSSRSService.log" -Overwrite -StartTime "06/09/2008 16:00" -EndTime "06/09/2008 16:15"
Always remember to put all the output from PowerShell and other growing files (logs) on your D drive or a drive that is always separate from the C or OS location. We do not want to fill up our C drive with this type of information – especially growing files that can fill up drive space quickly and stop the server from running. I have seen many horror stories just on this simple use of drive space.
We could really go into a lot of areas here while going through all the methods and applications we could use to troubleshoot issues, but I believe the best use of your time would be to look at some of the scenarios I have come across in my career and give you those fixes. So, in the next section, we will go through some of the issues I have encountered in the past and tell you how to get past them.
Scenarios and fixes
As part of this book, I wanted to go through some scenarios I have encountered to help you discover how to use the tools mentioned previously. In these scenarios, there will be many different types of issues. This will help you understand what tools can be used to figure out fixes quickly.
Let's go over some scenarios.
User desktop issues during migration
Scenario:
You migrate users so that they can use content from one SharePoint farm (or service) in a new SharePoint farm (or Service) using the same URL and SSL certificates. This could be from servers in one cloud service to servers in another cloud service as well.
Behavior:
Users will see issues when connecting to the site where the site will be blank, never connect, won't come up, and/or spin like it is trying to connect but can't. You may even encounter broken user interface issues, such as the page not loading fully.
Fix:
Clearing the cache on the client machine is the answer to this issue. Clear everything in the browser cache in IE since this seems to be the most vulnerable cache in this scenario. Google Chrome and Firefox seem to work well in most cases, but you may have one or two users who need to do the same in those browsers as well.
You also want to clear your machine cache and profile cache. Some information may be stored that could be corrupted as well. Then, if all else fails, clear your SSL cache in the browser. This seems to resolve the issue for those with stubborn desktop configurations.
Please follow these instructions:
Note
If you are not an admin on your computer, please contact an admin so that they can do this for you.
- Clear all browser caches completely (if you're using Chrome, make sure you choose all the caches and not just the last 24 hours).
- In Windows 10, open Internet Explorer.
- Click on the gear icon (tools) and click on Internet Options.
- Click on the General tab.
- In Browsing History, do the following:
Then, follow these steps to clear the computer's cache:
- Open My Computer.
- Click the address bar and paste in %USERPROFILE%AppDataLocalMicrosoftWebsiteCache.
- Delete everything within this location.
- Click the address bar and paste in %APPDATA%MicrosoftWeb Server ExtensionsCache.
- Delete everything in this location.
- Then, from the command line, run ipconfig /flushdns.
- Reboot your computer.
Site collection issues after migration
Scenario:
You are in the process of performing a database attach migration from an old farm to a new farm, but users seem to be having issues connecting to the site or rendering the site clearly.
Behavior:
The user sees garbage where the site is not easy to navigate and broken images and links are all over the page. They also may have issues connecting to the site.
Fix:
Remove the content database in Central Administration and reset the IIS or reboot the servers in the farm. Reattach the content database to the web application using the GUI or PowerShell. You can also run Repair-SPContentDatbase as this resolves some issues once you've migrated over content from another site. These steps have helped me clear issues where the content database seems to not be fully engaged or seems to cause trouble in terms of stability.
Content database migration errors
Scenario:
When creating your farm and adding content databases to a web application, you get an error message stating that the ID of the database is already in use.
Behavior:
When using PowerShell to mount the content database or the GUI within Central Administration, you get an error when you try to add content databases to web applications.
Fix:
Use PowerShell to add the content database to the web application and use a new database ID:
Mount-SPContentDatabase "WSS_Content" -DatabaseServer "DBSERVERNAME or ALIAS" -WebApplication "https://WebApplication/" -AssignNewDatabaseId
SharePoint designer connectivity issues
Scenario:
As a site collection admin, you may see errors like this when you have transitioned to a new SharePoint farm using SharePoint Designer to create workflows and other content:
Figure 9.12 – SharePoint Designer connection error
The following is another error example:
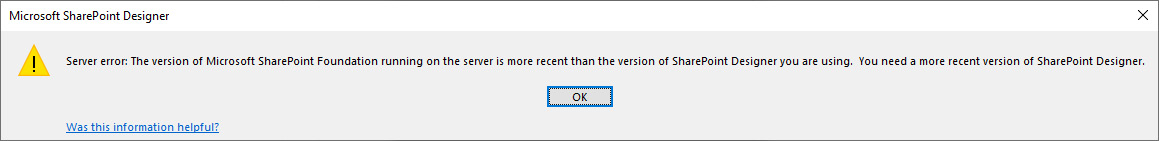
Figure 9.13 – SharePoint Designer – possible connection error
Behavior:
You cannot connect to any sites. Individual sites could be a problem here as well. You may be able to open the site, but no content is displayed in Designer. There could be content but workflows, and lists may be missing. There are many issues that can be caused by a corrupted SharePoint Designer installation.
Fix:
Uninstalling and reinstalling the application is the first test you should do to see if there is just something wrong with the application. If this doesn't work, then you should delete all SharePoint Designer caches. You can do this by following these steps:
- Open My Computer.
- Click the address bar and paste in %USERPROFILE%AppDataLocalMicrosoftWebsiteCache.
- Delete everything within this location.
- Click the address bar and paste in %APPDATA%MicrosoftWeb Server ExtensionsCache.
- Delete everything in this location.
- Then, from the command line, run ipconfig /flushdns.
- Reboot your computer.
Moving site collections
Scenario:
During your migration planning, you've noticed that you have some site collections that are very small and some that are very large in the same content database. You want to consolidate those sites that are smaller into a different content database so that they can grow, and also relieve the space that's been taken up so that the larger site collection has room to grow in the current database.
Behavior:
When you're performing a migration, the worst thing you can come across is several small site collections and some medium-sized site collections in one huge content database where there is one site that is over 100 GB.
Fix:
Migrate the small- and medium-sized databases to other content databases to change the current content database from being very large to being large. This means that small-to medium-sized site collections could total 100 GB themselves; having another very large site collection at 100 GB or more in size makes no sense to move altogether. Breaking these site collections up gives you a faster migration time when moving a database from one server to another or even one service to another. This also helps with scheduling.
To move your site collections, create a new content database using Central Administration (make sure you document your moves during this process). Move the select site collections to one or many new content databases to ensure they can be moved quickly and easily:
Move-SPSite http://webapp/sites -DestinationDatabase NewContentDb
Temp path update for Search
Scenario:
You are getting errors in your Windows logs and you have also noticed your C drive is full on the index server.
Behavior:
After creating and running a search crawl, you notice that the server runs out of disk space. After doing some research, you notice that the location of the growing information is from the Search Temp area, which is located on the C drive. This happened to me after one of my colleagues installed it using AutoSPInstaller.
Fix:
Change the location of the Temp space after installing it by changing the registry settings for these locations. In the beginning, when you created the farm, the installation process provided a screen that many do not pay attention to:

Figure 9.14 – Installation configuration screen for SharePoint
Notice that the second entry is for search index files. This is how we set our location for the search index and Temp space for the crawler. If you choose the default option, it will locate everything on the C drive. However, when you set up your search service, you can change the index location but not the Temp space for the crawler. To update the Temp space, we need to do the following using the registry:
HKLM:SoftwareMicrosoftOffice Server16.0SearchGlobalGathering Manager
Update the registry with the new location for the Gathering Manager and reboot your machine. You will see that information will gather in the new path and that the OS drive will be free from clutter and growing index files.
CName versus A records
Scenario:
During the migration process, you've noticed that, when migrating an on-premises farm from one cloud service to another, some DNS records in the source farm for web applications and Host Named Site Collections are using CName records.
Behavior:
When you try to move a Host Named Site Collection, you notice that it's dependent on another site and is not an A record in DNS. This could be happening because the Host Named Site Collection (https://xyz.example.com) CName record is configured to relate to https://xyzroot.example.com in the source domain.
Fix:
All Host Named Site Collections in the new cloud service should be created with A records that have no association to the root-level web application. This breaks the dependency on the site having to have that site available to support the site being available on the new network. If that root site is not available, the site will not work using CName records in DNS.
Changing the names of databases
Scenario:
You didn't use a naming convention in your source farm and when migrating, you want to change the names of the content databases before adding them to the farm.
Behavior:
Naming conventions are good when you're using databases that support SharePoint. You see where someone could make a mistake by deleting a database by the way it was named. I have seen names such as Temporary Database, Restore_12-11-2015, which was a live database, WSS_Content_Test, which was a live database in production, and a host of other names that were deceiving when I read them.
Fix:
Before restoring any database, come up with a naming convention. When you have your naming convention, restore the database from a backup and in the properties, put in the correct name you would like for the database. Once you've restored the database, all MDF and LDF files will be named with the name you specified.
For MDF and LDF updates, if you are moving files from one server to another (which I do not like to do because if the file gets corrupted, you have nothing to fall back on), you would just rename both files with the name you want and attach them to the new server.
If the content database is already attached to the farm and you need to update the name, just disconnect it from the SharePoint farm (make sure you find out the location of the MDF and LDF before detaching them), detach the database from SQL Server, rename the MDF and LDF files, and then reattach the database to SQL Server. Once you've done that, you can right-click and rename the database to what you named the MDF and LDF files, unless you want someone to be confused.
HTTP authentication error when using a 2013 SPD workflow
Scenario:
A user's site has been migrated to the new farm and all checks have been made to ensure the site is working correctly. The site collection admin has republished all workflows as needed and has run checks to verify the workflows are working. A user goes to invoke a 2013 workflow on a document in a library and the workflow suspends.
Behavior:
When certain users try to use a 2013 workflow in a site, they get an error stating that there's been an HTTP authentication error.
Fix:
This error occurs due to the user who created the workflow not having a SharePoint user profile or the user who is invoking the workflow does not have a user profile. Please check that the user has a valid profile and, most importantly, that they have a work email address in the profile.
I've had several users who had profiles from the Active Directory (AD) domain and from a third-party cloud authentication solution in their user profiles. The problem was that none of the AD domain accounts had email addresses associated with the profiles, only the third-party solution. So, the user was creating workflows and using workflows that were created by the AD domain profile that had no email addresses. None of the workflows would work consistently. In the end, all the caches, including the SSL and SharePoint Designer caches, had to be deleted for this user to authenticate correctly.
This also presents an issue when users log in to their device using an AD account and when using a federated account to log in to SharePoint. Sometimes, the system gets confused. I have seen situations where a user has created workflows using their Active Directory account and have workflows with the federated account listed in the workflow view of SharePoint Designer.
Updating database permissions
Scenario:
After performing a content database migration, some SharePoint services fail on some sites.
Behavior:
Logins fail on certain content databases due to the service accounts' inability to access the content database.
Fix:
Make sure you go back and add the service accounts to the content databases that you added to a new farm due for migration purposes. You will see that when you update them to a web application, only the app pool account will be associated with the database.
To add the service application accounts, farm account, and any other account that would need access to the content database, there is some work that's required. Document the database's security before migration and duplicate it with the new service account names.
Also, remember to delete any other accounts that may have been used in the old farm that are not being used any more. We keep them in place while migrating but once the new security has been applied, we can remove those user accounts as part of the cleanup process.
SMTP mail issues
Scenario:
Users are complaining that mail from all alerts is working and that when they're sending emails within workflows, the emails never get delivered to the users.
Behavior:
The user sets an alert on a library or list and the alert is captured; then, a confirmation email is sent successfully. However, when they add anything to the library, no email is sent to let them know that content was added as part of the alert. This is the same behavior but with a workflow. When a workflow is processed on a document, no email is sent, as defined in the workflow, to the User.
Fix:
Verify that your port is open on the server, as well as your outgoing mail configuration in SharePoint. Then, verify that your outgoing mail works correctly using PowerShell:
$site = New-Object Microsoft.SharePoint.SpSite("https://sitename")
$web = $site.OpenWeb()
$mail = [Microsoft.Sharepoint.Utilities.SpUtility]::SendEmail($web,0,0,"[email protected]","Testing from PowerShell", "This is a test from PowerShell and server APP1")
In my case, the SMTP mail was working. All ports were working correctly, even with a custom port, 587. All was working well but no emails were getting to the users from any workflow, even though Alerts were working. I was scratching my head because I did not understand what was happening.
So, I started investigating further and noticed that there were some changes to the server. Upon accessing Control Panel and Uninstall Software, I noticed that three applications had been installed over the weekend. My users noticed the change in the delivery of mail over the weekend and Monday morning more so.
So, I screenshotted the applications that were installed and used Process Monitor to log processes on the Central Administration server, where outgoing mail is processed. In doing so, I noticed that one of the new applications was blocking all SMTP traffic. I uninstalled the application and voila – the SMTP mail started being delivered again. I also notified the security team to make them aware that this was the cause of my issue. Coordination between teams is very important so that everyone is aware of changes.
Site collection location
Scenario:
You are in the process of migrating content from one site to another farm. You need to understand what site collections are available in each content database so that you can come up with a plan to migrate those sites and let the users of the site know prior to the migration date.
Behavior:
Not all site collections are easy to find through the GUI of Central Administration. Yes, we can go there and find the site, which would give us the information we need, but in this case, we want to find out where the sites are so that we can plan, move sites around if needed, and know the sizes and other information about the site.
Fix:
Use PowerShell to find out information about on-site collections before migration. Have a list of sites, sizes, and content database locations so that you know how large the database is beforehand. This will help you plan and understand the time frames needed to move content from one farm to another farm or one server to another server.
Again, to move a site collection in order to groom the content database of unwanted or smaller site collections, use the move-spsite command:
Move-SPSite http://webapp/sites -DestinationDatabase NewContentDb
When you want to create a migration plan, we need to know more information. PowerShell comes in handy when you want to know how big the site collection is, as well as the content database's total size.
User migrations to a new domain
Scenario:
You are in the process of migrating and you notice some of the user accounts are failing to log in.
Behavior:
Users will fail to log in to the new site locations within the new farm because they do not have access to the sites.
Fix:
Use the PowerShell Move-SP-User command to move the account from one domain to the new domain. This will give the user rights to access the server. Most of the time, I have found that this is due to the account not migrating properly to the new domain.
$user = Get-SPUser -Identity "DOMAINJaneDoe" -Web https://webUrl
Move-SPUser -Identity $user -NewAlias "DomainJaneSmith" -IgnoreSid
That's it in terms of scenarios and fixes. Now, we will conclude this chapter.
Summary
Performance is one of the most important things you can implement as part of your SharePoint farm and environment. Without it, you will hear from your user community. I have done my best to provide as much information as possible within the confines of this book. Make sure to follow the guidelines we set here and always look at how you can tune your environment based on the ups and downs of concurrent users and services, which could peak at a certain time of the day.
Monitor your environment daily and understand how it is performing. You should also pay attention when tickets for issues come in. This can tell you a lot about your farm and when it has the worst performance. Home in on those time frames and see what is going on; for example, you could have peaked on CPU or memory. Investigating issues like these is crucial to getting in front of problems instead of waiting for them to happen.
Troubleshoot issues with the tools listed in this chapter and make sure to look at obvious locations first before gathering logs and searching through them. Following best practices during configuration saves you from having issues in the first place, so the more you do in the beginning, the less you have to fix in the backend.
If you have delivered the environment and are still having issues, this is the worst situation you can be in. Make sure to test and know your services work before you deliver them. Another thing to watch for is coming behind someone else's work. If someone else set up the farm, make sure to follow along or review all their configurations before delivering the farm. You can get yourself in trouble if you do not because if just one service doesn't work, everyone will be looking at you, not the technician that left after they did the installation.
In the next chapter, we will review reporting and the other features and integrations that are available to support it. We'll also talk about what cloud services are available for reporting via hybrid connectivity.
Questions
You can find the answers on GitHub under Assessments at https://github.com/PacktPublishing/Implementing-Microsoft-SharePoint-2019/blob/master/Assessments.docx
- When you're planning for performance, what are some areas you can key in on that support physical or virtual servers?
- What can be a key issue when a user connects to the company VPN?
- Developers can contribute to performance issues. What tool can they use to help mitigate issues with memory leaks?
- What is the name of the tool that's used to onboard users using a recorded script and receive performance reports before we can go live?
- Which SharePoint service supports OneNote client access?
- When large files are kept outside of the content database, what caching solution should you use?
- If my application pool is slow to respond every morning, how can I keep the application pool live?
- What are some specific disk types we can use to support the physical performance of our physical server configuration?