CHAPTER 4
ANALYZING PARADATA TO INVESTIGATE MEASUREMENT ERROR
4.1 INTRODUCTION
Paradata for purposes of investigating and understanding measurement error include response times, keystrokes, mouse clicks, behavior codes, vocal characteristics, and interviewer evaluations. Description and collection of these paradata is examined extensively in Chapter 3. In this chapter, we focus on the analysis of these types of paradata.
We begin this chapter with a brief review of empirical literature using paradata to investigate measurement error in Section 4.2. Section 4.3 describes the specific analytic steps taken and issues to be considered when analyzing paradata for the purpose of examining measurement error. Examples taken from published research work are provided in Section 4.4 to illustrate how one type of paradata—response times—has been used to answer various research questions on measurement error. Section 4.5 calls the reader’s attention to issues related to the measurement error in paradata themselves and other general issues involved in analyzing paradata. We wrap up this chapter by offering, in Section 4.6, take home points for researchers, survey practitioners, supervisors, and interviewers.
4.2 REVIEW OF EMPIRICAL LITERATURE ON THE USE OF PARADATA FOR MEASUREMENT ERROR INVESTIGATION
Measurement error refers to the difference between an answer to a survey question reported by a respondent and the true value on that question for that particular respondent (Groves, 1989; Biemer and Lyberg, 2003). Unless the true value is known and available, the exact magnitude of measurement error for a respondent on a particular item remains unmeasurable. As a substitute, survey researchers look for respondent and interviewer behaviors and response characteristics hypothesized to be highly correlated with measurement error. For instance, linguistic expressions of doubts and/or uncertainty by respondents (e.g., “I don’t know,” “I think,” “maybe”) are found to predict higher rates of inaccurate responses (Dykema et al., 1997; Draisma and Dijkstra, 2004). Even though these expressions are neither causes of inaccuracy nor measurement error themselves, they indicate problems respondents have answering survey questions and potential measurement error in the survey responses. Paradata provide an additional venue for examining these indicators of measurement error (Couper, 1998).
In general, research using paradata to investigate measurement error indicators in surveys falls into one of the three broad categories: (1) understanding the question-answering process, (2) usability issues in computer-assisted interviewing (CAI) systems, and (3) reducing measurement errors. Of course, these three categories are not mutually exclusive, nor are they meant to be, as they share a common goal of understanding—and potentially reducing—measurement error.
4.2.1 Using Paradata to Understand the Question-Answering Process
As mentioned in Chapter 3, measurement error can arise at any stage of the question-answering process (Tourangeau et al., 2000). Respondent behaviors and response characteristics indicative of measurement error include (but not limited to) linguistic expressions of doubt and uncertainty (Dykema et al., 1997; Draisma and Dijkstra, 2004; Schaeffer and Dykema, 2011), nonverbal expressions of doubts and uncertainty (Conrad et al., 2004), paralinguistic and verbal cues (Draisma and Dijkstra, 2004; Conrad et al., 2008); answering too fast (Malhotra, 2008; Callegaro et al., 2009; Kaminska et al., 2010) or answering too slowly (Bassili and Fletcher, 1991; Bassili, 1995, 1996; Fletcher, 2000; Bassili and Krosnick, 2000; Huckfeldt and Sprague, 2000; Heerwegh, 2003), changes of responses (Bassili and Fletcher, 1991; Stern, 2008), and so on. Paradata such as response times, keystrokes, behavior codes, and vocal characteristics are used to measure each of these measurement error indicators.
For instance, research on response time paradata demonstrates that longer questions (in terms of number of words in the question and number of clauses) and more complex questions increase response time, showing that longer response times are an indicator of difficulty that respondents have answering survey questions (Yan and Tourangeau, 2008; Couper and Kreuter, 2013). In addition, respondent’s cognitive capacity (proxied by age and education) is negatively associated with the amount of time it takes him/her to process and answer a survey question; those with lower cognitive capacity (e.g., older respondents and/or respondents with less education) tend to answer more slowly than those with higher cognitive capacity (e.g., younger respondents and/or educated respondents) (Yan and Tourangeau, 2008; Couper and Kreuter, 2013). When respondents go through a questionnaire too quickly, they are more likely to exhibit satisficing response behavior and provide responses of low quality (Malhotra, 2008; Callegaro et al., 2009; Kaminska et al., 2010), (see also Krosnick, 1991, 1999, for definition and examples on satisficing).
Mouse clicks and keystroke paradata have been used to study respondents’ navigation through a long list of response options (Heerwegh, 2002; Tourangeau et al., 2004), whether respondents backup to change answers (Heerwegh, 2002, 2003); how respondents use drop-down boxes versus radio buttons (Heerwegh, 2002; Healey, 2007), how respondents change answers given different versions of scalar questions (Stern, 2008), the answer process for mark-all-that-apply versus force-choice questions (Smyth et al., 2006; Stern, 2008), and respondents’ use or non-use of clarification features on the web screen (Conrad et al., 2006). These issues reflect both usability issues with a web survey (see Section 4.2.2) and potential causes of measurement error in web surveys.
Behavior codes have also been used to study the question-answering process. Question characteristics, interviewer characteristics, and respondent characteristics all affect the respondent’s question-answering process. These effects may manifest in both interviewer and respondent behaviors during an interview. For example, respondent behaviors that indicate ‘uncertainty’ are consistently associated with measurement error (Schaeffer and Dykema, 2011, p. 28) whereas misreading of questions by interviewers is inconsistently related to measurement error (Schaeffer and Dykema, 2011, p. 27). As there are too many variations on behavior coding schemes to report completely here (see Ongena and Dijkstra, 2006, for a review), interested readers are referred to recent reviews of the relationship between behavior coding and measurement errors by Schaeffer and Dykema (2011) and Fowler (2011).
4.2.2 Using Paradata to Investigate Usability Issues in CAI Systems
This line of research draws heavily on keystrokes (also known as audit trail files) to study usability issues and interactions with CAI instruments by respondents and interviewers. CAI instruments generate a record of all keys being pressed as interviewers or respondents move through the instrument. A keystroke file then can be used to restore how interviewers/respondents interact with the instrument as they move through it. For example, Caspar and Couper (1997) found that two-thirds of respondents used a special key for editing purposes for at least once and that young respondents had a higher use of these special keys than older respondents. They also demonstrated that respondents had no trouble keying verbatim responses for open-ended questions. In a similar vein, Couper et al. (1994) analyzed interviewers’ use of various function keys, identifying outlying interviewer behaviors and questions that trigger heavy use of a certain function key (also see Hansen et al., 1997; Couper et al., 1997a, b; Couper and Schlegel, 1998; Lepkowski et al., 1998; Couper, 2000; Mockovak and Powers, 2008).
4.2.3 Reduction of Measurement Error
Reduction of measurement error involves using paradata to improve survey questions and to improve the data collection process. Various types of paradata such as question timings, keystroke files and audio recordings can provide an indication of respondent difficulty in answering survey questions. A typical example of using paradata to pretest and improve survey questions is shown by Bassili (1996), who took longer response time as a signal of potential problems with survey questions, as an indicator of respondent uncertainty, and even as an indicator of response error (see also Bassili, 1996; Draisma and Dijkstra, 2004; Lenzner et al., 2010).
Paradata can also be used during data collection to improve the survey response process. For instance, Conrad and colleagues used response times to identify those respondents taking too long to answer survey questions and allowed the system to provide them with clarifications. They found that that response quality was improved for these respondents (Conrad et al., 2007). In another study, Conrad et al. (2011) identified respondents who answered too quickly based on response time data, showing a prompting message to them; they found that those responsive to the prompting slowed down on later questions and had fewer straightlining responses to grid questions.
4.2.4 Adjusting for Measurement Error
The use of paradata to adjust for measurement error lags behind that of paradata for nonresponse adjustment (Couper, 2009; Lynn and Nicolaas, 2010). At the time of this writing, we are not aware of any published research that uses paradata such as response times, keystrokes, or mouse clicks to adjust for measurement error. In the one study of which we are aware that uses behavior codes for purposes of adjustment, Mathiowetz (1998) suggests incorporating interviewer and respondent behaviors such as ‘qualifying’ an answer (‘I’m not sure’) or whether the interviewer had to probe for an answer into imputation models. Her analyses demonstrate significant improvements in the quality of imputations of the number of health visits when these behaviors are incorporated into the imputation procedure compared to when they are not incorporated. Nonetheless, as reviewed briefly above, there is evidence that these and other types of item-level paradata can provide useful information about the question asking and answering process. Future research could focus on designing and collecting item-level paradata useful for adjusting measurement error at the estimation stage and/or for inclusion in statistical models for data analysis.
4.3 ANALYZING PARADATA
It is apparent from Chapter 3 and the literature review section that paradata have great potential for measurement error research. However, the key challenge with paradata has been and will probably continue to be that of extracting, processing, and analyzing paradata for methodological research and for practical operations. Steps for analyzing paradata are similar to analysis of any type of survey or experimental data—identifying units of analysis, data management, making appropriate transformations to variables, selecting covariates, and selecting appropriate modeling forms. What makes analysis of paradata different and challenging, however, are the details for each of these steps. We now briefly review the steps involved in analyzing paradata. We follow this with four examples of how paradata were actually used to answer important research questions.
4.3.1 Units of Analysis
Paradata identified for measurement error research tend to be hierarchical or nested in nature (see Chapter 3 for a more detailed discussion). Response times, mouse clicks, keystrokes, verbal behaviors, and vocal characteristics are recorded for each action taken for each question item for each respondent, nested within each interviewer for a given survey. For example, in a CAPI survey’s keystroke data files, every time the interviewer presses a key, from entering a survey response to accessing a help menu to exiting the interview, a keystroke is recorded with the corresponding day and time that the keystroke was pressed. In a web survey, each click on the screen by the respondent, including entering an answer, changing their answer, backing up, and switching screens, will be recorded in client-side paradata files. Although each respondent and each interviewer receive the same survey questions, the actions that are taken vary across respondents and interviewers, leading to non-rectangular (unequal numbers of observations per respondent) datasets. As a result, decisions must be made about the level of analysis so that the information can be aggregated accordingly. Depending on specific research questions, paradata can be aggregated at the survey item level, respondent level, or survey level. For instance, the presence or absence or particular keystrokes or mouse clicks for a question is summed to produce the count of those keystrokes or mouse clicks for that question; or response latencies are summed over survey items to obtain the total time taken to complete the full questionnaire for each respondent.
Figure 4.1 illustrates three different levels of aggregation possible in paradata files for an example dataset with two respondents (ID) and two questions (Question). On the left side is the original dataset, recording actions (e.g., clicking on ‘1’ and ‘2’ for respondent 1 on question 1) and the time for each action in seconds (e.g., 0.5 s, 1.2 s). This is the lowest level of aggregation for a paradata file. Action-level data files can be aggregated to question-level data files, displayed on the upper right side of Figure 4.1. Here, the total number of actions is recorded (2 actions for respondent 1) and the total time to complete those actions (0.5 s + 1.2 s = 1.7 s on question 1 for respondent 1) for each question for each respondent. These question-level totals can be summed over all questions for each respondent, resulting in the person-level dataset with the total number of actions over all questions (e.g., 4 for respondent 1) and total time spent on the questions (e.g., 4.1 s for respondent 1).
FIGURE 4.1 Three levels of aggregation for paradata used for measurement error.
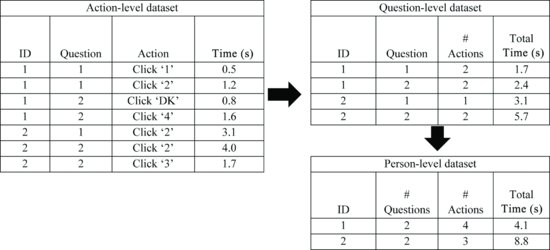
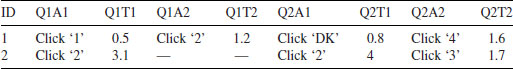
If the paradata file is recorded in a long format with multiple observations for each question for each person as displayed on the left side of Figure 4.1, then ‘by-group’ processing will be necessary to do this kind of aggregation. Alternatively, the paradata file may be recorded in a wide format with multiple variables for each question for each person, as displayed in Table 4.1. In this instance, there will be ‘missing’ values for actions that the respondent did not make (e.g., question 1, action 2 for respondent 2, represented by Q1A2). In this instance, aggregation will require appropriately accounting for these variables for which no action occurred. Question-level analyses can then be aggregated to a section or survey level using similar methods.
Table 4.1 Wide Format for Action-level Paradata File Displayed in Figure 4.1
There is no single appropriate unit of analysis for paradata. As with any other research problem, this decision is tied to the research question and inference one wishes to make. For example, if the objective is to study measurement error on a particular question, then only paradata about that question—or perhaps about actions prior to that question—may be relevant (Tourangeau et al., 2004). If the objective is to study an entire questionnaire, the analyst may aggregate paradata across the questionnaire, losing details about when and where particular events occurred (Olson and Peytchev, 2007). We provide examples of how different forms of paradata are used at different levels of analysis below.
4.3.2 Data Management
Data management with paradata begins as with any other dataset—with basic frequency distributions and descriptive univariate statistics. Each form of paradata has additional unique challenges that lead to different data management steps.
Response times, sometimes called response latencies, have been a focus on analysis in psychological research for many decades, as evidenced by a review by Fazio (1990) of the early use and analysis methods for response latencies. Response latencies are measured as the number of milliseconds until the occurrence of an event. They are constructed by taking the difference in time from the beginning of an event to the end of the event. Software programs may report simply these beginning and end times, requiring the analyst to calculate the total time for the event, or report the time for the event itself. As reported in Chapter 3, large response latencies indicate slow reaction times, whereas small response latencies indicate fast reaction times. In survey research, different from psychological research, is the presence of ‘negative’ response latencies, in which a respondent provides an answer before the interviewer finishes reading the question.
Four data management decisions are common with response timing data: validity of response times, definition of outliers, transformation to address skewed distributions, and baseline adjustment. First, decisions about whether a response timing measurement is ‘valid’ depend heavily on the mode of survey administration and how the timings are measured. In web surveys and in interviewer-administered surveys where latencies are measured simply by recording of keystrokes, ‘validity’ of the latency is related to whether or not time is recorded. In web surveys, a researcher with access to both server-side and client-side response times may need to evaluate whether one is more valid for the research question than another. In interviewer-administered surveys where timings are recorded or evaluated by an interviewer or where they are measured from sound recordings, interviewers and/or analysts may judge a timing measurement as invalid (Bassili and Fletcher (1991), but see Huckfeldt et al. (1999), for a different approach), respondent comments that do not immediately yield a codable answer may be judged as invalid (Bassili and Fletcher, 1991; Bassili, 1996; Bassili and Scott, 1996; Mulligan et al., 2003), or ‘negative’ timings may be judged as invalid (Draisma and Dijkstra, 2004).
Response timing outliers have been defined and dealt with in many ways. The most common method is to define an outlier as a certain number of standard deviations away from the mean length of time. Although times above and below the mean response latency can be considered outliers, generally times a certain distance above the mean latency are considered outliers for survey-based analyses. The most common method of addressing outliers is to exclude them from analyses altogether (Ratcliff, 1993; Heerwegh, 2003; Tourangeau et al., 2004), but analysts have also replaced the outlying values with some predefined large or small value (e.g., top percentile; Yan and Tourangeau, 2008). The distance from the mean for defining an outlier is not fixed, ranging from plus one standard deviation (Malhotra, 2008), two standard deviations (Bassili and Fletcher, 1991; Heerwegh, 2003), three standard deviations from the mean (Mulligan et al., 2003), or above a certain length of time (Tourangeau et al., 2004; Stieger and Reips, 2010). If the issue with the response timing data is a long upper tail rather than outliers, then logarithmic (Bassili, 1993; Malhotra, 2008), square root (Bassili and Krosnick, 2000), or inverse (Fazio, 1990) transformations of the response latencies have been used to make the data more closely approximate a normal distribution. Because of the skew and outlier issues, other measures of central tendency (such as median) that are less prone to outliers and distributional problems have been suggested to replace means for statistical analyses prior to transformation (see Fazio, 1990).
Finally, some people simply respond more quickly than others (e.g., younger vs. older respondents; Yan and Tourangeau, 2008). This difference may be of analytic interest, for example, in studying aging (Yan and Tourangeau, 2008) or differences in attitude accessibility (Lavine et al., 2000). However, the difference may simply be ‘noise’ rather than ‘signal’ (Fazio, 1990), and thus add measurement error to the response timing data, attenuating potential associations between latencies and an outcome of interest. To account for these differences, researchers have subtracted a ‘baseline’ measurement calculated separately for each respondent from the average of response timings to multiple items external to (and usually administered prior to) the questions of interest from the response timing data for the questions of interest (Fazio, 1990; Bassili, 1993; Lenzner et al., 2010). The use of baseline measurements is common in psychological research, but is by no means standard in survey research, and should be used only if differences across respondents in length of responding are not of analytic interest.
Keystroke data records keys pressed by interviewers or respondents and mouse click data specifically record mouse clicks and movements. Data management for these two types of paradata is intimately tied to the level of analysis (e.g., the action, question, section or survey level, or respondent/interviewer level). Unlike response latencies, keystroke and mouse click data are dichotomous measures of the occurrence or non-occurrence of an event. As such, data management requires identifying whether there are large enough frequencies of a particular type of keystroke or mouse click to analyze statistically. Keystrokes or mouse clicks that occur infrequently are rare events and may not be analyzable. For example, Caspar and Couper (1997) found only three instances of use of a ‘back-up’ key in the review of the National Household Survey on Drug Abuse audit trails data. In experimental research, prevalence of outcomes must be considered overall and for each experimental condition. For instance, Stern (2008) found few instances of changing answers when respondents were asked to respond via a number box, but higher rates (4–10%) of changing answers with various types of radio button response formats.
Since rare events can be difficult to use in multivariate models, they may be combined with other similar events or to a higher level of aggregation for analysis. When keystrokes or mouse clicks are aggregated, they become counts of events rather than the presence or absence of certain events. For instance, the use of a ‘back-up’ key can be aggregated to the total number of times this ‘back-up’ key was used in a particular section or questionnaire for a given respondent. When the use (or non-use) of certain keystrokes or mouse clicks is concentrated among a small number of respondents or interviewers, analysts may choose to dichotomize the aggregate count measures to indicate that the event never occurred versus the event occurring at least once for a particular respondent. For example, Couper and Schlegel (1998) found that only 9% of interviews in the NHIS used the ‘help’ screen at any time.
Paradata that record the behaviors that occur during the interaction between the interviewer and respondent in a survey interview, known as behavior codes, require multiple steps of data management. First, a decision must be made as to whether the behavior codes will be obtained by listening to an audio recording or the interview itself, or whether each interview to be behavior coded will be transcribed to conduct behavior coding. More detailed behavior coding schemes are facilitated by transcriptions of interviews, whereas less detailed behavior coding schemes can be easily implemented by listening to the interview itself. Second, a coding scheme is developed, either from existing schemes or built anew. Third, these codes are applied to (a sample of) the transcripts or audio recordings by at least two coders, and the reliability of these codes assessed through the percent of codes that match across coders, kappa statistics, or intraclass correlation coefficients. Fourth, unreliable codes are dropped or aggregated. For example, Brick et al. (1997) audio-recorded 70 interviews from the 1993 National Household Education Survey for purposes of behavior coding to understand data quality. Coding was conducted from the audio recordings themselves, so only five interviewer behaviors were coded (three related to question reading, one on providing clarification, and one code for ‘displayed some affect’) and six respondent behaviors were coded. Reliability was assessed through the percent of codes that matched across coders, with higher levels of agreement for respondent behaviors (over 80%) than for interviewer behaviors (from 58% to 78%). Since interviewer behaviors were less reliable than desired, the authors combined two of the interviewer behaviors together, increasing the match rate between coders to around 90% (Brick et al., 1997, pp. 3–8). For a thorough review of behavior coding schemes and each of these steps of data management (see Ongena and Dijkstra, 2006).
Behavior codes are often combined or aggregated to improve precision in analyses or to identify particular combinations of behaviors. Furthermore, conceptually similar or highly correlated codes may also be combined to ease interpretability and to minimize multicollinearity. Combinations of behaviors may reflect a particular sequence of events during an interview. For example, ‘straightforward’ or ‘paradigmatic’ sequences, such as those in which an interviewer asks a question and a respondent provides an answer, may be of particular interest (Sykes and Collins, 1992; Garbarski et al., 2011). Alternatively, behaviors may be combined using factor analyses to reflect particular concepts, such as ‘rapport’ and ‘cognitive difficulty’ (see Belli et al., 2001).
Vocal characteristics measured from audio recordings—such as pitch—require a similar type of data management as behavior codes, in which audio recordings are processed through a software program such as Praat (http://www.fon.hum.uva.nl/praat/). In this software, analysts select various vocal characteristics of interest, such as the average, minimum and maximum pitch (fundamental frequency), among various other characteristics. Because these characteristics have received only limited empirical attention in the measurement error literature, appropriate data management strategies for survey-related questions cannot be discussed fully here. In analyses for nonresponse, measures of vocal characteristics related to pitch and speech rate are used directly with little transformation, reduction, or identification of outliers (Jans, 2010; Benkí et al., 2011).
Interviewer evaluations of aspects of the interview such as the respondent’s level of cooperation during the interview or his/her understanding of the survey questions are the most straightforward of the various measurement-error-related paradata to analyze. Most often, these measures are included directly in a substantive model as a covariate (Duff et al., 2007). The most common data management issue with these paradata is that of missing data. Hurtado (1994) reports item missing rates between 3% and 5% for six different interviewer evaluations. Additionally, if multiple questions are asked of interviewers, they may be highly correlated. As with any set of highly correlated survey items, interviewer evaluations may be combined in a scale (Kaminska et al., 2010) or one or two may be selected as exemplar observations (Herzog et al., 1988).
4.3.3 Other Auxiliary Variables
Paradata, as with any other type of data, often require contextual information for analyses. These contextual data can be especially important when examining multiple questions in the same questionnaire simultaneously. In this case, the number of words per question can be associated with the length of time spent processing a particular question, especially when measuring response latencies from the beginning of a question being displayed on a page to the entering of a response. For example, Couper and Kreuter (2013) and Yan and Tourangeau (2008) find a positive association between the amount of time spent on a question and the number of words per question in a face-to-face and web survey, respectively. Alternatively, the number of words in a question can be used during data management to ‘standardize’ response latencies across items to reflect the number of seconds per word (Couper and Kreuter, 2013). An alternative related measure for standardization of questions across items in interviewer-administered surveys is to create a ‘gold standard’ measurement of the length of the questions from an experienced interviewer reading the questions (Caspar and Couper, 1997; Couper et al., 2009). The length of the audio recording for each question can be compared against the length of the audio recordings from the field administration, accounting for longer or shorter questions.
Other covariates that may be relevant for analyses using paradata include question and/or screen attributes. The placement of a question in a questionnaire may be used when examining potential respondent fatigue (Savage and Waldman, 2008; Galesic and Bosnjak, 2009) or ‘contagion’ of particular events or behaviors in which the occurrence of one event (such as saying don’t know) early in the instrument increases the likelihood of this event occurring later in the instrument (Hill, 1993). Question and response option ‘complexity’ (Yan and Tourangeau, 2008) and auxiliary screen information such as interviewer instructions or the requirement for a show card (Couper and Kreuter, 2013) have also been used to explain variability in response latencies across questions in the entire questionnaire. These characteristics may be coded by human coders, by using measures of reading complexity in a program such as Microsoft Word, or through a computerized tool such as QUAID (http://mnemosyne.csl.psyc.memphis.edu/QUAID/quaidindex.html) to identify potential problems with questions.
4.3.4 Modeling Decisions
Decisions for analytic methods for paradata vary depending on whether a single item or multiple items are being examined and by the type of paradata. Many analyses of response latencies simply compare mean latencies (Heerwegh and Loosveldt, 2000; Healey, 2007). Transformations of the dependent variable discussed above to make response latency data (e.g., log or square root transformations) more normally distributed facilitate use of OLS models (Huckfeldt et al., 1998). Survival models or Cox proportional hazards models have also been employed with the response latency defining ‘time to event’ (Mulligan et al., 2003; Johnson, 2004; Grant et al., 2010). For predicting other forms of paradata, such as mouse clicks, keystrokes, and behavior codes, other modeling forms, such as logistic regression or event history analyses (Lepkowski et al., 2000) are more common because the variables formed from these paradata tend to be dichotomous. If paradata are used as an independent variable, then the same kind of transformations discussed above (logarithmic transformation, creating categories, collapsing categories) may be necessary to yield more informative or stable estimates.
A complicating factor in the analysis of paradata is the presence of multiple observations for the same respondent/interviewer. When analyzed simultaneously, these paradata violate the assumption of independence for most statistical models. As a result, multilevel or random effects models have been employed to account for the correlation of outcomes within the same respondent (Yan and Tourangeau, 2008; Couper and Kreuter, 2013). For behavior codes, multilevel logistic models have been employed (Johnson et al., 2006). Although some paradata are collected for surveys with complex sample designs, few paradata analyses directly account for sample design.
4.4 FOUR EMPIRICAL EXAMPLES
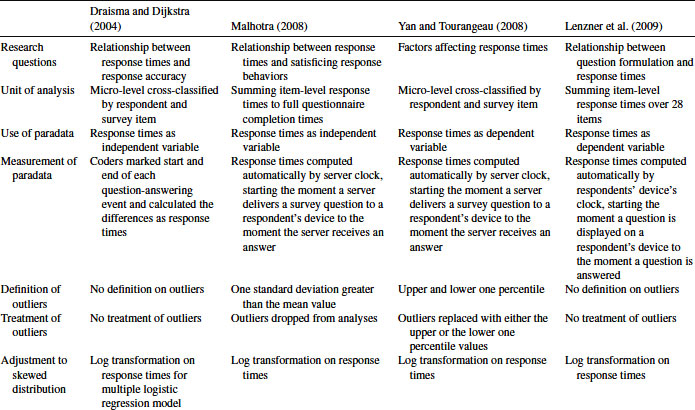
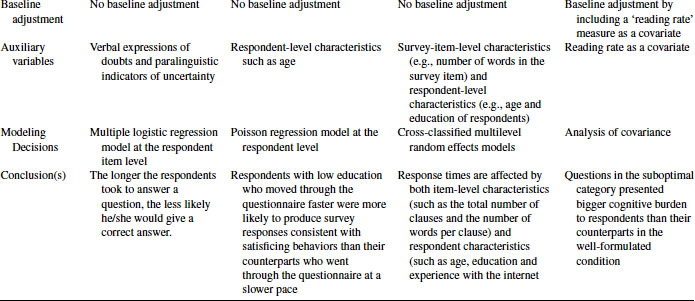
This section provides four examples of using paradata for measurement error research. One thing in common among the four studies is the use of response time data. However, the four examples differ in many other aspects such as how response times are obtained and calculated, whether or not response times are trimmed and/or transformed, the complexity of the analyses involving paradata, the formulation of research questions or hypotheses involving paradata, the interpretation of response times, the level at which response times are analyzed and whether response times are used as a dependent variable or an independent variable. Table 4.2 displays how the four studies deal with the measurement, treatment, and use of response times in their analyses.
Table 4.2 Four Examples of Response Times Studies
4.4.1 Draisma and Dijkstra (2004)—Item Level: Paradata as an Independent Variable
Draisma and Dijkstra (2004) examined response times (as well as paralinguistic expressions) as an indicator of response error using data from two telephone surveys. In both studies, they chose survey questions for which the true scores for individual respondents can be determined. The telephone interviews were audio-taped. Response times for individual questions were determined by coders who listened to the tapes and marked the start and end time of a question-answering event. Response times were calculated as the duration between the end time of question reading and the start time of responding.
Draisma and Dijkstra's (2004) research interest on response times lies in the relationship between response times and response accuracy. To examine this research question, they fitted a multiple logistic regression model to examine each survey. The final datasets are at the question level; that is, each record of the dataset contains a response to a survey item by a survey respondent and the time it took that respondent to answer that survey item. The dependent variable is whether or not a respondent gave a correct answer to a survey question. One of the independent variables is the amount of time taken by a respondent to answer a survey question. Draisma and Dijkstra (2004; Table 7.8, p. 144) found a significant negative coefficient for the response times (B = −0.19, SE(B) = 0.08 for study 1 and B = −0.18, SE(B) = 0.08 for study 2). The negative coefficient for the response times suggest that the longer the respondents took to answer a question, the less likely he/she gives a correct answer.
4.4.2 Malhotra (2008)—Survey Level: Paradata as an Independent Variable
The response time data for Malhotra (2008) are generated from a web survey completed by a nationally representative sample of American adults. Instead of focusing on response times for an individual survey question, Malhotra (2008) is interested in the time respondents spent completing the full questionnaire. The response time measure in his study is an aggregate measure at the questionnaire level. He normalized the survey-level response times by taking their natural logs and dropped outliers at least one standard deviation greater than the mean value.
The resultant dataset for analysis is at the respondent level—that is, each record contains the respondent’s completion time for the entire questionnaire. The outcome variable of interest is the number of times he/she produced responses consistent with satisficing behaviors. The dataset also contains other variables at the respondent level.
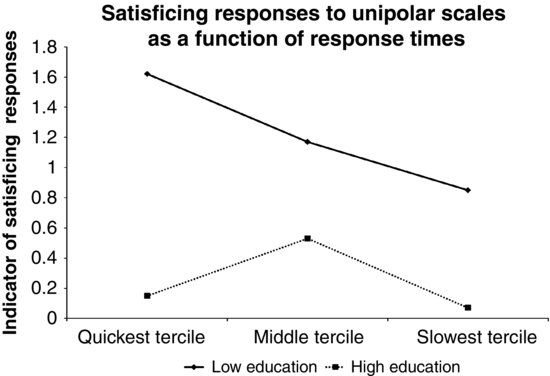
To address the research question of whether or not faster respondents are more likely to show satisficing response behaviors, Malhotra conducted three types of analyses. (All analyses are weighted.) In the first two analyses, Malhotra divided respondents into three groups based on their overall response times and showed that low-education respondents in the fastest group exhibited the most primacy effects (in Table 3 on p. 922 and Table 4 on p. 924). Figure 4.2 plots partial data reported in Table 3. In the third analysis, he fitted a Poisson regression model with overall response times as one of the independent variables and satisficing responses as the dependent variable. Malhotra (2008) found significant positive coefficients for the interaction between overall response times and the response order treatment for low-education respondents (interaction effect coefficient = 0.28, SE(B) = 0.16, when the dependent variable is calculated using all the five items and B = 0.70, SE(B) = 0.27, when the dependent variable is calculated using only rating scales; see Table 5 on p. 925 for additional modeling results). The significant positive interaction effects between the overall response times and the response order treatment for low-education respondents suggest that respondents with low education who moved through the questionnaire faster were more likely to produce survey responses consistent with satisficing behaviors than their counterparts who went through the questionnaire at a slower pace.
FIGURE 4.2 Satisficing response behaviors as a function of response times. Data taken from Table 3 in Malhotra (2008).
4.4.3 Yan and Tourangeau (2008)—Item Level: Paradata as a Dependent Variable
Unlike the previous two examples, Yan and Tourangeau (2008) studied response times as a dependent variable and attempted to determine factors affecting response times to different survey items by different respondents. Their response times are at the item level. Specifically, they focused on server-side response times, which start the moment a server delivers a survey question to a respondent’s device and ends with the moment when it receives an answer from the respondent. As a result, the response time measure in Yan and Tourangeau (2008) covers question downloading, question reading, response selecting, and uploading time.1
The authors trimmed outlying response times by replacing values above the upper one percentile or below the lower one percentile with the upper and lower one percentile values separately. In addition, they took a log transformation of the response times before analysis.
The resultant dataset is cross-classified by survey items and survey respondents; that is, each record contains a response time measure taken by a respondent to answer a question. A cross-classified multilevel random effects model is used to estimate the effects of item-level and respondent-level characteristics on timing. The modeling results indicate that response times are affected by both item-level characteristics (such as the total number of clauses and the number of words per clause) and respondent characteristics (such as age, education, and experience with the internet).
4.4.4 Lenzner, Kaczmirek, and Lenzner (2010)—Survey Level: Paradata as a Dependent Variable
The response times data used by Lenzner and colleagues are also generated from a web survey. Different from Yan and Tourangeau (2008), Lenzner et al. (2010) used client-side response times, which include the elapsed time from when a question is presented on a respondent’s device to when a response is selected. As a result, this type of response time measure does not include downloading or uploading time.
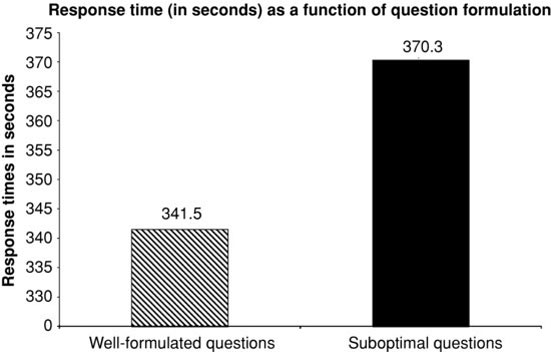
Lenzner and colleagues also took a logarithmic transformation on the response times, but they did not trim or drop outliers before or after the logarithmic transformation. Lenzner and colleagues consider response times as an indicator of cognitive burden (and therefore an indicator of measurement error) and analyzed them as a function of question formulation. They grouped 28 questions into 2 categories—well-formulated and suboptimal question formulations; questions in the “suboptimal” category contain one or more text features believed to negatively affect question clarity. An overall response time is calculated by summing response times to all 28 individual survey questions. The resulted dataset is at the respondent level.
A one-factor analysis of covariance is conducted on the overall response times with question formulation as the factor and reading rate as a covariate. As shown in Figure 4.3, Lenzner et al. (2010, p. 1013) found that respondents, on average, took longer to answer questions in the suboptimal category than those in the well-formulated category, suggesting that questions in the suboptimal category presented bigger cognitive burden to respondents than their counterparts in the well-formulated condition.
FIGURE 4.3 Response times as a function of question formulation. Adapted from data reported in Lenzner et al. (2010).
4.5 CAUTIONS
Paradata are a useful tool for understanding intricacies in how respondents and interviewers interact with questionnaires. As with any set of data, paradata are best used when their selection and use is driven by a research question and relevant theory. As Fazio (1990, p. 89) said, “There may be nothing scientifically less meaningful than the simple observation that subjects responded in x milliseconds.” As such, what one can learn from paradata depends highly on what is measured, at what level of analysis, and for what mode.
As with any type of data, paradata have potential measurement errors. These include differential speed of computers and browsers in web surveys, multiple actors in telephone and face-to-face surveys, and potential errors due to coding problems. For certain types of paradata, missing data may also be an issue, as are the host of data management issues reviewed above. Thus, paradata are not a panacea for error-free measurement of respondent and interviewer behaviors during surveys external to the survey data themselves. They do, however, provide useful unobtrusive insights into the process of asking and answering survey questions not directly observable from the responses themselves.
As mentioned earlier, paradata identified for measurement error research (keystrokes, response times, and behavior codes) are cross-classified by survey respondents and survey items; that is, these paradata are nested within cells cross-classified by survey respondents and survey items. Such a nesting nature of the data inevitably creates dependency in keystrokes or response times within respondents and within survey items. Said another way, paradata outcomes for the same respondent are likely to be correlated across questions and paradata outcomes for the same question are likely to be correlated across respondents. As a result, analyses of paradata of this type need to be aware of potential increase to the variance of parameter estimates due to the intra-respondent and intra-item correlations. Appropriate modeling forms such as hierarchical or random effects models (Raudenbush and Bryk, 2002) are now routinely available in most standard statistical analysis packages (see Chapter 12 for a discussion of multilevel models in the context of paradata for nonresponse).
Furthermore, caution should be taken when trying to aggregate cross-classified paradata to either respondent or item level. Even though single-level data (whether respondent level or item level) are easier to handle and analyze, the loss of information could also produce analytic problems such as aggregation bias, misestimated standard errors, heterogeneity of regression slopes, and systematic misestimation of group effects.
In addition to the nested nature of paradata, outlying values and skewed distributions inherent in most of paradata present additional analytical challenges. As discussed in Section 4.3.2, the literature documents a variety of ways to handle outliers and to reduce skewed distributions. It is recommended that analysts use an assortment of methods to account for outliers and check the sensitivity of their conclusions to these decisions.
4.6 CONCLUDING REMARKS
This chapter continues the discussion of Chapter 3 by providing a brief review of current literature that has used paradata to investigate measurement error in surveys. Steps are identified for transforming paradata from raw data to an analyzable state. Actual examples of paradata analysis are also provided. Interpretation and analytic challenges with paradata are described.
For survey researchers, we believe that paradata are very useful as indicators of measurement error, testing theories on response mechanisms, and furthering investigation under the total survey error framework. However, there is a gap in the current research for the use of paradata for measurement error reduction and adjustment. We encourage survey researchers to think about bringing paradata into the picture when adjusting for measurement error. We also encourage the survey researchers to think about how to best design and collect paradata so that they are useful for methodological investigations.
For survey practitioners, we suggest that paradata should be built into data collection efforts whenever possible, and that regular resources be dedicated to analysis of paradata. This is because paradata have been shown very useful in improving and monitoring data collection processes for nonresponse error (see Chapters 1 and 2). Measurement error has received less attention in this area, but the limited use in monitoring interviewers proves promising. Additionally, time-based clarifications or probing, shown to be useful in web surveys, could be built into interviewer-administered surveys, urging interviewers to provide clarifications when respondents take very long to answer a question, for example.
For supervisors of field interviewers, we encourage the development of systems that permits them to actively use results from paradata research into their data collection work. For instance, supervisors could target retraining or monitoring toward interviewers who tend to have shorter than average interviews.
In general, paradata for purposes of measurement error investigation have a variety of complexities. However, even simple analyses of paradata at highly aggregate levels can be informative about what is happening during a survey interview. We encourage further analysis of paradata to reveal their strengths and weaknesses.
REFERENCES
Bassili, J. (1993). Response Latency Versus Certainty as Indexes of the Strength of Voting Intentions in a Cati Survey. The Public Opinion Quarterly, 57(1):54–61.
Bassili, J. (1995). Response Latency and the Accessibility of Voting Intentions: What Contributes to Accessibility and how it Affects Vote Choice. Personality and Social Psychological Bulletin, 21(7):686–695.
Bassili, J. (1996). The How and Why of Response Latency Measurement in Telephone Surveys. In Schwarz, N. and Sudman, S., editors, Answering Questions: Methodology for Determining Cognitive and Communicative Processes in Survey Research, pages 319–346. Jossey-Bass Publishers.
Bassili, J. and Fletcher, J. (1991). Response-Time Measurement in Survey Research a Method for CATI and a New Look at Nonattitudes. Public Opinion Quarterly, 55(3):331–346.
Bassili, J. and Krosnick, J.A. (2000). Do Strength-Related Attitude Properties Determine Susceptibility to Response Effects? New Evidence from Response Latency, Attitude Extremity, and Aggregate Indices. Political Psychology, 21(1):107–132.
Bassili, J. and Scott, B. (1996). Response Latency as a Signal to Question Problems in Survey Research. Public Opinion Quarterly, 60(3):390–399.
Belli, R., Lepkowski, J.M., and Kabeto, M. (2001). The Respective Roles of Cognitive Processing Difficulty and Conversational Rapport on the Accuracy of Retrospective Reports of Doctor’s Office Visits. In Cynamon, M., and Kulka, R., editors, Seventh Conference of Health Survey Research Methods, pages 197--203. DHHS Publication No. (PHS) 01-1013. US Government Printing Office, Hyattsville, MD.
Benkí, J.R., Broome, J., Conrad, F.G., Groves, R.M., and Kreuter, F. (2011). Effects of Speech Rate, Pitch, and Pausing on Survey Participation Decisions. Paper presented at the American Association for Public Opinion Research Annual Meeting, Phoenix, AZ.
Biemer, P.P. and Lyberg, L.E. (2003). Introduction to Survey Quality. Wiley and Sons, Inc., New York.
Brick, J., Tubbs, E., Collins, M., Nolin, M., Cantor, D., Levin, K., and Carnes, Y. (1997). Telephone Coverage Bias and Recorded Interviews in the 1993 National Household Education Survey (NHES: 93), U.S. Department of Education, Washington, DC.
Callegaro, M., Yang, Y., Bhola, D., Dillman, D., and Chin, T. (2009). Response Latency as an Indicator of Optimizing in Online Questionnaires. Bulletin de Methodologie Sociologique, 103(1):5–25.
Caspar, R. and Couper, M.P. (1997). Using Keystroke Files to Assess Respondent Difficulties. Proceedings of the ASA, Survey Research Methods Section, pages 239–24.
Conrad, F.G., Couper, M.P., Tourangeau, R., and Peytchev, A. (2006). Use and Non-use of Clarification Features in Web Surveys. Journal of Official Statistics, 22:245–269.
Conrad, F.G., Schober, M., and Coiner, T. (2007). Bringing Features of Human Dialogue to Web Surveys. Applied Cognitive Psychology, 21(2):165–187.
Conrad, F.G., Schober, M., and Dijkstra, W. (2004). Non-verbal Cues of Respondents’ Need for Clarification in Survey Interviews. Proceedings of the ASA, Section on Survey Methods Research, pages 4934–4950.
Conrad, F.G., Schober, M., and Dijkstra, W. (2008). Cues of Communication Difficulty in Telephone Interviews. In Lepkowski, J.M., Tucker, C., Brick, J.M., Leeuw, E.D.D., Japec, L., Lavrakas, P.J., Link, M.W., and Sangster, R.L., editors, Advances in Telephone Survey Methodology, pages 212–230. Wiley and Sons, Inc.
Conrad, F.G., Tourangeau, R., Couper, M.P., and Zhang, C. (2011). Interactive Interventions in Web Surveys can Increase Response Accuracy. Paper presented at Annual Conference of the American Association for Public Opinion Research.
Couper, M.P. (1998). Measuring Survey Quality in a CASIC Environment. Proceedings of the Survey Research Methods Section, ASA, pages 41–49.
Couper, M.P. (2000). Usability Evaluation of Computer-Assisted Survey Instruments. Social Science Computer Review, 18(4):384–396.
Couper, M.P. (2009). The Role of Paradata in Measuring and Reducing Measurement Error in Surveys. Paper Presented at NCRM Network for Methodological Innovation 2009: The Use of Paradata in UK Social Surveys.
Couper, M.P., Hansen, S., and Sadosky, S. (1997a). Evaluating Interviewer Use of CAPI Technology. In Lyberg, L., Biemer, P., Collins, M., De Leeuw, E., Dippo, C., Schwarz, N., and Trewin, D., editors, Survey Measurement and Process Quality, pages 267--285. Wiley and Sons, Inc.
Couper, M.P., Horm, J., and Schlegel, J. (1997b). Using Trace Files to Evaluate the National Health Interview Survey CAPI Instrument. Proceedings of Survey Research Methods Section, ASA, pages 825–829.
Couper, M.P., Sadosky, S., and Hansen, S. (1994). Measuring Interviewer Performance Using CAPI. Survey Research Center.
Couper, M.P. and Schlegel, J. (1998). Evaluating the NHIS CAPI Instrument Using Trace Files. Proceedings of the ASA, Survey Research Methods Section, pages 923–927.
Couper, M.P., Tourangeau, R., and Marvin, T. (2009). Taking the Audio Out of Audio-CASI. Public Opinion Quarterly, 73(2):281–303.
Couper, M.P. and Kreuter, F. (2013). Using Paradata to Explore Item Level Response Times in Surveys. Journal of the Royal Statistical Society, A: Statistics in Society. 176(1): 271--286.
Draisma, S. and Dijkstra, W. (2004). Response Latency and (Para)Linguistic Expressions as Indicators of Response Error. In Presser, S., Rothgeb, J.M., Couper, M.P., Lessler, J.T., Martin, E., Martin, J., and Singer, E., editors, Methods for Testing and Evaluating Survey Questionnaires, pages 131–147. Wiley and Sons, Inc.
Duff, B., Hanmer, M.J., Park, W., and White, I.K. (2007). Good Excuses: Understanding Who Votes With An Improved Turnout Question. Public Opinion Quarterly, 71(1):67–90.
Dykema, J., Lepkowski, J.M., and Blixt, S. (1997). The Effect of Interviewer and Respondent Behavior on Data Quality: Analysis of Interaction Coding in a Validation Study. In Lyberg, L., Biemer, P., Collins, M., de Leeuw, E.D., Dippo, C., Schwarz, N., and Trewin, D., editors, Survey Measurement and Process Quality, pages 287–310. Wiley and Sons, Inc., New York.
Fazio, R.H. (1990). A Practical Guide to the Use of Response Latency in Social Psychological Research. In Hendrick, C. and Clark, M.S., editors, Review of Personality and Social Psychology, Research Methods in Personality and Social Psychology, volume 11, pages 74–97. Sage Publications.
Fletcher, J.F. (2000). Two-Timing: Politics and Response Latencies in a Bilingual. Political Psychology.
Fowler, F. (2011). Coding the Behavior of Interviewers and Respondents to Evaluate Survey Questions. In Madans, J., Miller, K., Maitland, A., and Willis, G., editors, Question Evaluation Methods: Contributing to the Science of Data Quality, pages 7–21. Wiley and Sons, Inc.
Galesic, M. and Bosnjak, M. (2009). Effects of Questionnaire Length on Participation and Indicators of Response Quality in a Web Survey. Public Opinion Quarterly, 73(2):349–360.
Garbarski, D., Schaeffer, N.C., and Dykema, J. (2011). Are Interactional Behaviors exhibited when the Self-reported Health Question is asked Associated with Health Status? Social Science Research, 40(4):1025–1036.
Grant, J.T., Mockabee, S.T., and Monson, J.Q. (2010). Campaign Effects on the Accessibility of Party Identification. Political Research Quarterly, 63(4):811–821.
Groves, R.M. (1989). Survey Errors and Survey Costs. Wiley and Sons, Inc., New York.
Hansen, S., Fuchs, M., and Couper, M.P. (1997). CAI Instrument Usability Testing. Proceedings of Survey Research Methods Section, ASA, pages 1023–1028.
Healey, B. (2007). Drop Downs and Scroll Mice: The Effect of Response Option Format and Input Mechanism Employed on Data Quality in Web Surveys. Social Science Computer Review, 25(1):111–128.
Heerwegh, D. (2002). Describing Response Behavior in Websurveys Using Client Side Paradata. Paper presented at the International Workshop on Web Surveys held at ZUMA, Mannheim, Germany, October 25, 2002.
Heerwegh, D. (2003). Explaining Response Latencies and Changing Answers Using Client-Side Paradata from a Web Survey. Social Science Computer Review, 21(3):360–373.
Heerwegh, D. and Loosveldt, G. (2000). An Evaluation of the Effect of Response Formats on Data Quality in Web Surveys. Social Science Computer Review, 20(4):471–484.
Herzog, A.R., Rodgers, W.L., and Kulka, R.A. (1988). Interviewing Older Adults. Mode Comparison Using Data from a Face-to-Face Survey and a Telephone Resurvey. Public Opinion Quarterly, 52(1):84–99.
Hill, D.H. (1993). Response and Sequencing Errors in Surveys: A Discrete Contagious Regression Analysis. Journal of the ASA, 88(423):775–781.
Huckfeldt, R., Levine, J., Morgan, W., and Sprague, J. (1998). Election Campaigns, Social Communication, and the Accessibility of Perceived Discussant Preference. Political Behavior, 20(4):263–294.
Huckfeldt, R., Levine, J., Morgan, W., and Sprague, J. (1999). Accessibility and the Political Utility of Partisan and Ideological Orientations. American Journal of Political Science, 43(3):888–911.
Huckfeldt, R. and Sprague, J. (2000). Political Consequences of Inconsistency: The Accessibility and Stability of Abortion Attitudes. Political Psychology, pages 57–79.
Hurtado, A. (1994). Does Similarity Breed Respect: Interviewer Evaluations of Mexican-Descent Respondents in a Bilingual Survey. Public Opinion Quarterly, 58(1):77–95.
Jans, M.E. (2010). Verbal Paradata and Survey Error: Respondent Speech, Voice, and Question-Answering Behavior Can Predict Income Item Nonresponse. PhD thesis, University of Michigan, Ann Arbor, MI.
Johnson, M. (2004). Timepieces: Components of Survey Question Response Latencies. Political Psychology, 25(5):679–702.
Johnson, T.P., Cho, Y.I.K., Holbrook, A.L., O’Rourke, D., Warnecke, R.B., and Chavez, N. (2006). Cultural Variability in the Effects of Question Design Features on Respondent Comprehension of Health Surveys. Annals of Epidemiology, 16(9):661–668.
Kaminska, O., McCutcheon, A.L., and Billiet, J. (2010). Satisficing Among Reluctant Respondents in a Cross-National Context. Public Opinion Quarterly, 74(5):956–984.
Krosnick, J.A. (1999). Survey Research. Annual Review of Psychology, 50(3):537–567.
Krosnick, J.A. (1991). Response Strategies for Coping with the Cognitive Demands of Attitude Measures in Surveys. Applied Cognitive Psychology, 5(3):213–236.
Lavine, H., Borgida, E., and Sullivan, J.L. (2000). On the Relationship between Attitude Involvement and Attitude Accessibility: Toward a Cognitive-Motivational Model of Political Information Processing. Political Psychology, 21(1):81–106.
Lenzner, T., Kaczmirek, L., and Lenzner, A. (2010). Cognitive Burden of Survey Questions and Response Times: A Psycholinguistic Experiment. Applied Cognitive Psychology, 24(7):1003–1020.
Lepkowski, J.M., Couper, M.P., Hansen, S.E., Landers, W., McGonagle, K.A., and Shlegel, J. (1998). CAPI Instrument Evaluation: Behavior Coding, Trace Files and Usability Methods. Proceedings of Survey Research Methods Section, ASA, pages 917–922.
Lepkowski, J.M., Siu, V., and Fisher, J. (2000). Event History Analysis of Interviewer and Respondent Survey Behavior. Metodoloski Zvezki, 15:3–20.
Lynn, P. and Nicolaas, G. (2010). Making Good Use of Survey Paradata. Survey Practice.
Malhotra, N. (2008). Completion Time and Response Order Effects in Web Surveys. Public Opinion Quarterly, 72(5):914–934.
Mathiowetz, N.A. (1998). Respondent Expressions of Uncertainty: Data Source for Imputation. Public Opinion Quarterly, 62(1):47.
Mockovak, W. and Powers, R. (2008). The Use of Paradata for Evaluating Interviewer Training and Performance. In Proceedings of the Section on Survey Research Methods of the ASA, pages 1386–1389.
Mulligan, K., Grant, T., Monson, Q., and Mockabee, S. (2003). Response Latency Methodology for Survey Research: Measurement and Modeling Strategies. Political Analysis, 11(3):289–301.
Olson, K. and Peytchev, A. (2007). Effect of Interviewer Experience on Interview Pace and Interviewer Attitudes. Public Opinion Quarterly, 71(2):273–286.
Ongena, Y.P. and Dijkstra, W. (2006). Methods of Behavior Coding of Survey Interviews. Journal of Official Statistics, 22(3):419–451.
Ratcliff, R. (1993). Methods for Dealing with Reaction Time Outliers. Psychological Bulletin, 114(3):510–532.
Raudenbush, S. and Bryk, A. (2002). Hierarchical Linear Models: Applications and Data Analysis Methods. 2nd edition. Sage Publications.
Savage, S.J. and Waldman, D.M. (2008). Learning and Fatigue during Choice Experiments: A Comparison of Online and Mail Survey Modes. Journal of Applied Econometrics, 23(3):351–371.
Schaeffer, N.C. and Dykema, J. (2011). Response 1 to Fowler’s Chapter: Coding the Behavior of Interviewers and Respondents to Evaluate Survey Questions. In Madans, J., Miller, K., A., M., and Willis, G., editors, Question Evaluation Methods: Contributing to the Science of Data Quality, pages 23–39. Wiley and Sons, Inc.
Smyth, J.D., Dillman, D.A., Christian, L.M., and Stern, M.J. (2006). Comparing Check-all and Forced-choice Question Formats in Web Surveys. Public Opinion Quarterly, 70(1):66–77.
Stern, M.J. (2008). The Use of Client-Side Paradata in Analyzing the Effects of Visual Layout on Changing Responses in Web Surveys. Field Methods, 20(4):377–398.
Stieger, S. and Reips, U-D. (2010). What Are Participants Doing While Filling in an Online Questionnaire: A Paradata Collection Tool and an Empirical Study. Computers in Human Behavior, 26(6):1488–1495.
Sykes, W. and Collins, M. (1992). Anatomy of the Survey Interview. Journal of Official Statistics, 8(3):277–291.
Tourangeau, R., Couper, M.P., and Conrad, F.G. (2004). Spacing, Position, and Order—Interpretive Heuristics for Visual Features of Survey Questions. Public Opinion Quarterly, 68(3):368–393.
Tourangeau, R., Rips, L.J., and Rasinski, K.A. (2000). The Psychology of Survey Response. Cambridge University Press.
Yan, T. and Tourangeau, R. (2008). Fast Times and Easy Questions: The Effects of Age, Experience and Question Complexity on Web Survey Response Times. Applied Cognitive Psychology, 22(1):51–68.
1. See Chapter 3 for more information on server-side versus client-side paradata, Yan and Tourangeau (2008) for detailed analyses on the comparison between server-side and client-side response times.