With BenchmarkDotnet, we can also diagnose any problems with the memory and measure the number of allocated bytes and garbage collection.
It can be implemented using a MemoryDiagnoser attribute at the class level. To start, let's just add the MemoryDiagnoser attribute to the TestBenchmark class that we created in the last example:
[MemoryDiagnoser]
public class TestBenchmark {}
Rerun the application. Now it will collect other memory allocation and garbage collection information and generate logs accordingly:
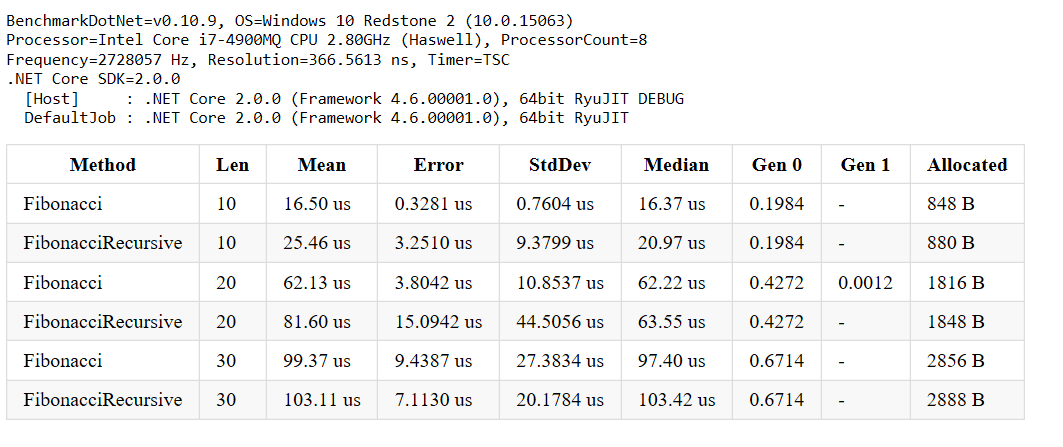
In the preceding table, the Gen 0 and Gen 1 columns each contain the number of that particular generation per 1,000 operations. If the value is 1, then it means that the garbage collection was done after 1,000 operations. However, note that in the first row, the value is 0.1984, which means that the garbage collection was done after 198.4 seconds, whereas for Gen 1 of that row, no garbage collection took place. Allocated represents the size of the memory that is allocated while invoking that method. It does not include the Stackalloc/heap native allocations.